The reliability of a tapping test as an indicator of cricket
bat performance
CURTIS, David <http://orcid.org/0000-0002-2244-3318>, HURT, Georgina and
HELLER, Ben <http://orcid.org/0000-0003-0805-8170>
Available from Sheffield Hallam University Research Archive (SHURA) at:
http://shura.shu.ac.uk/8350/
This document is the author deposited version. You are advised to consult the
publisher's version if you wish to cite from it.
Published version
CURTIS, David, HURT, Georgina and HELLER, Ben (2014). The reliability of a
tapping test as an indicator of cricket bat performance. Procedia Engineering, 72,
666-671.
Copyright and re-use policy
See
http://shura.shu.ac.uk/information.html
Sheffield Hallam University Research Archive
Procedia Engineering 00 (2013) 000–000
www.elsevier.com/locate/procedia
1877-7058 © 2014 The Authors. Published by Elsevier Ltd.
Selection and peer-review under responsibility of the Centre for Sports Engineering Research, Sheffield Hallam University.
The 2014 conference of the International Sports Engineering Association
The reliability of a tapping test as an indicator of cricket bat
performance
David Curtis
a*, Georgina Hurt
a, Ben Heller
aaCentre for Sports Engineering Research (CSER), Sheffield Hallam University, Collegiate Campus, Sheffield, S10 2BP, UK
Abstract
Within the sport of cricket it is common practice for players to tap the blade of a bat with a hard wood mallet or cricket ball to gauge its potential playing performance. This subjective assessment can produce contradictory opinions on the same bat. The aim of this study was to investigate the reliability of the ‘tapping’ test in rating the potential performance of cricket bats. This was done by comparing a measurable performance indicator (apparent coefficient of restitution, ACoR) to player assessment. Twenty experienced amateur and semi-pro cricketers completed a scaled-response questionnaire to describe the sound and feel of impact during the ‘tapping’ test, and rate the predicted performance. Correlations between player responses and ACoR were explored. Predicted bat performance by three out of twenty participants showed correlation with ACoR. It was concluded that the tapping test is not a reliable measure of bat performance across the study population. There are indications that individuals can correctly differentiate bats, but there is clear evidence that they also make errors. A further study with a larger number of participants and an exploration of the relative influence of sensory response will yield further insights to this pilot study.
© 2014 The Authors. Published by Elsevier Ltd.
Selection and peer-review under responsibility of the Centre for Sports Engineering Research, Sheffield Hallam University.
Keywords: cricket; implement; performance; perception.
1.Introduction
Restrictions on materials for use in cricket bats are laid out in the laws of cricket. Law 6.4 stipulates that the blade of the bat must be made from solid wood and law 6.2 sets out the restrictions on the bat’s dimensions (MCC (2010)). These laws protect the tradition of the game, and leave bat manufacturers little option but to continue with
* Corresponding author. Tel.: +44 114 225 2235; fax: +44 114 225 4356.
2 Author name / Procedia Engineering 00 (2013) 000–000
the use of willow - a resilient lightweight wood - as the core performance material. The use of wood introduces wide performance variations due to the natural differences in the quality of willow within and between trees.
A bat tapping test is used typically by retailers and players to rate the likely performance of a bat before purchase. The bat is impacted with a hardwood mallet, or cricket ball is bounced in the face of the blade. The player makes a mental assessment of the sound, feel, and visual rebound of the mallet/ball. A parameter typically considered as appropriate to measure the performance of a bat is the apparent coefficient of restitution (ACoR). ACOR is defined as the ratio of rebound to inbound ball velocity. It is directly related to how far the ball will travel after impact (Subic et al (2003)) and can represent a measure of the intrinsic power of the bat. It is a simpler measure than ball-bat CoR as the recoil speed of the bat can be neglected. The tapping test is hypothesised to be a method by which rebound performance of a bat can be subjectively assessed, when finding ACoR in a laboratory setting is impractical.
During impact the bat is excited to vibrate at frequencies corresponding to its bending and torsional modes of vibration. The amount of energy transferred from ball-to-bat and then bat back to ball is dependent on the extent to which the different modes of vibration are excited (Brooks et al (2006)), in turn influenced by a combination of factors including ball speed and position of impact on the bat (Bower (2012)). The frequencies and amplitudes of the modes of vibration are directly linked to how the impact sounds and feels to players.
The overall aim of this study is to draw conclusions about the reliability of the tapping test as a method to assess bat performance. Conclusions are reached via comparisons between the physically measurable performance parameter ACoR, and the perceived performance from an impact.
2.Method
[image:3.539.95.447.423.528.2]Two sets of bats were provided by Gunn and Moore Ltd, and each consisted of nine bats with the same blade profile within the set. The profiles used were Max.E and Epic, which differed in blade profile. Each set consisted of a wide range of willow grades. All bats were blank (unadorned with stickers and branding), fitted with the same grip and painted with ‘303’ paint, which is a white paint used in manufacturing to disguise the grain of bats made from an inferior wood grade. This ensured that no preconceptions of the bats’ performance could be made prior to the player tests.
Table 1. Test bats inventory for sets 1 and 2
Set 1 Set 2
Max.E Willow Grade Epic Willow Grade
505 g3 bleached, minor knots, light stain 404 g3 bleached, knots, stains 606 superior g3 bleached 606 superior g3 bleached
707 g2 707 g2
808 (a) superior g2 808 (a) superior g2 808 (b) superior g2 808 (b) superior g2 808 (c) superior g2 808 (c) superior g2
909 g1 909 g1
Original superior g1 Original superior g1 Original LE best g1 Original LE best g1
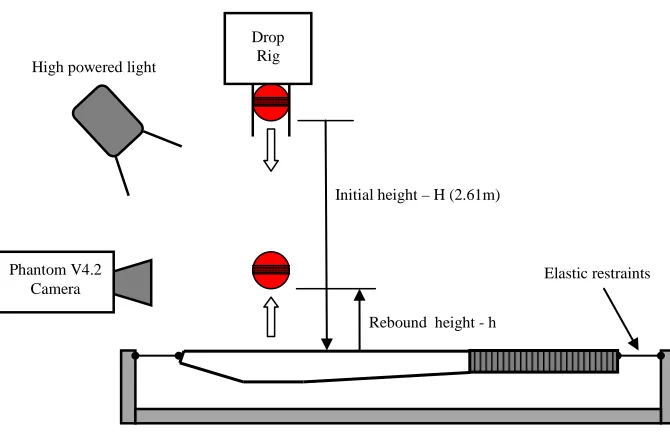
A Phantom (V4.2) high-speed camera operating at 1,000 frames per second was used to record the impact of a cricket ball (m = 160g) dropped in the vertical plane from a height of 2.61 m onto a bat held in the horizontal plane by elastic at three contact points - each side of the bat at the toe and top of the handle - allowing the bat to recoil during the impact. Evidence supports this condition to be closely representative of the hand held conditions of play when compared with rigid clamping (Knowles (1996)). Five repeat impacts were carried out on the centre line of the bat at the Point of Maximum Thickness (PoMT). Any impacts in which the seam of the ball made contact with the bat were discounted and repeated.
Impacts were at low speed (7.15 ms-1) rather than game speeds (25-38 ms-1), but the essential physics of the
Fig 1. ACoR measurement schematic
Analysis of high-speed video recorded during the drop test was carried out using custom Sheffield Hallam
University software (Check2D). The measurable performance indicator was found using ACoR = √(H/h), where H
is the initial drop height, and h is the maximum height post impact. A height rather than velocity measure could be used since we had a vertical rather than horizontal impact, and the recoil speed of the bat could be neglected for ACoR. The mean ACoR for each bat was calculated from the five valid impacts.
A scaled response questionnaire was devised to assess how players interpret the rebound, sound, and vibration response from the tapping test. Twenty amateur cricketers participated in the study. All had greater than nine years playing experience, and sixteen were playing to a very high standard (premier league club, minor counties, or county academy). All participants stated that they had used the tapping test to judge the performance of a bat. All participants were over the age of 18 and signed a written consent form prior to testing. Ethical approval had been granted by the Sport and Exercise Research Ethics group.
Seven questions were created that were informed by Roberts et al (2005) on player perception of golf shots. The questions were tested on industry experts within Gunn and Moore for relevance and meaning to ensure they were suitably themed for cricket (Figure 2).
To minimise the problem of participants using different ranges in the scale, particularly early in the test when reference levels are developing, they were given two bats from outside of the test selection, one with a high ACoR and another a low ACoR. They were then asked to carry out the tapping test on these two bats to familiarise with the questions and response ranges. After sensitisation the eight bats were presented in a random order to minimise the effect of developing reference levels. The bats were marked only with a test number to limit preconceptions on quality of the bat before testing. Responses to each of the seven questions were then recorded. To increase the accuracy of the scoring relative to one another the participant was able to see their previous responses and use them to guide scoring on subsequent bats. Bats were tapped with a standard commercially available hardwood bat mallet. For each question the player was permitted a maximum of ten taps. This constraint was considered valid in order to encourage players to make an assessment and clear decision in a common timescale.
Phantom V4.2 Camera
Drop Rig
Initial height – H (2.61m)
Rebound height - h
4 Author name / Procedia Engineering 00 (2013) 000–000
Figure 2. Scaled response questionnaire, used to quantify participants’ perceptions from the “tapping” test.
Responses were normalised to reduce the effect of individual's reference position in response to the same question (Roberts et al (2005)). ACoR and normalised question responses were entered into the Statistics Package for Social Scientists (SPSS, 19.0.1). Data were checked for parametric assumptions and appropriate tests carried out to look for significant correlations between the input data. Pearson's Product-Moment correlation could not be used since intervals in the questionnaire scale could not be considered equal and as such becomes an ordinal scale. Therefore, Spearman's Rho correlation was the most appropriate in this case. The significance level was set at α=0.05 and Bonferroni corrections used to correct for family-wise error (Field (2009)).
3.Results
[image:5.539.144.399.417.512.2]Table 2 shows the measured ACoR at the Point of Maximum Thickness (PoMT) for eight bats used as the basis for the player perception questionnaire.
Table 2. Measured Apparent Coefficient of Restitution (ACoR)
Standardised results to the scaled-response questions and ACoRs for the eight bats tested for each participant were explored. A test of normality on the data used Shapiro-Wilk due to low sample size, and revealed multiple non-normal distributions. Data was therefore considered non-parametric.
Spearman's Rho coefficients between responses to question 1 to 4 and ACoR were found for each participant. Only three participants showed positive correlation with ACoR at the PoMT.
Bat ACoR @ PoMT
Set Model Average Standard Deviaton
Max. E 505 0.388 0.003
Max. E 808 (b) 0.444 0.004 Max. E 808 (c) 0.452 0.003
Max. E LE 0.442 0.014
Epic 404 0.367 0.002
Epic 808 (b) 0.405 0.005 Epic 808 (c) 0.421 0.003
Figure 3. Normalised responses against measured ACoR for (a) Q1 - impact feel, (b) Q2 - vibration feel, (c) Q4 - performance.
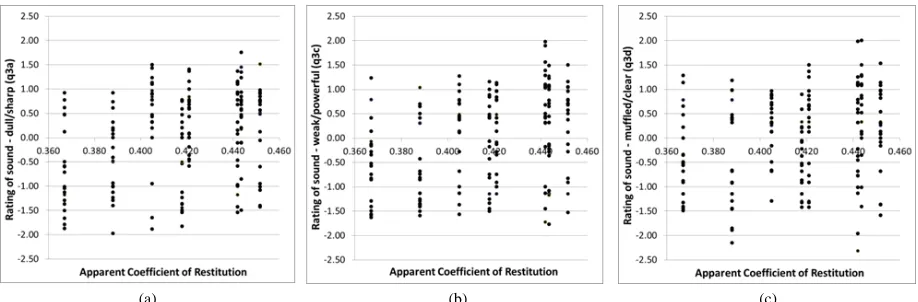
(a) (b) (c) Figure 4. Normalised responses against measured ACoR for (a) Q3a - dull/sharp, (b) Q3c - weak/powerful, (c) Q3d - muffled/clear
Figures 3 and 4 show how the twenty participant’s responses vary for the eight bats tested (seen as eight distinct ACoRs). The spread of data indicates a wide perception of a bat’s characteristics when using a qualitative assessment such as the tapping test. It is not possible to identify visually indications of correlation on bat performance, and so statistical analysis was used to search for correlations.
4.Discussion
Performance predictions from three out of twenty participants showed positive correlations with ACoR at the PoMT, indicating that amateur cricketers are not able to predict bat performance reliably from the tapping test alone. Responses to questions 1-3 give a description of how the player perceived the sound and feel of the impact. It was thought there may be correlations between these responses and the way in which participants judged the overall performance of the bat. Over half the participants’ responses showed positive correlation between the predicted performance (q4) and how pleasant the impact felt (q1); and predicted performance (q4) and how weak/powerful the sound of impact (q3c). This suggests that these sensory perceptions influence how players rate the performance of a bat. Correlations between the other questions and predicted performance varied widely among the participants, with no more than half showing a correlation in the same direction as for responses to q1 and q3a. This indicates that while correlations for q1 and q3a with predicted performance (q4) exist for individuals, none can be generalized to the whole sample.
Standard deviations of normalised responses to q4 for each bat were high, between 0.86 and 1.08. This shows that, whilst some participants were able to accurately predict the relative performance of the bats, the responses of
[image:6.539.42.501.247.398.2]6 Author name / Procedia Engineering 00 (2013) 000–000
the sample population varied widely. The spread of responses to q1, q2, and q3 is also wide, with standard deviations above 0.6. The standard deviations across participants for each bat are comparable to the standard deviation of one participant across all bats, standardized to a value of 1. It suggests that the tested population’s response to the performance of one bat varied as widely as the responses of an individual across the full range of bats. This indicates an inability of the tested group as a whole to agree on performance and key characteristics. The spread of responses for each question and bat suggest that further statistical analysis using average results would be meaningless.
A potential limitation of this study was the way in which the sweet spot was approximated by using the point of maximum bat thickness. However, PoMT distance from the true sweet spot will be consistent for bats of the same profile. For this study we make an assumption that relative comparisons of the ACoRs found at the PoMT within a set of bats with the same profile should be similar to those of ACoRs at the true sweet spot. Accuracy in future studies would be improved by measuring the ACoR of the bat at the true sweet spot, which can be found from modal analysis. Another limitation of this pilot study was the level of experience of the players surveyed. Future studies would include elite level players and experienced bat makers. This would reveal whether a higher experience level can assess potential bat performance from the tapping test with more consistency and accuracy. It is also worth noting that while the results showed little consistency between participants’ responses when using the tapping test as a stand-alone measure, further testing could be carried out on bats where the wood grain is visible. This would allow investigation of the effect of prior knowledge with visual observation of the grain pattern before tapping. It is generally accepted by bat makers that bat performance will be greater with higher grades, and grading is done on a visual inspection of the grain pattern alongside imperfections in the willow.
5.Conclusion
Results of this pilot study suggest that cricketers without a high level of experience should not use the tapping test to rate the potential performance of a bat. However, a further study with a larger sample that also includes elite level players and experienced bat makers is required so that we can investigate whether reliability can be improved with greater experience and skill. An exploration of the relative influence of sensory response will also yield further insights to this pilot study.
References
Bower R. The sweet spot of a cricket bat for low speed impacts. Sports Engineering, 2012;15(2):53-60.
Brooks R, Mather JSB, Knowles S. The influence of impact vibration modes and frequencies on cricket bat performance. Proceedings of the Institution of Mechanical Engineers, Part L: Journal of Materials: Design and Applications, 2006; 220(4):237-248.
Fastl H. The Psychoacoustics of Sound-Quality Evaluation. Acustica united with acta acustica, 1997; 83(5):754–764.
Field A. Comparing several means: ANOVA (GLM 1), Chapter 10, in Discovering Statistics Using SPSS, 3rd ed., London, Sage Publications, 2009
Grant C, Nixon SA. The effect of microstructure on the impact dynamics of a cricket bat, in The Engineering of Sport, Haake S. Taylor & Francis, 1996.
Gunn and Moore. The Gunn and Moore Pick-up index. Available at: http://www.gm-cricket.com/pages/pick-up-index.aspx. Accessed July 26, 2012.
Hariharan V, Srinivasan P. Inertial and Vibration Characteristics of a Cricket bat. Available at: http://vibrationdata.com/cricket_bat.pdf. Accessed 20 January 2012
Knowles S. Dynamic analysis and the use of composite materials in cricket bat design. University of Nottingham. 1996. Marylebone Cricket Club. The Laws of Cricket, 4th ed., London, Marylebone Cricket Club, 2010.
Risset JC, Wessel DL. Exploration of Timbre by Analysis and Synthesis, Chapter 5, in The Psychology of Music. Deutsch D, San Diego, Academic Press, 1999.
Roberts J, Jones R, Mansfield NJ et al. Evaluation of vibrotactile sensations in the ‘feel’ of a golf shot. J Sound Vib, 2005; 285(1-2):303-319. Roberts J, Jones R, Mansfield NJ et al. Evaluation of impact sound on the “feel” of a golf shot. J Sound Vib, 2005; 287(4-5):651-666. Sayers AT, Koumbarakis M, Sobey S. Surface hardness of a cricket bat after “knock-in.” Sports Engineering, 2005; 8(4):233-240.