<http://orcid.org/0000-0002-3672-0849>, REEVE, Kesia <http://orcid.org/0000-0003-2877-887X> and WILSON, Ian <http://orcid.org/0000-0001-8813-3382>
Available from Sheffield Hallam University Research Archive (SHURA) at: http://shura.shu.ac.uk/14641/
This document is the author deposited version. You are advised to consult the publisher's version if you wish to cite from it.
Published version
GREEN, Stephen, PATTISON, Ben, REEVE, Kesia and WILSON, Ian (2016). How affordable is affordable housing? Project Report. Norwich, UK, Flagship Group.
Copyright and re-use policy
See http://shura.shu.ac.uk/information.html
How
affordable is
affordable
housing?
Affordable housing?
Centre for Regional Economic and Social Research
Shefield Hallam University
This report was authored by:
Stephen Green
Ben Pattison
Kesia Reeve
Ian Wilson
June 2016
Contact
Sam Greenacre
Head of Communication
01
Key indings
1. Introducion 1.1. Introducion
1.2. Methodology
2. The afordability of Flagship Group’s housing products 2.1. Measuring afordability
2.2. The scale of afordability of Flagship Group’s housing products 2.3. Comparing afordability against a standard raio measure
3. Which groups are most afected by afordability 3.1. Idenifying groups most afected by afordability 3.2. Afordability in local authority areas
4. How does afordability afect tenants 4.1. Afordability and rent arrears
4.2. Afordability and previous diiculty paying rent
5. How tenants would manage with increased expenses and would they pay more rent
5.1. How would tenants manage if their household expenses were to
increase
5.2. Willingness to pay a higher rent
6. How welfare reforms will impact on afordability 6.1. Afordability and Welfare Reforms
6.2. Pay to Stay
6.3. Voluntary Right to Buy
A relaively small proporion of tenants had unafordable rent (6 per cent). However a further third of tenants (32 per cent) were at risk of unafordable rent. Any negaive change to the inancial circumstances of this group, such as further welfare reforms, could signiicantly increase the proporion of tenants with unafordable rent
Tenants with higher rent and variable and/or low income had the highest likelihood of unafordable rent. 30 per cent of tenants had an income of less than £10,400.
Rent arrears are an important indicator of unafordable rent. More than seven imes as many tenants with unafordable rent were in arrears on their rent account compared to tenants with afordable rent respecively
Past experiences of unafordable rent are a good predictor of problems in the future.
Tenants with unafordable rent were more likely than tenants with afordable rent to have had diiculies paying their rent ‘always’ or ‘most of the ime’ in the past year
Rents are currently set at appropriate levels for almost all tenants. The cost of rent was not
a common reason for diiculies in paying rent. The most common reasons were unexpected expenses, increases in outgoings and decreases in income - for example due to health or job
loss
Cuing back on spending was the most common reacion when tenants run out of money (55 per cent of tenants). Tenants who borrowed (39 per cent), used a credit card/overdrat (31 per cent) or took out a loan (eight per cent) are a concern because they are taking on debt which in turn is likely to afect the afordability of their rent
Working age households who have no adults in full ime work are going to be most afected by forthcoming welfare reforms, such as the LHA cap in social housing and tax credits reforms. In addiion direct payment of Housing Beneit, rolled out as part of Universal Credit, will give more tenants responsibility for paying their rent and expose them to the possibility of unafordable rent
The research has provided a Rent Afordability Assessment Tool to assess rent afordability for tenants and prospecive tenants
The research recommends triaging all tenants entering arrears for the causes of unafordable rent and to put in place necessary support
The research recommends being proacive in prevening problems associated with
unafordable rent, paricularly in anicipaion of forthcoming welfare reforms. This includes:
- Encouraging tenants to build up at least 4 weeks’ worth of credit on their rent accounts -Idenifying and targeing support at tenant groups most likely to be afected by welfare
reforms
- Reviewing leing policies
1.1. Introduction
At the end of 2015 Flagship Group commissioned the Centre for Regional Economic and Social Research (CRESR) at Sheield Hallam University to assess the afordability of its housing products. The research was commissioned as it became clear that a number of external
changes were likely to afect the context in which Flagship operated as well as the afordability of its housing products. These include:
Welfare reform: since their elecion in May 2015, the Conservaive Government have outlined a range of addiional welfare reforms that are likely to afect the incomes of many Housing Associaion tenants. These include the extension of the overall beneit cap, freezes on various working age beneits and the coninued roll out of Universal Credit
Housing policy: the Housing and Planning Act (2016) outlined a number of changes to housing policy including the introducion of ‘pay to stay’ for social renters on higher incomes. The Act also provides funding for the extension of the Right to Buy to Housing Associaion tenants
Governance and role of Housing Associaions: the government is reassessing the governance of Housing Associaions through a review of the Homes and Communiies Agency. These changes provide both opportuniies and challenges for Housing Associaions
as they assess their future roles
The objecives of the research were to:
Understand what rent afordability means and how it impacts on customers Idenify how afordability difers by geography and key tenant characterisics
Understand the impact that imminent welfare and other wider changes will have on afordability
04
1.2. Methodology
In order to invesigate these issues, CRESR undertook a survey of Flagship tenants to assess their inancial posiion and the afordability of their housing costs. The quesionnaire covered key household and property characterisics, rent informaion, income and broader inancial circumstances. The survey was undertaken between February and April 2016, with a paper survey distributed to just under 20,000 Flagship tenants, including social rent, afordable rent, market rent and shared ownership customers. An online version of the survey was also available. In total there were 2,628 valid responses to the survey: 2,570 paper and 58 online.
Analysis conirmed the respondents to the survey were largely representaive of Flagship’s customer base. However, minor adjustment weights were used in the analysis to correct for biases in relaion to property type and the age of respondents. Survey indings within this report refer to weighted igures.
Some of the key characterisics of respondents were:
31 per cent of respondents were aged 65 years or over; 17 per cent were aged under 35
years
31 per cent of respondents were in single person households. Couple households comprised 23 per cent and 15 per cent were in couples with dependent children households. Lone parent and other household types made up 12 per cent and 18 per cent of respondents respecively
Most respondents lived in a house (59 per cent). Bungalow (22 per cent) was the second most common accommodaion type
85 per cent of respondents were in two or three bed properies. Only three per cent of respondents had four or more bedrooms
30 per cent of respondents had a household income of up to £10,400 per year. Only seven per cent had a household income of more than £31,200 per year
48 per cent of respondents received Housing Beneit, including 41 per cent who had it paid
direct to the landlord
18 -24 years 3%
25-34 years 14%
35-44 years 18%
45-54 years 18% 55-64 years
16% 65-74 years
16%
[image:9.595.65.249.109.328.2]75+ years 15%
Figure 1.1: Age of respondents
Couple 24%
[image:9.595.331.521.136.322.2]Couple with dependents 15% Single person 31% Lone parent 12% Other 18%
Figure 1.2: Household composiion of respondents
House 59% Bungalow 21% Flat 18%
Maisonette or other 2%
Figure 1.3: Accommodaion type of respondents
1 bedroom 12% 2 bedrooms 48% 3 bedrooms 37%
[image:9.595.328.531.350.579.2]4 or more bedrooms 3%
Figure 1.4: Accommodaion size of respondents
Up to £10,400
30%
£10,400 to £15,600
27%
£15,600 to £20,800
19%
£20,800 to £26,000
11%
£26,000 to £31,200
6% £31,200 or more
7%
Figure 1.5: Household income of respondents
Yes, paid to landlord 41% Yes, paid to tenant 7% No 52%
2. The
Affordability
of Flagship
1 Bibby, J. (2015) What is afordable housing, htp://blog.shelter.org.uk/2015/08/what-is-afordable-housing/ .
2.1. Measuring Affordability
This report evaluates rent afordability - the ability of a household to pay their rent. This is commonly measured using metrics such as:
The maximum acceptable housing costs to income raios, for example, Shelter argue households should not be paying more than 35 per cent of their net household income on
housing costs1
The minimum residual income (ater housing costs) required to meet non-housing needs, for example the Joseph Rowntree Foundaion suggest a single person working age household needs £10,192 per annum ater rent
We argue these are oten arbitrary measures that are insensiive to personal circumstances. This research takes a broader view of rent afordability that is recepive to individual tenant circumstances. It combines the following three elements:
A tenant’s percepion of the afordability of their rent A tenant’s assessment of their overall inancial posiion
Whether a tenant had responsibility for their rent, i.e. they were on full Housing Beneit paid
direct to their landlord
This chapter sets out a new measure of afordability that combines the following three elements: a tenant’s percepion of the afordability of their rent; a tenant’s assessment of their overall inancial posiion; whether a tenant had responsibility for their rent. This allows for a nuanced assessment of afordability that is
recepive to individual tenant circumstances.
Only six per cent of Flagship Group tenants were assessed as having unafordable rent.
08
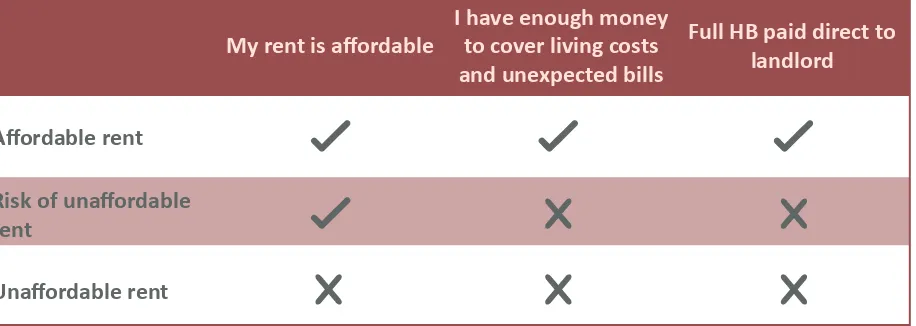
[image:12.595.41.514.183.346.2]Table 2.1: A summary of the afordability classiicaion Table 2.1 summarises our classiicaion of afordability.2
2 There is another group not shown - unafordable rent but enough money: tenants who disagree their rent is afordable however state they
have enough money to cover living costs and any unexpected bills. It is unclear why these tenants have responded in this way or where they are on a spectrum of afordability. Given this and their relaively small size the group do not provide a focal point of our analysis.
The groups are:
Afordable rent: tenants who think their rent is afordable and have enough money to cover living costs and any unexpected bills or are on full Housing Beneit paid direct to their
land-lord
Risk of unafordable rent: tenants who think their rent is afordable however do not have enough money to cover living costs and any unexpected bills
Unafordable rent: tenants who disagree their rent is afordable and state they do not have enough money to cover living costs and any unexpected bills
2.2. The scale of affordability of
Flagship’s housing products
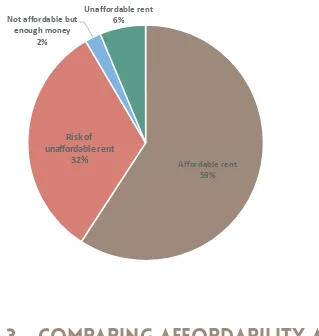
Figure 2.1 shows:
59 per cent of tenants had afordable rent based on the deiniion provided in Table 2.1.
However, 15 per cent of this group will be at risk of unafordable rent when direct payment of Housing Beneit is rolled out as part of Universal Credit
Only six per cent of tenants were assessed as having unafordable rent
A further third of tenants (32 per cent) were at risk of unafordable rent. Any negaive
change to the inancial circumstances of this group, such as further welfare reforms, could signiicantly increase the proporion of tenants with unafordable rent
My rent is afordable I have enough money to cover living costs and unexpected bills
Full HB paid direct to landlord
Afordable rent
Risk of unafordable rent
Affordable rent
59%
Risk of unaffordable rent
33%
Not affordable but enough money
2%
Unaffordable rent
[image:13.595.52.371.148.484.2]6%
Figure 2.1: The afordability of Flagship’s housing products
2.3. Comparing affordability against a
standard ratio measure
A ith (20 per cent) of tenants had a rent contribuion of more than 35 per cent of their total household income. On a standard raio measure of afordability such tenants are deemed to have unafordable rent. This is 14 percentage points higher than the proporion of tenants assessed as having unafordable rent by our measure shown in Figure 2.1 which is based on tenants’ percepion of both rent afordability and their inancial situaion.
There are also notable diferences as to how the same tenants were classiied. For example, 67 per cent of tenants assessed as having unafordable rent (based on percepions) had a rent contribuion less than 35 per cent of their household income.
This suggests arbitrary income raio based measures are too insensiive to personal
circumstances; especially for low income groups in social rented accommodaion who are likely to require diferent levels of income ater housing costs compared to the other groups. In paricular, afordability for people purchasing with a mortgage is diferent to those who are on low incomes (and are oten supported by Housing Beneit).
Risk of unafordable rent
3. Which groups
are most
affected by
3.1. Identifying groups most affected by
affordability
[image:15.595.40.525.121.413.2]Staisical modelling has been used to idenify factors which were signiicantly associated with a tenant having unafordable rent. The technique enables us to quanify the efect of a given characterisic while holding all other characterisics in the model constant. This helps us understand whether a paricular characterisic, such as being on Housing Beneit, was an important predictor of having unafordable rent ater taking into account other tenant characterisics such as age, rent level and income.
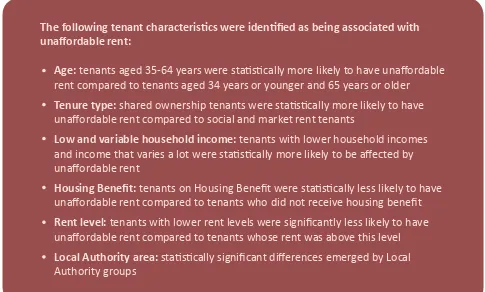
Figure 3.1 presents characterisics that were ideniied as being staisically signiicant ‘predictors’ of a given tenant having an unafordable rent. The wider the arrow the more important the characterisic was at predicing this outcome.
The following tenant characterisics were ideniied as being associated with unafordable rent:
Age: tenants aged 35-64 years were staisically more likely to have unafordable rent compared to tenants aged 34 years or younger and 65 years or older
Tenure type: shared ownership tenants were staisically more likely to have unafordable rent compared to social and market rent tenants
Low and variable household income: tenants with lower household incomes and income that varies a lot were staisically more likely to be afected by unafordable rent
Housing Beneit: tenants on Housing Beneit were staisically less likely to have unafordable rent compared to tenants who did not receive housing beneit
Rent level: tenants with lower rent levels were signiicantly less likely to have unafordable rent compared to tenants whose rent was above this level
12
Figure 3.1: Characterisics associated with unafordable rent
Unafordable rent
Age
Tenure type
Income varies a lot Local Authority
Rent level
Household income
Housing Beneit
The following factors emerged:
Age: tenants aged 35-64 years were staisically more likely to have unafordable rent compared to tenants aged 34 years or younger and 65 years or older
Tenure type: shared ownership tenants were staisically more likely to have unafordable rent compared to social and market rent tenants - 16 per cent of tenants in shared
ownership had unafordable rent compared to 9 per cent of tenants in market rent and ive per cent in social/afordable/intermediate rent properies. However, equivalent proporions within each of the three groups had afordable rent; this was due to a lower proporion of shared ownership tenants being at risk of unafordable rent 3
Household income varies a lot: tenants whose household income varies a lot were staisically more likely to have unafordable rent compared to tenants with a more stable
income
Housing Beneit: tenants on Housing Beneit were staisically less likely to have unafordable rent compared to tenants who did not receive Housing Beneit
Household income: tenants with low household incomes (less than £10,400) were staisically more likely to have unafordable rent compared to tenants with a higher
household income
Rent level: tenants whose weekly rent was below £80 were signiicantly less likely to have unafordable rent compared to tenants whose rent was above this level
Local Authority area: staisically signiicant diferences emerged by local authority groups. Please see secion 3.2 for more informaion
3.2. Affordability in Local Authority
Areas
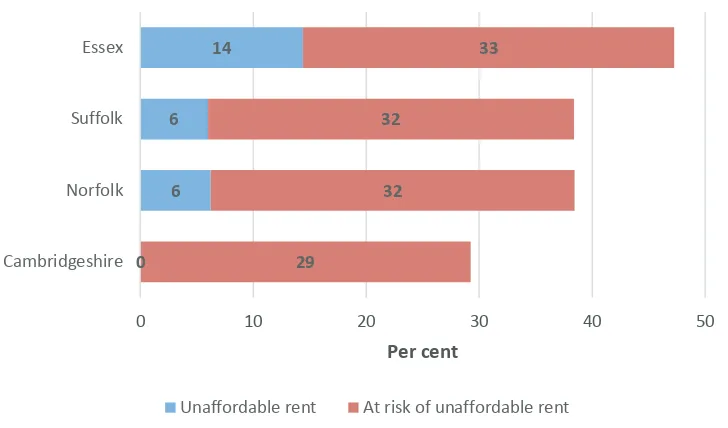
Figure 3.2 shows the percentage of tenants who currently have unafordable rent or were at risk of unafordable rent by upper ier authority. Essex (14 per cent) had the highest
proporions of tenants with unafordable rent. This was over double the proporion in Norfolk (six per cent) and Sufolk (six per cent), which had the next highest percentages of tenants with unafordable rent.
No respondents in Cambridgeshire had unafordable rent; though cauion is required as there were only 39 respondents from this area. Cambridgeshire also had the lowest level of tenants with unafordable rent or at risk of unafordable rent (29 per cent). Their rate was nine
percentage points lower than the rate across all tenants.
0 6 6
14
29
32 32
33
0 10 20 30 40 50
Cambridgeshire Norfolk Suffolk
Essex
Per cent
[image:17.595.44.408.361.575.2]Unaffordable rent At risk of unaffordable rent
Figure 3.2: Percentage of tenants with unafordable rent by upper ier local authority
Table 3.1 provides the percentage of tenants with unafordable rent and at risk of unafordable rent in the ive lower ier authoriies with more than 100 survey responses.
Unafordable rent At risk of unafordable rent Total
Forest Heath 8 32 40
Waveney 7 30 37
Sufolk Coastal 5 33 38
Ipswich 5 26 31
[image:17.595.45.502.659.771.2]Breckland 4 32 36
This secion explores how afordability afects tenants. The key indings are: Tenants with unafordable rent were more likely than tenants with afordable rent to be in arrears on their rent account
Tenants with unafordable rent were more likely than tenants with afordable rent to have had diiculies paying their rent in the past year
Rent costs were not a common reason for diiculies in paying rent The most common reasons for diiculies in paying rent were unexpected expenses, increases in outgoings and decreases in income due to health or job loss
When tenants run out of money the most common reacion was to cut back on spending. A large proporion of tenants borrowed from family or friends, used a credit card/overdrat or took out a loan
4.1. Affordability and rent arrears
Rent arrears are an important indicator of unafordable rent. A staisically higher proporion of tenants with unafordable rent reported being in arrears on their rent account compared to tenants with afordable rent: 20 per cent and three per cent respecively (Figure 4.1). Overall, seven per cent of survey respondents reported that they were in arrears on their rent account.
[image:19.595.39.520.121.356.2]The average value of reported arrears was over £100 higher for tenants with unafordable rents compared to tenants with afordable rent. The esimated rent arrears rates were 1.5 per cent and 0.2 per cent respecively.
Figure 4.1: Percentage of afordability groups in arrears
3%
Afordable
20%
Unafordable
13%
16
4.2. Affordability and previous difficulty
paying rent
Tenants with unafordable rent were staisically more likely than tenants with afordable rent to have had diiculies paying their rent in the past year: 19 per cent and two per cent respecively (Figure 4.2).
Conversely 89 per cent of tenants with afordable rent ‘hardly ever’ or ‘never’ struggled to pay their rent. This was more than double the proporion of tenants with unafordable rent, which was 43 per cent.
This suggests past experiences of unafordable rent are a good predictor of problems in the future. It is important to understand the commonaliies and relaionship between diferent episodes of unafordable rent so that appropriate support can be put in place to break the
[image:20.595.61.462.407.540.2]cycle.
Figure 4.2: Percentage who struggled to pay their rent always or most of the ime in the past year by afordability groups
2%
Afordable
19%
Unafordable
9%
Risk of unafordable
The next two subsecions explore why tenants had diiculty paying rent and how tenants make
Reasons for diiculty paying rent
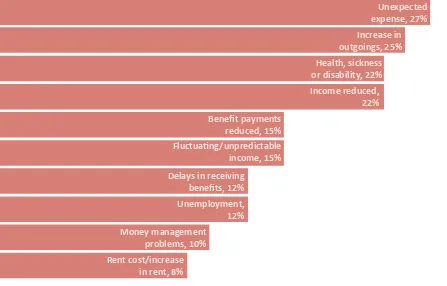
Tenants struggle to pay their rent for a wide range of reasons, many of which are unpredictable and/or short lived. Figure 4.3 highlights the most common reasons were unexpected
expenses, increases in outgoings and decreases in income - for example due to health or job loss.
27 per cent of tenants who had any diiculty paying their rent reported this was due to unexpected expenses
25 per cent of tenants who had any diiculty paying their rent reported this was due to an
increase in outgoings
25 per cent of tenants who had any diiculty paying their rent reported this was due to health, sickness or disability
22 per cent of tenants who had any diiculty paying their rent reported this was due to an income reducion
Only eight per cent of tenants who had diiculty cited the amount of rent as a contribuing
factor. This suggests rents are currently set at appropriate levels for almost all tenants.
Unexpected expense, 27% Increase in outgoings, 25% Health, sickness or disability, 22% Income reduced,
22%
Beneit payments reduced, 15% Fluctuaing/unpredictable
income, 15% Delays in receiving
beneits, 12% Unemployment,
12%
Money management problems, 10% Rent cost/increase
[image:21.595.43.490.450.736.2]in rent, 8%
18
How tenants manage when they run out of money
Figure 4.4 suggests cuing back on spending was the most common reacion when tenants run out of money (55 per cent of tenants). Only 11 per cent of tenants stated they were able to use saving and investments.
Tenants who borrowed (39 per cent), used a credit card/overdrat (31 per cent) or took out a loan (eight per cent) are a concern. They are taking on addiional debt which, in turn, is likely to afect the future afordability of their rent. This may be one of the reasons why some tenants end up in a cycle of diiculies paying their rent.
On a posiive note only four per cent of tenants reported using money meant for the rent when they run out of money. This is less than the 11 per cent who reported using money meant for other bills or commitments, suggesing paying rent is seen a priority over these alternaive bills or commitments.
Cut back on spending, 55% Borrowed money from
family/friends, 39% Used credit card or
overdrat, 31% Family/friends gave
money to help out, 15% Used money meant for bills/commitments, 11% Drew money from savings or investments, 11%
Took out a loan, 8% Got a job/second job/ worked more hours, 7% Used money meant
[image:22.595.51.485.378.752.2]for the rent, 4%
would manage
with increased
expenses and
20
[image:24.595.56.520.118.248.2]5.1. How tenants would manage if their
household expenses were to increase
Figure 5.1 summarises how respondents would make ends meet if their household expenses were to increase by £10 per week. The most common responses were to cut back on spending (65 per cent) and use exising income (28 per cent). However only 13 per cent of tenants reported being able to manage the increase using their exising income alone.4
Only four per cent stated that they would use money meant for rent. This reinforces the importance tenants place on paying their rent to maintain secure accommodaion.
Comparing how tenants with afordable or unafordable rent would make ends meet following this increase in household expenses reveals a notable trend:
Tenants with afordable rent were staisically signiicantly more likely to use exising income or cut back on spending to meet the increase
Tenants with unafordable rent were staisically signiicantly more likely to: run up arrears on their rent account and/or other bills/commitments; use their credit card/overdrat; borrow from family/friends; and get job/second job/work more hours
This suggests tenants with afordable income have more headroom to meet an increase
in expenses (through their exising income or cuing back) compared to tenants with
unafordable income who would increase their debts.
4 Tenants who selected ‘use exising income’ and none of the other muliple choice opions provided.
This chapter inds:
Only 13 per cent of tenants would be able to manage a £10 per week increase in their household expenses using their exising income alone
Figure 5.1: How would tenants manage if their household expenses were to increase by £10 per week
Cut back on spending, 65% Use exising
income, 28% Use money for bills/
commitments, 14% Borrow money from
family/friends, 11% Got a job/second job/ worked more hours, 11% Use credit card or
overdrat, 10%
Use savings, 9%
Use money meant for the rent, 6%
13% could manage using exising income only
5.2. Willingness to pay a higher rent
In total, 48 per cent of tenants would be prepared to pay a higher rent. However, in return most tenants would want a bigger and/or beter home, oten involving a move (Figure 5.2). Evidence from the survey suggests most tenants did not want to move home.
22
Willingness to pay a higher rent by afordability groups
Fity per cent of tenants with afordable rent were prepared to pay a higher rent compared to 42 per cent of tenants with unafordable rent. Exploring this in more detail reveals:
A staisically higher proporion of tenants with afordable rent wanted: a bigger home, more bedrooms and a more modern home
A staisically higher proporion of tenants with unafordable rent wanted to be nearer to job opportuniies
Willingness to pay a higher rent by local authority grouping
Sufolk Coastal (41 per cent) and Breckland (42 per cent) had the lowest proporions of tenants who would be willing to pay a higher rent. The highest levels were in: Cambridgeshire (66 per cent), South Norfolk (62 per cent) and Ipswich (58 per cent).
Figure 5.2: Reasons given for paying a higher rent
A bigger home, 41% A home with more
bedrooms, 36% A more energy eicient home, 32% Beter repairs and maintenance, 29% A diferent type of
home, 25% A beter area, 24%
A more modern home, 22% A home near to
family/friends, 17% A home near to shops/
services/faciliies, 13% A home near to job
opportuniies, 11% A smaller
reforms will
impact on
24
6.1. Affordability and Welfare Reforms
A summary of the main forthcoming welfare reforms can be found in table 6.1.5
The impact of the reforms will be uneven by household type and their combined impact is likely to have a considerable efect on the incomes of many social housing tenants. Table 6.2 provides a traic light risk raing indicaing the degree to which afordability for given tenant groups will be afected (see Table 6.2 for the sub-groups of tenants considered). The following two sub-groups of tenants are most likely to be afected:
Working age households who have no adults in full ime work and no children. This sub-group comprised 18 per cent of tenants and are likely to be afected by up to ive of the listed welfare changes. The welfare changes are likely to dramaically increase the numbers of tenants with unafordable rent within this sub-group of tenants. This sub-group already has the highest proporion of tenants with unafordable rent (nine per cent) and the second highest proporion at risk of unafordable rent (35 per cent)
Working age households who have no adults in full ime work and have dependent children. This sub-group comprised 12 per cent of tenants and are likely to be afected by up to ive of the listed welfare changes. The scale of welfare cuts is likely to increase the number of tenants with unafordable rent within this sub-group of tenants. The sub-group has the third highest proporion of tenants at risk of unafordable rent (34 per cent)
Households with higher incomes and households with a reired member not claiming
pension credit were ideniied as posing a limited ‘green light’ risk as a result of the
impending welfare changes.
5 See the following CRESR publicaion for more details: Beaty, C. & Fothergill, S. (2016) The uneven impact of welfare reform, htp://www4.
shu.ac.uk/research/cresr/sites/shu.ac.uk/iles/welfare-reform-2016_1.pdf
Forthcoming welfare reforms will afect afordability for a signiicant number of tenants. This chapter outlines key pending reforms and how they will afect sub-groups of tenants.
The impact of the reforms will be uneven by diferent household types. Working age households with no adults in full ime work - either with or without
dependent children - will be most afected. These households account for around 30 per cent of tenants and currently have high proporions of tenants with
Table 6.1: Key future welfare reforms
Name Key features and iming Who will it afect?
Universal Credit Taper and Thresholds
Increase in the rate at which UC awards are
withdrawn from 41 per cent to 48 percent, from April 2016
All families in work who are in receipt of CTC or WTC
Tax credits
(various) - Limiing of child element to two children for new births in tax credits and new UC claims, from April
2017
- Removal of family element in tax credits and UC, and the family premium in Housing Beneit, for new claims, from April 2017
- Reducion in income rise disregard in tax credits, from April 2016
- Uprated minimum income loor in UC for self-employed from 2016-17
- Revised UC delivery schedule
Families claiming tax credits
Pay to Stay This proposal is part of the Housing and Planning Act. Current plans are for Social housing tenants in London with a household income of £40,000 a year or more, and £30,000 a year or more in the rest of England, to pay market rents from April 2017
Discreionary for housing associaions
LHA cap in social
housing Housing Beneit in the social sector limited to the equivalent private sector rate. Tenancies signed ater 1 April 2016, with the enitlement changing from 1 April 2018
Applies to new/renewed social tenants - impact will vary geographically
Housing Beneit for 18 to 21 year olds
End of automaic Housing Beneit enitlement for
out-of-work 18-21 year olds, from April 2017 18 to 21 year olds who are out of work
Employment and Support Allowance
ESA in Work-Related Acivity Group reduced to JSA rate for new claims. Relates to out of work working age claimants with health problems or disabiliies
New claimants
Extension of
Beneit cap Ceiling on total payments to out-of-work households applying to sum of wide range of working age beneits. New, lower ceiling set at £23,000 a year in London and £20,000 elsewhere, from 2016-17
Out-of-work, working age
households
Beneit freeze Freeze in value of most working-age beneits for four years from 2016-17 including Job Seeker’s Allowance, Employment and Support Allowance, some types of Housing Beneit, and Child Beneit. Disability beneits are excluded
26
Table 6.2: The impact of welfare reforms on household type
6.2. Pay to stay
Pay to Stay is the main welfare change that will afect households with higher incomes. The survey esimates ive per cent of respondents are likely to be afected by Pay to Stay: they had
a household income greater than £31,200 and were not in a shared ownership or market rent property. Only three per cent of tenants likely to be afected by Pay to Stay were assessed as having unafordable rent compared to just under 70 per cent who had afordable rent. There is a suggesion that tenants likely to be afected by Pay to Stay would be prepared to pay a higher rent: 66 per cent stated that they would be prepared to pay a higher rent for one or more of the opions listed. This is higher than social/afordable tenants not likely to be afected (49 per cent). However it is important to note paying higher rent is based on receiving a beter ofer in return. This includes a bigger home, a more energy eicient home, a more modern home, a beter area and beter repairs. In most cases a move would be required.
6.3. Voluntary right to buy
This secion considers the likely interest in the Voluntary Right to Buy (VRtB). The extension of the Right to Buy to housing associaion properies is a major change in housing policy that could have important ramiicaions for housing access and supply.
Results from this survey suggest that 14 per cent of Flagship tenants might be able to aford a mortgage to uilise the VRtB. This is slightly higher than the esimated igure across England as a whole (13 per cent). However, not all tenants who can aford the VRtB are interested in doing so. Therefore likely take up of Right to Buy has been esimated from the survey by considering only tenants who can aford it and who stated that they would want to take it up. This analysis
suggests only three per cent of Flagship tenants are likely to take up the Right to Buy.
Key: HB=changes to Housing Beneit for LHA tenants, CTC=Child Tax Credit, CB=Child Beneit, IS=Income Support, ESA=Employment Support Allowance, WTC=Working Tax Credit.
Descripion reform changesKey welfare
Proporion of Flagship
tenants Traic light
Households (HH) with higher incomes
Pay to stay 5 Green
HH who have no adults in FT work and have
dependent children HB, CTC, CB, IS, ESA 12 Red
HH who have at least 1 adult in FT work and
have dependent children CTC, CB, WTC 16 Amber
HH who have no adults in FT work, no
children and not reired HB, CTC, CB, IS, ESA 18 Red
HH who have at least 1 adult in FT work and
no children 22 Amber
HH have at least 1 adult who is reired and
no children and claiming pension credit 12 Amber
HH have at least 1 adult who is reired and
28
Score if yes
Aged 35 to 64 years 1
Household income varies a lot 1
Household income less than £10,000 1
Household income more than £30,000 -1 Rent more than £80 per week 1
Arrears in the past 2 years 1
Problems with health, sickness or disability 1
Savings of less than £500 1
Workless household 1
Claiming pension credit 1
Claiming child tax credit 1
Claiming working tax credit 1
Responsibility for all rent 1
Total Afordability Assessment score
Recommendaion 1: To use the following Rent Afordability Assessment Tool6 to assess afordability for tenants and prospecive tenants.
Afordability assessment score
Aged 35 to 64 years -1 to 4
Household income varies a lot 5 to 6
Household income less than £10,000 7 to 12
6 This assessment tool scores households based on key risk factors that were associated with the afordability measure and household types
that are most likely to be afected by forthcoming welfare changes.
Recommendaion 2: To triage all tenants entering arrears for the causes of unafordable rent and put in place necessary support packages.
Triage to include:
- Afordability assessment
-Discussion of key reasons for diiculies, focusing on: rent level, income, household
expenses, health, inancial capability and household change
Support packages to include:
-Income maximisaion
Recommendaion 3: To acively promote to tenants that they maintain at least 4 weeks’ worth of credit on their rent accounts so they have a bufer to beter cope with spells of unafordable rent.
Recommendaion 4: To idenify and target acion at tenant groups most likely to be afected by welfare reforms.
Workless households, both with and without dependent children, should be seen as a priority
Acions to include:
- Encouraging tenants to build up at least 4 weeks’ worth of credit on their rent accounts - Ensuring tenants are in appropriate accommodaion with afordable rents
- Income maximisaion
-Signposing to employment programmes
Recommendaion 5: Review leings policies in anicipaion of welfare reforms.
Workless households will have a greater risk of unafordable rent
Leings should include a suicient proporion of households with higher incomes and reired households that do not claim pension credit
Recommendaion 6: Flagship Group to ensure it is ready for Right to Buy
Strategic assessment of which types of property to exempt
Flagship Group
Keswick Hall, Keswick, Norwich
NR4 6TJ