Proceedings of NAACL-HLT 2018, pages 129–136
Benchmarks and models for entity-oriented polarity detection
Lidia Pivovarova, Arto Klami, Roman Yangarber University of Helsinki, Finland
Abstract
We address the problem of determining entity-oriented polarity in business news. This can be viewed as classifying the polarity of the senti-ment expressed toward a given senti-mention of a company in a news article. We present a com-plete, end-to-end approach to the problem. We introduce a newdatasetof over 17,000 manu-ally labeled documents, which is substantimanu-ally larger than any currently available resources. We propose a benchmark solution based on convolutional neural networks for classifying entity-oriented polarity. Although our dataset is much larger than those currently available, it is small on the scale of datasets commonly used for training robust neural network mod-els. To compensate for this, we use trans-fer learning—pre-train the model on a much larger dataset, annotated for a related but dif-ferent classification task, in order to learn a good representation for business text, and then fine-tune it on the smaller polarity dataset. 1 Introduction
We report on research done in the context of PULS—a project for monitoring business news media (Du et al., 2016;Huttunen et al., 2013).1 The system gathers 8,000–10,000 documents daily; each document is processed by a cascade of clas-sifiers, including a named entity (NE) recognizer. A key NE in business news type is company or
organization, which can be mentioned in a
posi-tive or negaposi-tive context. For example, launching a new product or signing a new contract is viewed as a positive event; involvement in a product recall, bankruptcy or fraud is considered negative.
We focus on determining thepolarityof a men-tion of a given company in news media. Polarity classification is important, since if a company ap-pears in negative contexts frequently, it may affect
1http://newsweb.cs.helsinki.fior
http://puls.cs.helsinki.fi
its reputation, impact its stock price, etc. Polar-ity prediction, as defined here, is similar to sen-timent analysis (Liu and Zhang,2012): both re-quire the system to classify a span of text as posi-tive or negaposi-tive. However, there are crucial differ-ences. Business news articles typically do not aim to express emotion or subjectivity—positive and negative events are usually described in a neutral tone. Thus, vocabularies ofaffective terms—e.g.,
amazingorterrific—commonly used in sentiment
analysis, are not helpful for business polarity. Anal-ysis should rather focus onaffective events(Ding and Riloff,2016), i.e., stereotypically positive or negative events. Further, business news employs genre-specific word usage; words seen as negative in “generic” contexts, may indicate a positive con-text here, andvice versa.Negative terms in (Hu and Liu,2004), e.g., include“cancer”, which in busi-ness often appears in positive contexts, as when a pharmaceuticals unveil novel treatments.
While most work in sentiment analysis is done at the document level, we aim to classifyentity
men-tionsin text. This requires changes to
document-based classification models. We explore two con-volutional neural network (CNN) architectures, ini-tially proposed fordocument-levelclassification, and adapt them for entity-oriented classification. The modified models have an additional input chan-nel: thefocus—the position(s) in text where a target company is mentioned. Focus helps the model dis-tinguish among different companies mentioned in text and assign them polarity independently.
As far as we aware no suitable datasets exist for training models for entity-oriented polarity classi-fication. We annotated a dataset of over 17,000 business news articles, which we release for public use, to provide a foundation for an eventual stan-dard evaluation. Despite being much larger than any existing datasets for business polarity detec-tion, it is still small compared to what is typically
used when training CNNs for text classification. We attempt to compensate for the small training data by transferring knowledge from a different cor-pus. The second corpus is large, but annotated for a different task: each document has a set ofevent
labels;someof these may be mapped to polarity labels. We explore two strategies for knowledge transfer: i) manually mapping from event labels to polarity labels, and ii) pre-training CNNs for the event classification task, followed by unsupervised transfer of high-level features from event classifica-tion to polarity. We demonstrate that unsupervised transfer improves performance.
2 Related work
Sentiment analysis:Deep learning for sentiment analysis is an active area of research. Some methods learn vector representations for entire phrases (Dos Santos and Gatti,2014;Socher et al., 2011); others learn syntactic tree structures (Tai et al., 2015;Socher et al., 2013). A simpler ap-proach using CNNs (Kim,2014) has demonstrated state-of-the-art performance (Tai et al.,2015).
Interest in applying sentiment mining to the busi-ness domain is spurred by important industry appli-cations, such as analyzing the impact of news on fi-nancial markets (Ahmad et al.,2016;Van de Kauter et al., 2015;Loughran and McDonald,2011). If a company frequently appears in news in nega-tive contexts it may affect its reputation, impact its stock price, etc., (Saggion and Funk, 2009). Al-though news reports usually have a time lag, events reported in news have longer-term impact on in-vestor sentiment and attitudes toward a given com-pany (Boudoukh et al.,2013).
A major difficulty in training entity-oriented polarity models is the lack of publicly available datasets. In the corpus of 5,000 sentences published byTakala et al.(2014), most instances (sentences) contain no company name, and hence cannot be used for predicting polarity for specific entities. A dataset of 679 sentences in Dutch, annotated with entity-oriented business sentiment, was published byVan de Kauter et al.(2015). They demonstrate that a. in financial news, not all sentiment expres-sions within a sentence relate to the target company; b. sentiment is often expressed implicitly.
A shared task on fine-grained sentiment analysis of financial microblogs and news was held recently as part of SemEval (Cortis et al.,2017), and pro-vided a small dataset containing company names.
This dataset contains only 1,000 newsheadlines, of which only 165 instances mention more than one company name, of which only 20 instances contain names with different polarities (positive for one company but negative for another). Thus, using entity-oriented methods on this dataset may not lead to an advantage in performance. Of the ten best-performing systems on the news sentiment task, many used sentence-level classification with no treatment of target company (Rotim et al.,2017; Cabanski et al.,2017;Ghosal et al.,2017;Kumar et al.,2017); others replace the target name with a special token (Mansar et al.,2017;Moore and Rayson,2017;Jiang et al.,2017) or use company name as a feature (Kar et al.,2017), though none of the papers provide any evidence that special treat-ment of the target yields a gain in performance. In our experiments with the SemEval dataset ( Pivo-varova et al.,2017) a model with explicitly speci-fied target worked slightly worse than a baseline.
The dataset that we release with this paper is 20 times larger and containsentiredocuments, where a given entity may be mentioned multiple times, with many different names mentioned in the same document. This corpus is suitable for experiments with entity-oriented polarity, and our experiments explicitly contrast models that take focus as an input against models that do not use the information about the target company’s position.
Transfer learning:a.k.a.inductive transfer, is a technique for applying knowledge accumulated from solving one problem to improve the solution for a different problem. We usefeature transfer, where the goal is to learn transferable representa-tions for data, which are meaningful for multiple tasks (Pan and Yang, 2010;Bengio et al., 2013; Conneau et al.,2017), i.e., very general, low-level representations. On the other hand, one might con-sider two related tasks, and try to gain knowledge from one to help with the other. In such cases, one wishes to transfer representations at a much
higher level(Glorot et al.,2011). An analysis of
3 The Model
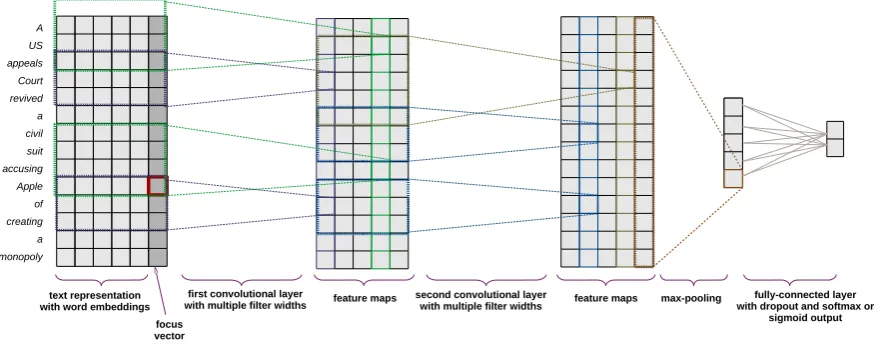
We train a classifier for entity-oriented polarity, which receives on input a text and a “focus” vector— the positions of mentions of the target company in text—and outputs the polarity for this company. For this purpose we extend state-of-the-art models in (Kim,2014). The rationale for introducing focus is that polarity is not a feature of the text as a whole, but of each company mention; two company men-tions in a text may have opposing polarities, and the model needs be able to distinguish them.
The architecture of the model is shown in Fig-ure1. The inputs are fed into the network as sen-tences of a fixed size, zero-padded; each word is a fixed-dimensional embedding vector comple-mented with a scalar indicating the focus. The focus vector is shown in darker grey in Figure1, with the the company mention framed in red. This provides an additional dimension to the word em-bedding, and is crucial for distinguishing between instances that differ only in focus and polarity.
The inputs are fed into a layer of convolutional filters with multiple widths, optionally followed by deeper convolutional layers. The results of the last convolutional layer are max-pooled, produc-ing a vector with one scalar per filter, which is then fed into a fully-connected layer with dropout regularization and a soft-max output layer. The output is a 2-dimensional vector that is a proba-bility distribution over the two possible outcomes: positive and negative. In manual annotation we use five values: “very negative” [1 0], “somewhat negative” [.7 .3], “neutral” [.5 .5], “somewhat posi-tive” [.3 .7] and “very posiposi-tive” [0 1]. The model may output any possible distribution. The loss is cross-entropy between the network’s output and the true distribution; the loss updates the weights via back-propagation.
We represent words by embeddings, trained us-ing the GloVe algorithm (Pennington et al.,2014) on a corpus of 5 million news articles. Each arti-cle was pre-processed using lemmatization and the PULS NE recognition system. All NEs of the same type are mapped to the same special token; i.e., all company names have the same embedding, all person names another, etc. We continue to train the embeddings during polarity training by updating them at each iteration. This allows the model to learn properties of words significant for polarity, such as the difference between antonyms, which may not be captured well by the initial embeddings.
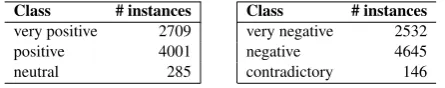
Class # instances Class # instances
very positive 2709 very negative 2532
positive 4001 negative 4645
[image:3.595.307.530.63.107.2]neutral 285 contradictory 146
Table 1: Class distribution in annotated data.
4 Data
The dataset contains 17,354 different documents with 19,689 company names. PULS clusters news into groups, each group containing documents de-scribing the same story.2 Then we manually anno-tate each group with business polarity of the most salient company names.
In our experiments, each training instance is the first five sentences in the document beginning from the first mention of the focus company. This choice was made because typically the beginning of an article carries information about the principal event, whereas later text contains background information which may mention the company, but where the polarity may be different. In case this processing results in identical instances, we remove duplicates, and keep only one copy.
The resulting dataset used in the experiments contains 14,172 distinct instances. The distribution of the data among the polarity classes is shown in Table1. Instances labeled “contradictory” are not used for testing and training at present. The data were split into five folds for cross-validation.
We also have a separate, large collection of news articles (Pivovarova et al.,2013), which is anno-tated for business events—for example, Merger,
Contract,Investment,Product launch,Product
re-call, Fraud, Bankruptcy—291 labels in all. An
article may have multiple event labels. Some of these labels may imply (or strongly correlate with) positive or negative polarity. We attempt to exploit this large data to improve polarity prediction. To this end, we attempt two approaches, with several variations: manual mappingandhigh-level fea-ture transfer.
For manual mapping, we manually selected those labels which we believe most clearly imply a polarity: e.g., Investment, Product launchand
Sponsorshipare considered positive, whileFraud,
LayoffandBankruptcyare negative; in all, we
iden-tified 26 “positive” and 12 “negative” labels. Using
2The grouping algorithm takes into account the semantic
A US appeals Court revived a civil suit accusing Apple of creating a monopoly
text representation with word embeddings
focus vector
first convolutional layer
[image:4.595.78.523.72.244.2]with multiple filter widths feature maps second convolutional layerwith multiple filter widths feature maps max-pooling with dropout and softmax or fully-connected layer sigmoid output
Figure 1: A model architecture with focus vector and two convolution layers
only these 38 event labels, we constructed a train-ing set, removtrain-ing documents with labels that result in no polarity, or conflicting polarities. Further, since it is impossible to know to which company the label refers, only documents whose headlines and the first sentence contain exactly one com-pany mention were kept. (For example, if one company goes bankrupt and another acquires its assets—such documents are not used.)
The resulting dataset is highly skewed with 90% of the data positive. To assure that the positive and negative subsets have similar size, we apply
ran-dom undersampling (Dendamrongvit and Kubat,
2010), i.e., we use a random subset of the positive documents. Of more than two million documents in the original event corpus, 100,000 have a non-ambiguous negative label and mention exactly one company. The resulting dataset consists of 200,000 documents; 10% is used as a development set to decide when to stop training. We use this newly generated 200K documentevent corpusin 2 ways: Tuning:a two-stage learning procedure where the model is first trained using the event corpus, and then is tuned using the smaller polarity corpus. Training on combined data:in this strategy, data from both corpora are mixed together, and used for training in random order.
Inhigh-level feature transfer, we aim to reuse relatively high-level, task-specific features. We ini-tially train a model to predict event types—using
allevent labels andalldocuments, irrespective of how many companies they mention. This requires a change in the models: because event labels are not mutually exclusive, we use a sigmoid function
instead of soft-max in the topmost layer. After the event model is fully trained on the event labels, we strip off the last fully-connected layer of the net-work, replace it with a two-class output layer for polarity, and resume training using the smaller po-larity dataset. We expect that the more task-specific features—ones obtained closer to the output layer— will be useful to determine polarity values, due to the latent relatedness between the two tasks. Thus, we keep almost the entire model, with the exception of the very final layer.
From the large dataset labeled with events, we use 10% as a development set, to determine when to stop training, and to find the best model; another 10% is used as a test set. Results from representa-tive runs are shown in Table2.
The bigger model gives better performance— with a much larger number of filters (1000 vs. 128). It is not possible to use such large models for learn-ing polaritywithouttransfer, because these models are trained on much smaller data and would quickly overfit. Therefore, in subsequent experiments we use two convolutional layers with filter sizes 3,4,5, with 128 filters of each size.3
5 Experiments
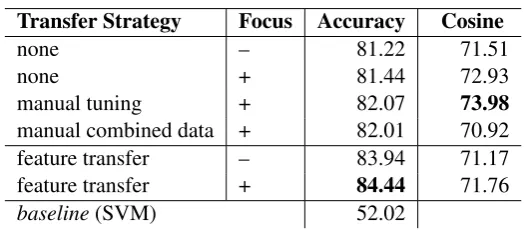
We present experiments with focus and knowledge transfer variants. Table 3 shows the results for each model variant, averaged across five-fold cross-validation. We report accuracy and cosine
similar-3The overall accuracy of the method can likely be
Hyper-Parameters rec prec F1 conv 2; filters 128; sizes {3,4,5} 35.85 75.42 48.53 conv 1; filters 1000; sizes {3,7,11} 50.80 58.13 53.89
Table 2: Event classification results
Transfer Strategy Focus Accuracy Cosine
none – 81.22 71.51
none + 81.44 72.93
manual tuning + 82.07 73.98
manual combined data + 82.01 70.92
feature transfer – 83.94 71.17
feature transfer + 84.44 71.76
baseline(SVM) 52.02
Table 3: Experimental results (multiplied by 100, for readability.)
ity between the model output and the annotation. To compute accuracy as follows. Inannotation
we treat polarity detection as athree-way classifica-tion task; values inside[−0.1,0.1]are considered neutral; values further from0.0are positive or neg-ative. However, for reasons presented below, the models do not do well on identifying neutral in-stances. Thus, in the experiments presented here, we evaluate prediction ofbinarypolarity4: negative vs. positive or neutral. Accuracy measures how of-ten a modelblunders, and predicts negative polarity rather than positive or neutral, or vice versa.
Cosine similarity5is computed by collecting all of the model’s polarity probabilities into one vector and one for the manually assigned polarities, and measuring the cosine between the vectors; also, po-larities are mapped into the interval[−1,1]. This gives a measure of closeness between model pre-diction and the ground truth, including differences between “positive” and “very positive” classes.
As the results show, accuracy and cosine similar-ity do not produce consistent rankings, because they measure different aspects of performance. From a practical, user-oriented point of view, it may be more important that a model avoid gross er-rors, rather than capturing subtle shades of polarity. In manual annotation we noticed that some dis-tinctions (“positive” vs. “very positive”) is far from
4Due to the industry-level requirements: in business news
negative polarity has important implications; “neutral” cover-age may even be viewed mildly positive, as the entity men-tioned is receiving (non-negative) publicity, etc.
5This is the official measure of the SemEval business
po-larity classification task (Cortis et al.,2017); we include it because it may be useful for indirect comparison of results.
clear for human annotators. Thus, we are interested in the models that yield the bestaccuracy.
In addition, we used a SVM classifier as a base-line. The baseline does not use any information about the target company. We use a one-vs-all strategy to obtain three-way classification. For the baseline we report only the accuracy, since this method does not directly produce probabilities.
6 Discussion
Knowledge transfer: Table3 shows that high-level feature transfer outperforms manual mapping. The main reason might be that feature transfer can benefit from a very large corpus of 2 million docu-ments, while only 200,000 documents can be used with the manual mapping approach, which prevents us from training larger models due to over-fitting. The mapped dataset may suffer from other prob-lems, resulting from how it is created. First, it con-tains no articles withneutralpolarity—if an article has no positive or negative label, we cannot as-sume it to be neutral. For example, articles labeled
Corporate appointmentsmay have positive or
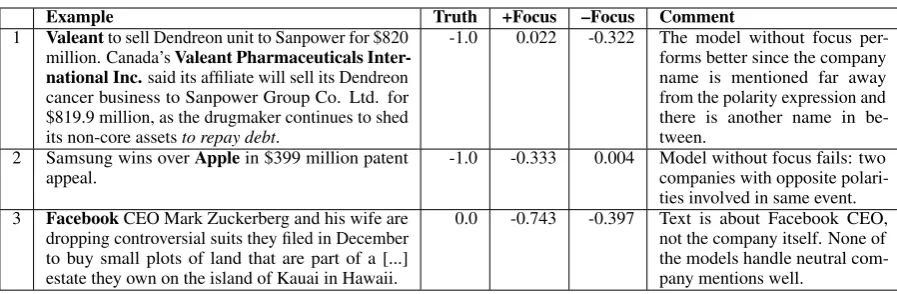
dis-Example Truth +Focus –Focus Comment
1 Valeantto sell Dendreon unit to Sanpower for $820
million. Canada’sValeant Pharmaceuticals
Inter-national Inc.said its affiliate will sell its Dendreon
cancer business to Sanpower Group Co. Ltd. for $819.9 million, as the drugmaker continues to shed its non-core assetsto repay debt.
-1.0 0.022 -0.322 The model without focus per-forms better since the company name is mentioned far away from the polarity expression and there is another name in be-tween.
2 Samsung wins overApplein $399 million patent
appeal. -1.0 -0.333 0.004 Model without focus fails: twocompanies with opposite polari-ties involved in same event.
3 FacebookCEO Mark Zuckerberg and his wife are
dropping controversial suits they filed in December to buy small plots of land that are part of a [...] estate they own on the island of Kauai in Hawaii.
[image:6.595.74.523.59.206.2]0.0 -0.743 -0.397 Text is about Facebook CEO, not the company itself. None of the models handle neutral com-pany mentions well.
Table 4: Model comparison: CNN with/without focus using transfer. Company in focus is in bold
tinguish not positive vs. negative polarity, but one (sub-)set of event labels from another. We cannot assume that the model learns polarity patterns, only that polaritycorrelateswith certain event types.
Focus: The results indicate that focus further improves performance.6 On some test instances, models without focus outperforms models with focus—this happens when polarity expressions lie outside the filter window around the focus com-pany, e.g., as in Example1in Table4.
If two companies within the same text have oppo-site polarities, a model without focus can assign the correct polarity to at most one of them, as in exam-ple2in Table4. Such cases are rare in our dataset; typically, when two companies are involved in the same event, they have the same polarity, e.g., when they strike a deal. Only 6% of instances in our dataset have a paired instance that has identical text but different focus and opposite polarity. Another case when focus is useful is when a document con-tains much background information, which may contain opposite polarity statements. Estimating the number of such cases is an arduous task. Since in some cases a model with focus performs worse than a model without focus, there is no clear gain in that regard. However, the best-performing transfer strategy works slightly better, as seen from Table3. Neutral polarity: Another observation is that all of our models have difficulty in detecting neu-tral polarities, as shown in Example 3 (which is about Facebook’s CEO, rather than the company itself). Neutral examples are rare in our dataset, as shown in Table 1. This is probably the main reason why the models are unable to distinguish neutral polarity. This problem may be helped by annotating more neutral instances.
6Results are statistically significant atp <0.05or lower.
7 Conclusion
We address the problem of entity-oriented business polarity detection. The main contributions are: I. a dataset of 17,000 annotated documents, which is an order of magnitude larger than any previously avail-able resources for this task;7II. we propose bench-mark solutions to this problem, based on CNN ar-chitectures originally intended for document-level polarity classification, modified forentity-oriented
polarity classification by explicitly incorporating
focusinto the model; III. we demonstrate that
per-formance can be improved viatransfer learning, by training a network on a much larger corpus, which is annotated for a different, distantly related task—namely, classification of event types.
We compare manual label mapping with transfer-ring high-level features, and demonstrate that the latter approach performs better, and is less subjec-tive; i.e., features relevant for finding event types work better than a simplistic mapping between the two tasks. The rationale behind this is that busi-ness polarity is latently inherent in the event types themselves: some event types carry a positive or negative polarity, while others do not indicate an unambiguous polarity. Therefore, attempting to map event labels directly to polarity is problematic.
For manual mapping of event labels, we can use only documents with exactly one company and “un-ambiguous” event labels, while for transfer learn-ing we can use the entire event dataset, which lets us use much more data for training bigger models. High-level feature transfer yields 15.8% error reduction—81% to 84% accuracy—as compared to using only the small polarity-annotated corpus.
7The corpus is available atpuls.cs.helsinki.fi/
Acknowledgements
This work was supported in part by Tekes (the Finnish Funding Agency for Technology and In-novation) Project iMEDL: Digital Media
Evo-lution through Deep Learning, Grant number
5933/31/2017.
References
Khurshid Ahmad, JingGuang Han, Elaine Hutson, Colm Kearney, and Sha Liu. 2016. Media-expressed negative tone and firm-level stock returns. Journal of Corporate Finance37:152–172.
Yoshua Bengio, Aaron Courville, and Pascal Vincent. 2013. Representation learning: A review and new perspectives. IEEE transactions on pattern analysis and machine intelligence35(8):1798–1828.
Jacob Boudoukh, Ronen Feldman, Shimon Kogan, and Matthew Richardson. 2013. Which news moves stock prices? A textual analysis. Technical report, National Bureau of Economic Research.
Tobias Cabanski, Julia Romberg, and Stefan Con-rad. 2017. HHU at SemEval-2017 task 5: Fine-grained sentiment analysis on financial data using machine learning methods. In Proceedings of the 11th International Workshop on Semantic Evalua-tion (SemEval-2017). pages 832–836.
Alexis Conneau, Douwe Kiela, Holger Schwenk, Loic Barrault, and Antoine Bordes. 2017. Supervised learning of universal sentence representations from natural language inference data .
Keith Cortis, André Freitas, Tobias Dauert, Manuela Huerlimann, Manel Zarrouk, Siegfried Handschuh, and Brian Davis. 2017. Semeval-2017 task 5: Fine-grained sentiment analysis on financial microblogs and news. InProceedings of the 11th International Workshop on Semantic Evaluation (SemEval-2017). Association for Computational Linguistics, Vancou-ver, Canada, pages 510–526.
Sareewan Dendamrongvit and Miroslav Kubat. 2010. Undersampling approach for imbalanced train-ing sets and induction from multi-label text-categorization domains. InNew Frontiers in Applied Data Mining, Springer, pages 40–52.
Haibo Ding and Ellen Riloff. 2016. Acquiring knowl-edge of affective events from blogs using label prop-agation. InThirtieth AAAI Conference on Artificial Intelligence.
Cícero Nogueira Dos Santos and Maira Gatti. 2014. Deep convolutional neural networks for sentiment analysis of short texts. InCOLING. pages 69–78.
Mian Du, Lidia Pivovarova, and Roman Yangarber. 2016. PULS: natural language processing for busi-ness intelligence. InProceedings of the 2016 Work-shop on Human Language Technology. Go to Print Publisher, pages 1–8.
Llorenç Escoter, Lidia Pivovarova, Mian Du, Anisia Katinskaia, and Roman Yangarber. 2017. Grouping business news stories based on salience of named entities. In15th Conference of the European Chap-ter of the Association for Computational Linguistics Proceedings of Conference, Volume 1: Long Papers. Deepanway Ghosal, Shobhit Bhatnagar, Md Shad Akhtar, Asif Ekbal, and Pushpak Bhattacharyya. 2017. IITP at SemEval-2017 task 5: an ensemble of deep learning and feature based models for fi-nancial sentiment analysis. In Proceedings of the 11th International Workshop on Semantic Evalua-tion (SemEval-2017). pages 899–903.
Xavier Glorot, Antoine Bordes, and Yoshua Bengio. 2011. Domain adaptation for large-scale sentiment classification: A deep learning approach. In Pro-ceedings of the 28th international conference on ma-chine learning (ICML-11). pages 513–520.
Minqing Hu and Bing Liu. 2004. Mining and summa-rizing customer reviews. InProceedings of the tenth ACM SIGKDD international conference on Knowl-edge discovery and data mining.
Silja Huttunen, Arto Vihavainen, Mian Du, and Roman Yangarber. 2013. Predicting relevance of event ex-traction for the end user. In T. Poibeau, H. Saggion, J. Piskorski, and R. Yangarber, editors,Multi-source, Multilingual Information Extraction and Summa-rization, Springer Berlin, Theory and Applications of Natural Language Processing, pages 163–176. Mengxiao Jiang, Man Lan, and Yuanbin Wu. 2017.
ECNU at SemEval-2017 task 5: An ensemble of re-gression algorithms with effective features for fine-grained sentiment analysis in financial domain. In Proceedings of the 11th International Workshop on Semantic Evaluation (SemEval-2017). pages 888– 893.
Sudipta Kar, Suraj Maharjan, and Thamar Solorio. 2017. RiTUAL-UH at SemEval-2017 task 5: Sen-timent analysis on financial data using neural net-works. In Proceedings of the 11th International Workshop on Semantic Evaluation (SemEval-2017). pages 877–882.
Yoon Kim. 2014. Convolutional neural networks for sentence classification. InProceedings of the Con-ference on Empirical Methods in Natural Language Processing (EMNLP).
Bing Liu and Lei Zhang. 2012. A survey of opinion mining and sentiment analysis. InMining text data, Springer, pages 415–463.
Tim Loughran and Bill McDonald. 2011. When is a liability not a liability? textual analysis, dictionaries, and 10-ks. The Journal of Finance66(1):35–65.
Youness Mansar, Lorenzo Gatti, Sira Ferradans, Marco Guerini, and Jacopo Staiano. 2017. Fortia-FBK at SemEval-2017 task 5: Bullish or bearish? inferring sentiment towards brands from financial news head-lines. arXiv preprint arXiv:1704.00939.
Andrew Moore and Paul Rayson. 2017. Lancaster A at SemEval-2017 task 5: Evaluation metrics matter: predicting sentiment from financial news headlines. arXiv preprint arXiv:1705.00571.
Sinno Jialin Pan and Qiang Yang. 2010. A survey on transfer learning. IEEE Transactions on knowledge and data engineering22(10):1345–1359.
Jeffrey Pennington, Richard Socher, and Christopher D. Manning. 2014. GloVe: Global vectors for word rep-resentation. In Empirical Methods in Natural Lan-guage Processing (EMNLP). pages 1532–1543.
Lidia Pivovarova, Llorenç Escoter, Arto Klami, and Ro-man Yangarber. 2017. HCS at SemEval-2017 task 5: Polarity detection in business news using con-volutional neural networks. InProceedings of the 11th International Workshop on Semantic Evalua-tion (SemEval-2017). pages 842–846.
Lidia Pivovarova, Silja Huttunen, and Roman Yangar-ber. 2013. Event representation across genre. In Proceedins of the 1st Workshop on Events:
Defi-nition, Detection, Coreference, and Representation. NAACL HLT.
Leon Rotim, Martin Tutek, and Jan Šnajder. 2017. TakeLab at SemEval-2017 task 5: Linear aggrega-tion of word embeddings for fine-grained sentiment analysis of financial news. In Proceedings of the 11th International Workshop on Semantic Evalua-tion (SemEval-2017). pages 866–871.
Horacio Saggion and Adam Funk. 2009. Extracting opinions and facts for business intelligence. RNTI Journal, E (17)119:146.
Richard Socher, Jeffrey Pennington, Eric H. Huang, Andrew Y. Ng, and Christopher D. Manning. 2011. Semi-supervised recursive autoencoders for pre-dicting sentiment distributions. Association for Computational Linguistics, Stroudsburg, PA, USA, EMNLP ’11.
Richard Socher, Alex Perelygin, Jean Y Wu, Jason Chuang, Christopher D Manning, Andrew Y Ng, and Christopher Potts. 2013. Recursive deep models for semantic compositionality over a sentiment tree-bank. InProceedings of the conference on empirical methods in natural language processing (EMNLP). Citeseer, volume 1631, page 1642.
Kai Sheng Tai, Richard Socher, and Christopher D Manning. 2015. Improved semantic representations from tree-structured long short-term memory net-works. InACL.
Pyry Takala, Pekka Malo, Ankur Sinha, and Oskar Ahlgren. 2014. Gold-standard for topic-specific sen-timent analysis of economic texts. InLREC. pages 2152–2157.
Marjan Van de Kauter, Diane Breesch, and Véronique Hoste. 2015. Fine-grained analysis of explicit and implicit sentiment in financial news articles. Expert Systems with Applications.
Jason Yosinski, Jeff Clune, Yoshua Bengio, and Hod Lipson. 2014. How transferable are features in deep neural networks? InAdvances in neural information processing systems. pages 3320–3328.