Non-Random Error in Genotype Calling Procedures:
implications for family-based and case-control genome-wide
association studies
Richard JL Anney1, Elaine Kenny1, Colm T O'Dushlaine1, Jessica Lasky-Su2, Barbara Franke3,4, Derek W Morris1, Benjamin M Neale5,6,7, Philip Asherson5, Stephen V Faraone7, and Michael Gill1
1 Neuropsychiatric Genetics Research Group, Department of Psychiatry; Trinity College Dublin,
Dublin, D8, Ireland. 2 Channing Laboratories; Brigham and Women's Hospital, Boston,
Massachusetts, MA 02115; United States of America. 3 Department of Psychiatry; Radboud
University Nijmegen Medical Centre, Nijmegen, 6525 GA; The Netherlands. 4 Department of
Human Genetics; Radboud University Nijmegen Medical Centre, Nijmegen, 6525 GA; The
Netherlands. 5Social, Genetic, and Developmental Psychiatry Centre, Institute of Psychiatry,
King's College London; London, SE5 8AF; United Kingdom. 5 The Broad Institute of Harvard and
Massachusetts Institute of Technology; Cambridge, Massachusetts, MA, 02142; United States of
America. 6 Center for Human Genetic Research and Department of Medicine, Massachusetts
General Hospital and Harvard Medical School; Boston, Massachusetts 02114; United States of
America. 7 Department of Psychiatry, SUNY Upstate Medical University; Syracuse, NY 13210;
United States of America.
Abstract
The considerable data-handling requirements for genome wide association studies (GWAS) prohibit individual calling of genotypes and create a reliance on sophisticated “genotype-calling algorithms”. Despite their obvious utility, the current genotyping platforms and calling-algorithms used are not without their limitations. Specifically, some genotypes are not called due to the ambiguity of the data. Any bias in the missing data could create spurious results. Using data from the Genetic Analysis Information Network (GAIN) we observed that missing genotypes are not randomly distributed throughout the homozygous and heterozygous groups. Using simulation, we examined whether the level and type of missingness observed might influence deviation from the null-hypothesis under common control and family-based statistical approaches. Under a case-control model, where missingness is present in a case group but not the case-controls, we observed bias giving rise to genome-wide significant type-I error for missingness as low as 3%. The family-based association simulations show close to nominal type-I error at 4% genotype missingness. These findings have important implications to study design, quality-control procedures and reporting of findings in GWAS.
Introduction
With advances in our understanding of genome variation and genotyping technology, it is now possible to perform high-throughput, cost-effective genome-wide association studies (GWAS) in many thousand individuals. There is extensive evidence emerging supporting
NIH Public Access
Author Manuscript
Am J Med Genet B Neuropsychiatr Genet. Author manuscript; available in PMC 2010 August
13.
Published in final edited form as:
Am J Med Genet B Neuropsychiatr Genet. 2008 December 5; 147B(8): 1379–1386. doi:10.1002/ajmg.b. 30836.
NIH-PA Author Manuscript
NIH-PA Author Manuscript
GWAS as effective in identifying genes related to health and disease (Altshuler and Daly 2007). GWAS have shifted the emphasis from hypothesis-driven candidate gene analyses towards hypothesis independent approaches reliant on biostatistic methods and very large data-sets. The considerable data-handling requirement prohibits manual calling of genotypes creating a reliance on sophisticated “genotype-calling algorithms”. A number of algorithms have been developed to call genotypes from micro-array studies, including RLLM (Rabbee and Speed 2006), BRLMM-P (Affymetrix 2006), CRLMM (Carvalho and others 2007), CHIAMO (Wellcome Trust Case Control Consortium and others 2007) and Birdseed (Affymetrix 2007). However, the GWAS technologies and the genotype-calling algorithms are not without limitations and can lead to some systematic biases that have implications at the data analysis stage. Given the vast number of genotypes being produced, systematic bias, even if very small, may lead to spurious association signals.
We have examined data from the International Multicentre Attention Deficit/Hyperactivity Disorder Genetics Project (IMAGE) – Genetic Association Information Network (GAIN) study. GAIN is a public-private partnership between the Foundation for the National Institutes of Health (FNIH), the US National Institutes of Health (NIH) and partners in the academic and private sectors. Commitments from these partners have supported the initial development of GAIN and the genotyping and data distribution for up to 18,000 samples. The IMAGE-GAIN study is a parent-offspring trios design and contains 2835 participants genotyped on the Perlegen Sciences® 600K Array.
The Perlegen Sciences® Arrays use a hybridisation technology that requires the specific SNPs to bind to their corresponding probe. In an ideal scenario, each fragment of DNA that corresponds to a probe would bind with equal efficiency. Different alleles of a SNP will bind at equal efficiency at their corresponding probes at a single hybridisation temperature. However, DNA sequence and the simple kinetics of the experiment make this scenario universally unlikely.
The calling algorithm used by the IMAGE-GAIN project uses signal intensities from each allele of the SNP and plots each individual on a 2-D plot. The clustering of individuals on these plots is then used to define the genotype clusters and generate the individual genotype call. Under ideal conditions genotypes should cluster at or around a single focal point for each SNP. In reality, numerous factors including imperfect allele differentiation and other non-specific hybridisation issues give rise to extended oblong or cone shaped clusters (see Figure 1). For some SNPs these clusters also overlap. This leads to ambiguity in the call and subsequent assignment of a “Missing” call to the individuals whose genotypes fall into the overlapping regions on the 2-D plot. In many instances these markers will be excluded from analysis as a result of quality-control (QC) procedures. Examples of QC procedures include exclusion on the basis of call-rate, minor-allele frequency and deviation from Hardy-Weinberg Equilibrium (HWE).
The QC procedures work under the assumption that missingness is random with respect to the genotype and the missing calls are distributed equally between the major and minor alleles of the SNP. This may not be true and if so, could lead to bias. As part of a QC procedure for the IMAGE-GAIN data-analysis we performed an observational examination of the 2-D plots of markers that ranked highest in our association analysis. We found from this procedure that missingness is not a random phenomenon. Specifically, we identified different categories of missingness. In order to investigate this observation further we simulated the influence of missingness on the null hypothesis under two common study designs. Firstly, under a case-control design whereby cases and controls are genotyped with different levels of bias, such that in the most extreme scenario one group contains no bias whilst the other contains varying levels of systematic bias. Secondly, we simulated the
NIH-PA Author Manuscript
NIH-PA Author Manuscript
influence of systematic bias within the parent-offspring trio design whereby all samples are exposed to systematic bias.
Subjects and Methods
Software and Data Source
The Genetic Association Information Network (GAIN), is a public-private partnership of the Foundation for the National Institutes of Health, Inc. (FNIH) that currently involves the National Institutes of Health (NIH), Pfizer, Affymetrix, Perlegen Sciences®, Abbott, and the Eli and Edythe Broad Institute (of MIT and Harvard University)
(http://www.fnih.org/GAIN2/home_new.shtml). Genotyping was conducted at Perlegen Sciences® using their genotyping array, which comprises approximately 600,000 tagging SNPs designed to be in high linkage disequilibrium with untyped SNPs for the three HapMap populations. Genotypes were called by Perlegen Sciences® using a proprietary algorithm. Genotype data were cleaned by The National Center for Biotechnology Information (NCBI). Quality Control analyses were processed using the GAIN QA/QC Software Package (version 0.7.4) developed by Gonçalo Abecasis and Shyam
Gopalakrishnan at the University of Michigan. A copy of the software is available by e-mailing gopalakr@umich.edu or goncalo@umich.edu. All 2-D scatterplots were sourced from the QC-passed “clean” dataset from the International Multicentre Attention Deficit/ Hyperactivity Disorder Genetics Project (IMAGE) –Genetic Association Information Network (GAIN) study (The GAIN Collaborative Research Group and others 2007).
Analysis of GAIN data
Scatterplots from the 2818 individual DNA samples genotyped as part of the IMAGE-GAIN sample, were visually assessed. We examined 1000 scatterplots for the markers that ranked highest according to p-value (TOP1000). In addition we examined a further 1000 randomly selected markers (RANDOM1000) from the data. As a result of previous QC procedures, none of the scatterplots selected had missingness at greater than 5% in this sample, and all markers were excluded where Hardy-Weinberg skew was observed at p<=0.001. . Individual scatterplots were classified according to the guidelines described in Figure 1. Classification was assigned only to plots showing more than a threshold of 0.9% missingness. It is important to note that missingness did not exclusively fall into the categories described in Figure 1. Where additional nominal missingness was observed across the scatterplot and not deemed as Class 3, classification was given to where the majority of the missingness was observed.
Differences in the number of missing calls in the TOP1000 and RANDOM1000 group of scatterplots were tested using the two-way Student's T-Test. Differences in the class distribution across groups were calculated by Pearson's Chi Square. Odds Ratios were calculated by measuring the index class against all other classes. All statistical analysis was performed in Stata10 (Stata Inc. TX, USA).
Simulation of Missingness
We assessed the influence of missingness on two simulated datasets of 3000 individuals each. We examined a case-control design, with 1500 cases and 1500 controls. Secondly, we examine a trio design, with 1000 probands and both parents. Under each model we examine the effect of missingness on a marker that is under HWE. There are three major classes of missingness, based on the number of clusters affected by missingness, namely Class 1 has missingness primarily in one cluster, Class 2 in two clusters and Class 3 in three clusters. Specific sub-classification is based on which cluster is influenced; Class 1 influencing homozygous calls-only (C1HM), Class 1 influencing heterozygous calls-only (C1HT), Class
NIH-PA Author Manuscript
NIH-PA Author Manuscript
2 influencing homozygous calls-only (C2HM), Class 2 influencing one homozygous and one heterozygous cluster (C2HT) and Class 3 influencing all calls (C3). Where more than one cluster was affected by missingness, we modelled the effect based on proportional sharing of missingness across the clusters based on genotype counts. We present data generated on six levels of missingness, 10%, 5%, 4%, 3% 2% and 1%, across allele frequencies of 1% to 99%.
Simulation of Missingness: Case-Control Study Design
For the analysis of the case-control sample we examined the potentially common scenario whereby a case sample was genotyped under conditions A and the control sample was sourced from public-domain data genotyped under condition B. Under the assumption that the missingness-bias observed is condition and not SNP dependent, we modelled
missingness in the case-group only. Genotype counts at each minor allele frequency were calculated assuming HWE. The influence of missingness was assessed according to missingness-type and amount.
HWE (Pearson's Chi-square) was examined across the case-group using the genhw program implemented in Stata10 (http://www.stata.com/users/mcleves/). Where cell counts for a genotype were less than or equal to 5, we excluded this analysis from the summary plots. Fisher's exact statistic to examine allelic association under each model was calculated using the gencc program implemented in Stata10 (http://www.stata.com/users/mcleves/).
Simulation of Missingness: Trio Study Design
For the analysis of the trio sample we examined the effect of missingness randomly distributed across the participants in a sample genotyped on a single platform. There are six possible parent-parent mating types for allele p and q; pp-pp, pp-pq, pp-qq, pq-pq and qq-qq. For each allele frequency, assuming HWE proportions, we generated 1000 parent-parent matings. Proband genotype was assigned to each parent-parent mating according to Mendel's Laws. For each missingness-type and amount, we used a random-number seed routine to assign missingness across the relevant missingness classes. We performed 100 replicate datasets for each minor allele frequency at 1% intervals, missingness-type and amount. The Transmission Disequilibrium Test statistics were calculated using PLINK (Purcell and others 2007) and the mean p-values across replicates were calculated using Stata10 (Stata Inc. TX, USA).
Results
Classes of 2-D plots according to missingness
In the IMAGE-GAIN 2-D plots we observe five classes of missingness, Class 0, Class 1, Class 2, Class 3 and Class 4. Class 0 plots show no or minimal (<1%) missingness, these account for approximately 80% of the IMAGE-GAIN RANDOM1000 plots. Class 1 plots show missingness that falls predominantly within one of the genotype clusters. Class 1 plots are further classified according to whether the missingness is predominantly within the heterozygous cluster (C1HT), the homozygous-major allele cluster (C1HMP) or the homozygous-minor allele cluster (C1HMQ). Class 2 plots show missingness that fall within two of the genotype clusters. Class 2 plots are further classified according to whether the missingness is predominantly within the heterozygous cluster and the homozygous-major allele cluster (C2HTP), the heterozygous cluster and the homozygous-minor allele cluster (C2HTQ), or the both homozygous clusters (C2HM). Class 3 plots show missingness equally and randomly across all three clusters. Class 4 plots show additional discrete clusters indicative of allele dosage such as copy number variation. A summary of the classes and
NIH-PA Author Manuscript
NIH-PA Author Manuscript
their distribution in the TOP1000 and RANDOM1000 plots from the IMAGE-GAIN dataset is shown in Table I. Example plots of each class are shown in Figure 1.
Distribution of Missingness Classes in GAIN ADHD Data
Analysis of the TOP1000 and RANDOM1000 2-D plots showed a significant increase in missingness in 2-D plots of the TOP1000 compared to the RANDOM1000 (mean missingness TOP=0.8%; RANDOM=0.6%, Two-way Student's T-Test p=0.0019).
Comparison of the TOP1000 with the RANDOM1000 2-D plots showed significantly fewer Class 0 (Odds Ratio (OR) =0.76, Pearson's Chi-square p=0.0117), significantly more C2HTQ 2-D plots (OR=2.0, Pearson's Chi-square p=0.0195) and significantly more C3 2-D plots (OR=1.6, Pearson's Chi-square p=0.0041) (see Table I).
Simulated Data - Case-Control Design
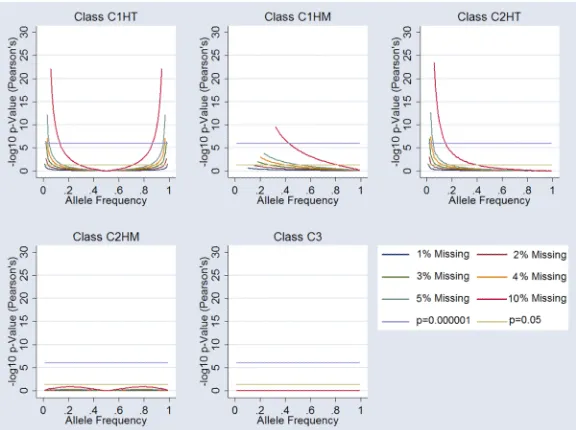
Weinberg Equilibrium in Case-Control Design—Examination of Hardy-Weinberg statistics in the case-only group, equivalent of a genotype association, under the five missingness classes (C1HT, C1HM, C2HT, C2HM, and C3) showed considerable deviation from equilibrium. For the C1HT missingness class the arbitrary genome-wide significance threshold of 10−6 was reached under the null hypothesis for all markers at 10% missingness, and at extreme allele frequencies for 5% and 4% missingness. C1HM showed considerable HWE deviation reaching genome-wide significance at all levels of missingness tested, including 1%. Class C2HT and C2HM show more HWE stability. C2HT simulations did not reach nominal significance for missingness less than 5%. C2HM reached nominal significance (P=0.05) at 4-5% missingness around 50% allele frequencies. Random missingness (C3) did not influence HWE. A summary of the data is presented in Figure 2.
Allelic Association in Case-Control Design—Allelic association analyses under the five missingness classes (C1HT, C1HM, C2HT, C2HM, and C3) showed highly significant deviation from the null hypothesis. Under C1HT missingness we observed strong type-I error at both high and low allele frequencies. At missingness rates of as little as 3% we observed association signals at p=10−6. C1HM missingness also gave rise to type-I error at lower allele frequencies. Moreover, nominal significance observed at missingness rates of 5% at allele frequencies going as high as 59%. C2HT missingness followed similar patterns to the C1HT class, however type-I error is restricted to low allele frequencies only. C2HM and C3 missingness were robust to type-I errors under the models examined. A summary of the data is presented in Figure 3.
Simulated Data- Transmission Disequilibrium Analysis in the Parent-Child Trio Design
Analysis of mean transmission disequilibrium statistics across simulations showed deviation from the null hypothesis. None of the models reach genome-wide significance as a result of the deviation. C1HT missingness showed nominal association signals at 4-5% missingness at extreme allele frequencies. C1HM showed greater influence at lower allele frequencies, reaching nominal significance at 5% missingness for allele frequencies less than
approximately 40% and at 4% missingness for allele frequencies less than approximately 25%. C2HT missingness showed nominal association signal at 5% missingness and approximately 5% allele frequencies. C2HM and C3 missingness showed insignificant deviation from the null hypothesis under these model parameters. A summary of the data is presented in Figure 4. Overall, these data showed a similar pattern to that of the case – control allelic association plots. However, the influence of missingness was not as large.
NIH-PA Author Manuscript
NIH-PA Author Manuscript
Simulated Data – Influence of HWE Quality Control on Cleaning Non-Random Bias
Prior to association analysis, a standard QC procedure is to exclude those samples that deviate from HWE at a given threshold. This procedure may be sufficient to exclude some of the non-random bias. We examined this under the two models, missingness affecting 1500 cases but not 1500 controls and missingness affecting 3000 individuals that make up the 1000 parent-parent-child trios. Deviation from Hardy-Weinberg Equilibrium was calculated for each level of missingness under each class of missingness using the
immediate variant of the genhw procedure in Stata10 (http://www.stata.com/users/mcleves/). A summary of these findings are presented in Figures 5 and Figure 6. For the parent-parent-child trio simulation, missingness as low as 1% in the C1HM class would result in exclusion if the frequency of the affected allele was less than 14% and as a frequency as high as 47% if the missingness was as high as 5%. For the case-control simulations, the influence of missingness would result in exclusion where the affected allele was less than 21% at 3% missingness and less than 31% when missingness was 5%. Exclusion of a test marker based on HW deviation was most likely for the trio datasets, as twice the level of missingness was present for each SNP.
Discussion
For the top 1000 SNP markers in the GAIN ADHD data generated on the Perlegen
Sciences® 600K Array we observed five major classes of 2-D plots, showing no or nominal missingness (Class 0), missingness restricted to one (Class 1), two (Class 2) or all three clusters (Class 3) and those showing extra clusters (Class 4). Compared to a random sample of 2-D plots from the same data, we observed approximately 20% of plots from the top 1000 SNPs ranked by p-value showed greater than nominal missingness. The most common missingness class observed were C2HTP (missingness across the heterozygous cluster and the major-allele homozygous cluster) and the C3 clusters (missingness randomly distributed across all three clusters). Under case-control and trio design association simulations, markers with C2HTP and C3 missingness patterns were robust to type-I error. There was a significant over representation of C2HTQ (missingness across the heterozygous cluster and the minor-allele homozygous cluster) 2-D plots in an array of the top 1000 markers (OR=2.0, p=0.0195). This class of 2-D plots may result in inflated association signals, however under the null hypothesis they are unlikely to reach nominal significance.
As part of a quality control procedure for GWAS a range of filters are generally applied. Filters for missingness are applied under the assumption that missingness is random across genotypes. We have shown that this is not always the case. In order to investigate this observation we simulated the influence of missingness on the null hypothesis firstly using a case-control design where case and control data are genotyped under different conditions, one of which has inherent missingness bias. Secondly, we simulated the influence of systematic bias within the parent-offspring trio design whereby all samples are genotyped within the same bias conditions.
For data that contains missingness bias randomly distributed at equal proportions within the case and control groups, there would be no bias in the association signal. It is equally possible that bias in one of the case or control datasets can be observed if they are genotyped on the same platform but at different sites, using different array batches or from different quality or source of DNA. Our data would suggest that caution is required when considering the use of different conditions or algorithms to call genotypic data for cases compared to controls. For example, one may consider the cost-benefit of using “clean” genotype data from control samples from public domain collections such as the Welcome Trust Case Control Consortium (WTCCC) (Wellcome Trust Case Control Consortium 2007; Wellcome Trust Case Control Consortium and others 2007) and compare these data to new collection
NIH-PA Author Manuscript
NIH-PA Author Manuscript
of cases. However, unless extremely stringent quality control procedures are put in place, we would argue strongly against such an approach.
Unequal bias between the case and control groups, the most extreme scenario examined in this study, can lead to highly significant type-I error. In our simulated data we observed type-I error at genome-wide significance levels (p<10−6) for missingness levels as low as 1% under genotypic associations and 3% under allelic associations. At the expense of type-II error one can apply stringent HWE quality control to the case and control datasets. When bias occurs randomly when genotyping all case and control or all parent-child trio design together, the association tests are robust to type-I error. In the parent-child design from the GAIN-ADHD study, a quality control threshold of no more than 5% missingness is likely to be sufficient to exclude even nominal type-I error. However, if possible one would prefer to exclude or correct missingness bias as opposed to being able to tolerate their presence. Exclusion of poorly performing markers across a given platform, such as the Perlegen Sciences® array, can be achieved by examining additional GWAS performed on the platform. A prudent exclusion of markers that fail QC in any of the GWAS studies may identify and exclude technology specific problems. Additional method are being developed to impute ambiguous genotyping calls using prior information from linked markers (Marchini and others 2007). Moreover, recent software advances enable missingness by caseness (e.g. PLINK – missingness-by-phenotype routine) and non-random missingness at genotype (e.g. PLINK – non-random missingness-by-genotype routine). These routines offer an additional prudent step to the QC pipeline for GWAS, especially where different
genotyping conditions exist for different groups.
It is important to note that we observed the non-random missing phenomenon on QC-cleaned data released from a study using the Perlegen Sciences® array and Perlegen Sciences® proprietary genotype calling algorithm. How this relates to other platforms and algorithms is untested. It would be of interest to examine whether this phenomenon is genotyping technology (e.g. Affymetrix, Illumina), SNP or algorithm (e.g. Birdseed, CHIAMO) specific.
In this study we have used a moderate simulated sample size based on 3000 genotypes, 1500 cases and 1500 controls and 1000 complete parent-child trios. As sample sizes increase the influence of missingness could be amplified further, leading to a greater incidence of type-I error. The application of filtering on HWE and missingness alone is not sufficient to exclude class 4 2-D plots. These plots are indicative of allele dose differences, e.g. copy-number variation, pseudo-genes and therefore these SNPs would require different analytical techniques to ensure exclusion from analysis.
In summary, we strongly recommend manual visualisation and filtering of the top-ranked plots in GWAS before publication and follow-up, such that false positive associations due to genotype calling errors might be identified. These markers which will likely represent poorly genotyped SNPs should not be carried forward to replication as they may represent type-I error. Direct examination of closely linked or imputed data may be a prudent approach to exclude type-II error when dealing with these SNPs.
The GWAS methodologies offer an exciting opportunity to apply hypothesis-free
identification of genetic factors important in disease. However, GWAS are not a panacea for genetic association studies as they offer additional challenges to data management, data cleaning and analysis.
NIH-PA Author Manuscript
NIH-PA Author Manuscript
Acknowledgments
The scatterplots and datasets used for the analysis described in this manuscript were obtained from the GAIN Database found at http://www.ncbi.nlm.nih.gov/projects/gap/ through the dbGAP accession number
phs000016.v1.p1. The IMAGE project is a multi-site, international effort supported by NIH grant R01MH62873 to S.V. Faraone. Site Principal Investigators are Philip Asherson, Tobias Banaschewski, Jan Buitelaar, Richard P. Ebstein, Stephen V. Faraone, Michael Gill, Ana Miranda, Robert D. Oades, Herbert Roeyers, Aribert Rothenberger, Joseph Sergeant, Edmund Sonuga-Barke, and Hans-Christoph Steinhausen; Senior co-investigators are Ian Craig, Peter McGuffin, Robert Plomin, Pak Sham, Eric Taylor, Iris Manor, Jacques Eisenberg and Margaret Thompson. Chief Investigators are Evi Bitsakou, Marieke Altink, Wai Chen, Hanna Christiansen, Barbara Franke, Rafaela Marco, U Mueller, Fernando Mulas, Lamprini Psychogiou, Nanda Rommelse, Aisling Mulligan and Henrik Uebel. Other investigators are Cathelijne Buschgens, Frits Boer, Alysa Doyle, Ellen Fliers, Alexander Heise and Ruud Minderaa. We thank all the families who kindly participated in this research.
References
Affymetrix. BRLMM-P: a Genotype Calling Method for the SNP 5.0 Array Affymetrix Whitepaper. 2006. http://www.affymetix.com
Affymetrix. Birdseed Algorithm. 2007. http://www.affymetix.com
Altshuler D, Daly M. Guilt beyond a reasonable doubt. Nature Genetics. 2007; 39(7):813–815. [PubMed: 17597768]
Carvalho B, Bengtsson H, Speed TP, Irizarry RA. Exploration, normalization, and genotype calls of high-density oligonucleotide SNP array data. Biostatistics. 2007; 8(2):485–99. [PubMed: 17189563] Marchini J, Howie B, Myers S, McVean G, Donnelly P. A new multipoint method for genome-wide
association studies by imputation of genotypes. Nat Genet. 2007; 39(7):906–13. [PubMed: 17572673]
Purcell S, Neale B, Todd-Brown K, Thomas L, Ferreira MA, Bender D, Maller J, Sklar P, de Bakker PI, Daly MJ. PLINK: a tool set for whole-genome association and population-based linkage analyses. Am J Hum Genet. 2007; 81(3):559–75. others. [PubMed: 17701901]
Rabbee N, Speed TP. A genotype calling algorithm for Affymetrix SNP arrays. Bioinformatics. 2006; 22(1):7–12. [PubMed: 16267090]
The GAIN Collaborative Research Group. Manolio TA, Rodriguez LL, Brooks L, Abecasis G, Ballinger D, Daly M, Donnelly P, Faraone SV, Frazer K. New models of collaboration in genome-wide association studies: the Genetic Association Information Network. Nat Genet. 2007; 39(9): 1045–51. others. [PubMed: 17728769]
Wellcome Trust Case Control Consortium. Genome-wide association study of 14,000 cases of seven common diseases and 3,000 shared controls. Nature. 2007; 447(7145):661–78. [PubMed: 17554300]
Wellcome Trust Case Control Consortium. Burton PR, Clayton DG, Cardon LR, Craddock N, Deloukas P, Duncanson A, Kwiatkowski DP, McCarthy MI, Ouwehand WH. Association scan of 14,500 nonsynonymous SNPs in four diseases identifies autoimmunity variants. Nat Genet. 2007; 39(11):1329–37. others. [PubMed: 17952073]
NIH-PA Author Manuscript
NIH-PA Author Manuscript
Figure 1.
Cluster-Plot Classes. Clusters defined according to homozygous call of the minor-allele (blue), heterozygous (purple) and homozygous major-allele (red). Missing genotypes are shown as a black cluster. Specific cluster bias is coded as follows; Class 1 influencing one cluster of homozygous calls-only (C1HM), Class 1 influencing the one cluster of
heterozygous calls-only (C1HT), Class 2 influencing both (two) clusters of homozygous calls-only (C2HM), Class 2 influencing one homozygous and one heterozygous cluster (C2HT) and Class 3 influencing all three clusters (C3).
NIH-PA Author Manuscript
NIH-PA Author Manuscript
Figure 2.
Influence of Missingness on Hardy-Weinberg Equilibrium (HWE). Each graph shows the influence on HWE at markers for each class of “missingess”. 1%, 2%,3%, 4%, 5% and 10% missingness is plotted (see legend). Arbitrary genomewide significance is highlighted (p=10−6) alongside nominal significance (p=0.05). Specific cluster bias is coded as follows; Class 1 influencing one cluster of homozygous calls-only (C1HM), Class 1 influencing the one cluster of heterozygous calls-only (C1HT), Class 2 influencing both (two) clusters of homozygous calls-only (C2HM), Class 2 influencing one homozygous and one
heterozygous cluster (C2HT) and Class 3 influencing all three clusters (C3).
NIH-PA Author Manuscript
NIH-PA Author Manuscript
Figure 3.
Influence of Missingness on Allelic Association. Each graph shows the influence on alleleic association at markers for each class of “missingess”. 1%, 2%,3%, 4%, 5% and 10% missingness is plotted (see legend). Arbitrary genomewide significance is highlighted (p=10−6) alongside nominal significance (p=0.05). Specific cluster bias is coded as follows; Class 1 influencing one cluster of homozygous calls-only (C1HM), Class 1 influencing the one cluster of heterozygous calls-only (C1HT), Class 2 influencing both (two) clusters of homozygous calls-only (C2HM), Class 2 influencing one homozygous and one
heterozygous cluster (C2HT) and Class 3 influencing all three clusters (C3).
NIH-PA Author Manuscript
NIH-PA Author Manuscript
Figure 4.
Influence of Missingness on Transmission Equilibrium. Each graph shows the influence on the transmission disequilibrium test (TDT) at markers for each class of “missingess”. 1%, 2%,3%, 4%, 5% and 10% missingness is plotted (see legend). Arbitrary genomewide significance is highlighted (p=10−6) alongside nominal significance (p=0.05). Specific cluster bias is coded as follows; Class 1 influencing one cluster of homozygous calls-only (C1HM), Class 1 influencing the one cluster of heterozygous calls-only (C1HT), Class 2 influencing both (two) clusters of homozygous calls-only (C2HM), Class 2 influencing one homozygous and one heterozygous cluster (C2HT) and Class 3 influencing all three clusters (C3).
NIH-PA Author Manuscript
NIH-PA Author Manuscript
Figure 5.
Influence of Missingness on Hardy Weinberg Equilibrium (HWE) in 1500 cases of a 3000 individual case-control study. Each graph shows the influence on HWE (Pearson's Chi-square) at markers for each class of “missingess”. 1%, 2%,3%, 4%, 5% and 10% missingness is plotted (see legend). HWE thresholds of p=10−3 are highlighted. Specific cluster bias is coded as follows; Class 1 influencing one cluster of homozygous calls-only (C1HM), Class 1 influencing the one cluster of heterozygous calls-only (C1HT), Class 2 influencing both (two) clusters of homozygous calls-only (C2HM), Class 2 influencing one homozygous and one heterozygous cluster (C2HT) and Class 3 influencing all three clusters (C3).
NIH-PA Author Manuscript
NIH-PA Author Manuscript
Figure 6.
Influence of Missingness on Hardy Weinberg Equilibrium (HWE) in 3000 individuals of a 1000 parent-parent-child trio study. Each graph shows the influence on HWE (Pearson's Chi-square) at markers for each class of “missingess”. 1%, 2%,3%, 4%, 5% and 10% missingness is plotted (see legend). HWE thresholds of p=10−3 are highlighted. Specific cluster bias is coded as follows; Class 1 influencing one cluster of homozygous calls-only (C1HM), Class 1 influencing the one cluster of heterozygous calls-only (C1HT), Class 2 influencing both (two) clusters of homozygous calls-only (C2HM), Class 2 influencing one homozygous and one heterozygous cluster (C2HT) and Class 3 influencing all three clusters (C3).
NIH-PA Author Manuscript
NIH-PA Author Manuscript
NIH-PA Author Manuscript
NIH-PA Author Manuscript
NIH-PA Author Manuscript
Table I
Types of Scatterplots. Plots were classified as Class 0 (C0) if missingness did not exceed 1%. Class
Cluster Affected By Missingness
TOP 1000 RANDOM 1000 Odds Ratio (95%CI) CHI2 P-Value C0 N/A 753 800 0.76 (0.61-0.95) 6.32 0.0117 C1HT Heterozygous 9 8 1.1 (0.38-3.4) 0.06 0.8065 C1HMP
Homozygous (Major Allele)
12 11 1.6 (0.68-3.7) 1.3 0.2542 C1HMQ
Homozygous (Minor Allele)
3 0 -0.083 C2HTP
Heterozygous And Homozygous (Major Allele)
58 80 0.71 (0.49-1.0) 3.77 0.0522 C2HTQ
Heterozygous And Homozygous (Minor Allele)
32 16 2.0 (1.1-4.0) 5.46 0.0195 C2HM
Homozygous (Major And Minor Allele)
1 2 0.50 (0.01-9.6) 0.33 0.5657 C3
All Clusters (Random)