Distributional Semantics Beyond Words:
Supervised Learning of Analogy and Paraphrase
Peter D. Turney
National Research Council Canada Information and Communications Technologies
Ottawa, Ontario, Canada, K1A 0R6 [email protected]
Abstract
There have been several efforts to extend distributional semantics beyond individual words, to measure the similarity of word pairs, phrases, and sentences (briefly,tuples; ordered sets of words, contiguous or noncontiguous). One way to extend beyond words is to pare two tuples using a function that bines pairwise similarities between the com-ponent words in the tuples. A strength of this approach is that it works with both rela-tional similarity (analogy) and composirela-tional similarity (paraphrase). However, past work required hand-coding the combination func-tion for different tasks. The main contribufunc-tion of this paper is that combination functions are generated by supervised learning. We achieve state-of-the-art results in measuring relational similarity between word pairs (SAT analo-gies and SemEval 2012 Task 2) and measur-ing compositional similarity between noun-modifier phrases and unigrams (multiple-choice paraphrase questions).
1 Introduction
Harris (1954) and Firth (1957) hypothesized that words that appear in similar contexts tend to have similar meanings. This hypothesis is the founda-tion for distribufounda-tional semantics, in which words are represented by context vectors. The similarity of two words is calculated by comparing the two cor-responding context vectors (Lund et al., 1995; Lan-dauer and Dumais, 1997; Turney and Pantel, 2010).
Distributional semantics is highly effective for measuring the semantic similarity between individ-ual words. On a set of eighty multiple-choice syn-onym questions from the test of English as a for-eign language (TOEFL), a distributional approach recently achieved 100% accuracy (Bullinaria and Levy, 2012). However, it has been difficult to extend distributional semantics beyond individual words, to word pairs, phrases, and sentences.
Moving beyond individual words, there are vari-ous types of semantic similarity to consider. Here we focus on paraphrase and analogy. Paraphrase is similarity in the meaning of two pieces of text (Androutsopoulos and Malakasiotis, 2010). Anal-ogy is similarity in the semantic relations of two sets of words (Turney, 2008a).
It is common to study paraphrase at the sentence level (Androutsopoulos and Malakasiotis, 2010), but we prefer to concentrate on the simplest type of paraphrase, where a bigram paraphrases a unigram. For example,dog houseis a paraphrase ofkennel. In our experiments, we concentrate on noun-modifier bigrams and noun unigrams.
Analogies map terms in one domain to terms in another domain (Gentner, 1983). The familiar anal-ogy between the solar system and the Rutherford-Bohr atomic model involves several terms from the domain of the solar system and the domain of the atomic model (Turney, 2008a).
The simplest type of analogy is proportional anal-ogy, which involves two pairs of words (Turney, 2006b). For example, the pairhcook, rawiis anal-ogous to the pair hdecorate, plaini. If we cook a thing, it is no longerraw; if wedecoratea thing, it
is no longerplain. The semantic relations between
cook andraw are similar to the semantic relations betweendecorateandplain. In the following exper-iments, we focus on proportional analogies.
Erk (2013) distinguished four approaches to extend distributional semantics beyond words: In the first, a single vector space representation for a phrase or sentence is computed from the represen-tations of the individual words (Mitchell and Lap-ata, 2010; Baroni and Zamparelli, 2010). In the sec-ond, two phrases or sentences are compared by com-bining multiple pairwise similarity values (Socher et al., 2011; Turney, 2012). Third, weighted inference rules integrate distributional similarity and formal logic (Garrette et al., 2011). Fourth, a single space integrates formal logic and vectors (Clarke, 2012).
Taking the second approach, Turney (2012) intro-duced a dual-space model, with one space for mea-suring domain similarity (similarity of topic or field) and another for function similarity (similarity of role or usage). Similarities beyond individual words are calculated by functions that combine domain and function similarities of component words.
The dual-space model has been applied to mea-suring compositional similarity (paraphrase recogni-tion) and relational similarity (analogy recognirecogni-tion). In experiments that tested for sensitivity to word order, the dual-space model performed significantly better than competing approaches (Turney, 2012).
A limitation of past work with the dual-space model is that the combination functions were coded. Our main contribution is to show how hand-coding can be eliminated with supervised learning. For ease of reference, we will call our approach
SuperSim(supervised similarity). With no modifi-cation of SuperSim for the specific task (relational similarity or compositional similarity), we achieve better results than previous hand-coded models.
Compositional similarity (paraphrase) compares two contiguous phrases or sentences (n-grams),
whereas relational similarity (analogy) does not require contiguity. We usetupleto refer to both con-tiguous and nonconcon-tiguous word sequences.
We approach analogy as a problem of supervised tuple classification. To measure the relational sim-ilarity between two word pairs, we train SuperSim with quadruples that are labeled as positive and neg-ative examples of analogies. For example, the
pro-portional analogy hcook, raw, decorate, plaini is labeled as a positive example.
A quadruple is represented by a feature vector, composed of domain and function similarities from the dual-space model and other features based on corpus frequencies. SuperSim uses a support vector machine (Platt, 1998) to learn the probability that a quadruple ha, b, c, di consists of a word pair ha, bi
and an analogous word pairhc, di. The probability can be interpreted as the degree of relational similar-ity between the two given word pairs.
We also approach paraphrase as supervised tuple classification. To measure the compositional simi-larity beween an m-gram and ann-gram, we train
the learning algorithm with(m+n)-tuples that are
positive and negative examples of paraphrases. SuperSim learns to estimate the probability that a tripleha, b, ciconsists of a compositional bigram
aband a synonymous unigramc. For instance, the
phrasefish tankis synonymous withaquarium; that is,fish tankandaquariumhave high compositional similarity. The triplehfish, tank, aquariumiis repre-sented using the same features that we used for anal-ogy. The probability of the triple can be interpreted as the degree of compositional similarity between the given bigram and unigram.
We review related work in Section 2. The gen-eral feature space for learning relations and compo-sitions is presented in Section 3. The experiments with relational similarity are described in Section 4, and Section 5 reports the results with compositional similarity. Section 6 discusses the implications of the results. We consider future work in Section 7 and conclude in Section 8.
2 Related Work
2.1 Relational Similarity
LRA (latent relational analysis) measures rela-tional similarity with a pair–pattern matrix (Turney, 2006b). Rows in the matrix correspond to word pairs (a, b) and columns correspond to patterns that connect the pairs (“a for the b”) in a large
cor-pus. This is aholistic(noncompositional) approach to distributional similarity, since the word pairs are opaque wholes; the component words have no sep-arate representations. A compositional approach to analogy has a representation for each word, and a word pair is represented by composing the represen-tations for each member of the pair. Given a vocabu-lary ofN words, a compositional approach requires
N representations to handle all possible word pairs,
but a holistic approach requiresN2representations.
Holistic approaches do not scale up (Turney, 2012). LRA required nine days to run.
Bollegala et al. (2008) answered the SAT anal-ogy questions with a support vector machine trained on quadruples (proportional analogies), as we do here. However, their feature vectors are holistic, and hence there are scaling problems.
Herda˘gdelen and Baroni (2009) used a support vector machine to learn relational similarity. Their feature vectors contained a combination of holistic and compositional features.
Measuring relational similarity is closely con-nected to classifying word pairs according to their semantic relations (Turney and Littman, 2005). Semantic relation classification was the focus of SemEval 2007 Task 4 (Girju et al., 2007) and SemEval 2010 Task 8 (Hendrickx et al., 2010).
2.2 Compositional Similarity
To extend distributional semantics beyond words, many researchers take the first approach described by Erk (2013), in which a single vector space is used for individual words, phrases, and sentences (Lan-dauer and Dumais, 1997; Mitchell and Lapata, 2008; Mitchell and Lapata, 2010). In this approach, given the wordsaandbwith context vectorsaandb, we construct a vector for the bigramabby applying
vec-tor operations toaandb.
Mitchell and Lapata (2010) experiment with many different vector operations and find that element-wise multiplication performs well. The
bigram ab is represented by c = a b, where
ci = ai · bi. However, element-wise multiplica-tion is commutative, so the bigramsabandbamap
to the same vector c. In experiments that test for order sensitivity, element-wise multiplication per-forms poorly (Turney, 2012).
We can treat the bigramabas a unit, as if it were
a single word, and construct a context vector for
abfrom occurrences of ab in a large corpus. This holistic approach to representing bigrams performs well when a limited set of bigrams is specified in advance (before building the word–context matrix), but it does not scale up, because there are too many possible bigrams (Turney, 2012).
Although the holistic approach does not scale up, we can generate a few holistic bigram vectors and use them to train a supervised regression model (Guevara, 2010; Baroni and Zamparelli, 2010). Given a new bigramcd, not observed in the corpus,
the regression model can predict a holistic vector for
cd, if c and d have been observed separately. We
show in Section 5 that this idea can be adapted to train SuperSim without manually labeled data.
Socher et al. (2011) take the second approach described by Erk (2013), in which two sentences are compared by combining multiple pairwise ity values. They construct a variable-sized similar-ity matrixX, in which the element xij is the sim-ilarity between the i-th phrase of one sentence and
thej-th phrase of the other. Since supervised
learn-ing is simpler with fixed-sized feature vectors, the variable-sized similarity matrix is then reduced to a smaller fixed-sized matrix, to allow comparison of pairs of sentences of varying lengths.
2.3 Unified Perspectives on Similarity
Socher et al. (2012) represent words and phrases with a pair, consisting of a vector and a matrix. The vector captures the meaning of the word or phrase and the matrix captures how a word or phrase mod-ifies the meaning of another word or phrase when they are combined. They apply this matrix–vector representation to both compositions and relations.
functional role of the word. This dual-space model is applied to both compositions and relations.
Here we extend the dual-space model of Tur-ney (2012) in two ways: Hand-coding is replaced with supervised learning and two new sets of fea-tures augment domain and function space. Moving to supervised learning instead of hand-coding makes it easier to introduce new features.
In the dual-space model, parameterized similar-ity measures provided the input values for hand-crafted functions. Each task required a different set of hand-crafted functions. The parameters of the similarity measures were tuned using a customized grid search algorithm. The grid search algorithm was not suitable for integration with a supervised learning algorithm. The insight behind SuperSim is that, given appropriate features, a supervised learn-ing algorithm can replace the grid search algorithm and the hand-crafted functions.
3 Features for Tuple Classification
We represent a tuple with four types of features, all based on frequencies in a large corpus. The first type of feature is the logarithm of the frequency of a word. The second type is the positive point-wise mutual information (PPMI) between two words (Church and Hanks, 1989; Bullinaria and Levy, 2007). Third and fourth are the similarities of two words in domain and function space (Turney, 2012). In the following experiments, we use the PPMI matrix from Turney et al. (2011) and the domain and function matrices from Turney (2012).1 The three
matrices and the word frequency data are based on the same corpus, a collection of web pages gath-ered from university web sites, containing5×1010 words.2 All three matrices are word–context
matri-ces, in which the rows correspond to terms (words and phrases) in WordNet.3The columns correspond
to the contexts in which the terms appear; each matrix involves a different kind of context.
1The three matrices and the word frequency data are avail-able on request from the author. The matrix files range from two to five gigabytes when packaged and compressed for distri-bution.
2The corpus was collected by Charles Clarke at the Univer-sity of Waterloo. It is about 280 gigabytes of plain text.
3See http://wordnet.princeton.edu/ for infor-mation about WordNet.
Lethx1, x2, . . . , xnibe ann-tuple of words. The
number of features we use to represent this tuple increases as a function ofn.
The first set of features consists of log frequency values for each wordxiin then-tuple. Let freq(xi) be the frequency of xi in the corpus. We define LF(xi)as log(freq(xi)+1). Ifxiis not in the corpus, freq(xi)is zero, and thus LF(xi)is also zero. There arenlog frequency features, one LF(xi)feature for each word in then-tuple.
The second set of features consists of positive pointwise mutual information values for each pair of words in then-tuple. We use the raw PPMI matrix
from Turney et al. (2011). Although they computed the singular value decomposition (SVD) to project the row vectors into a lower-dimensional space, we need the original high-dimensional columns for our features. The raw PPMI matrix has 114,501 rows and 139,246 columns with a density of 1.2%. For each term in WordNet, there is a corresponding row in the raw PPMI matrix. For each unigram in Word-Net, there are two corresponding columns in the raw PPMI matrix, one markedleftand the otherright.
Suppose xi corresponds to the i-th row of the PPMI matrix and xj corresponds the j-th column, markedleft. The value in thei-th row andj-th
col-umn of the PPMI matrix, PPMI(xi, xj,left), is the positive pointwise mutual information ofxi andxj co-occurring in the corpus, wherexjis the first word to the left ofxi, ignoring any intervening stop words (that is, ignoring any words that are not in WordNet). Ifxi (orxj) has no corresponding row (or column) in the matrix, then the PPMI value is set to zero.
Turney et al. (2011) estimated PPMI(xi, xj,left) by sampling the corpus for phrases containingxiand then looking forxj to the left ofxi in the sampled phrases (and likewise for right). Due to this sam-pling process, PPMI(xi, xj,left) does not necessar-ily equal PPMI(xj, xi,right). For example, suppose
From the n-tuple, we select all of the n(n−1) pairs, hxi, xji, such that i 6= j. We then gener-ate two features for each pair, PPMI(xi, xj,left)and PPMI(xi, xj,right). Thus there are2n(n−1)PPMI values in the second set of features.
The third set of features consists of domain space similarity values for each pair of words in the
n-tuple. Domain space was designed to capture the
topic of a word. Turney (2012) first constructed a frequency matrix, in which the rows correspond to terms in WordNet and the columns correspond to nearby nouns. Given a termxi, the corpus was sam-pled for phrases containingxiand the phrases were processed with a part-of-speech tagger, to identify nouns. If the nounxjwas the closest noun to the left or right ofxi, then the frequency count for thei-th row andj-th column was incremented. The
hypoth-esis was that the nouns near a term characterize the topics associated with the term.
The word–context frequency matrix for domain space has 114,297 rows (terms) and 50,000 columns (noun contexts, topics), with a density of 2.6%. The frequency matrix was converted to a PPMI matrix and then smoothed with SVD. The SVD yields three matrices,U,Σ, andV.
A term in domain space is represented by a row vector inUkΣpk. The parameterkspecifies the num-ber of singular values in the truncated singular value decomposition; that is, k is the number of latent
factors in the low-dimensional representation of the term (Landauer and Dumais, 1997). We generate Uk and Σk by deleting the columns in U and Σ corresponding to the smallest singular values. The parameter praises the singular values inΣk to the powerp(Caron, 2001). Aspgoes from one to zero,
factors with smaller singular values are given more weight. This has the effect of making the similarity measure more discriminating (Turney, 2012).
The similarity of two words in domain space, Dom(xi, xj, k, p), is computed by extracting the row vectors inUkΣpkthat correspond to the wordsxiand
xj, and then calculating their cosine. Optimal per-formance requires tuning the parameterskandpfor
the task (Bullinaria and Levy, 2012; Turney, 2012). In the following experiments, we avoid directly tun-ingkandpby generating features with a variety of
values forkandp, allowing the supervised learning
algorithm to decide which features to use.
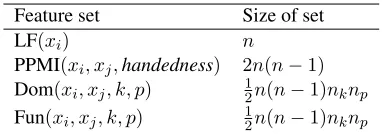
Feature set Size of set
LF(xi) n
[image:5.612.331.522.53.120.2]PPMI(xi, xj,handedness) 2n(n−1) Dom(xi, xj, k, p) 21n(n−1)nknp Fun(xi, xj, k, p) 21n(n−1)nknp
Table 1: The four sets of features and their sizes.
From then-tuple, we select all 12n(n−1)pairs, hxi, xji, such that i < j. For each pair, we gen-erate domain similarity features, Dom(xi, xj, k, p), wherekvaries from 100 to 1000 in steps of 100 and pvaries from 0 to 1 in steps of 0.1. The number ofk
values,nk, is 10 and the number ofpvalues,np, is 11; therefore there are 110 features,nknp, for each pair,hxi, xji. Thus there are12n(n−1)nknpdomain space similarity values in the third set of features.
The fourth set of features consists of function space similarity values for each pair of words in the
n-tuple. Function space was designed to capture the
functional role of a word. It is similar to domain space, except the context is based on verbal patterns, instead of nearby nouns. The hypothesis was that the functional role of a word is characterized by the patterns that relate the word to nearby verbs.
The word–context frequency matrix for function space has 114,101 rows (terms) and 50,000 columns (verb pattern contexts, functional roles), with a den-sity of 1.2%. The frequency matrix was converted to a PPMI matrix and smoothed with SVD.
From then-tuple, we select all 12n(n−1)pairs, hxi, xji, such thati < j. For each pair, we generate function similarity features, Fun(xi, xj, k, p), where
kandp vary as they did with domain space. Thus
there are 1
2n(n−1)nknp function space similarity values in the fourth set of features.
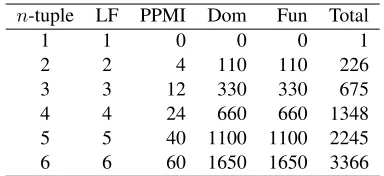
Table 1 summarizes the four sets of features and the size of each set as a function ofn, the number of words in the given tuple. The values ofnk andnp (10 and 11) are considered to be constants. Table 2 shows the number of elements in the feature vector, asnvaries from 1 to 6. The total number of features
isO(n2). We believe that this is acceptable growth
n-tuple LF PPMI Dom Fun Total
1 1 0 0 0 1
2 2 4 110 110 226
3 3 12 330 330 675
4 4 24 660 660 1348
5 5 40 1100 1100 2245
[image:6.612.89.281.53.141.2]6 6 60 1650 1650 3366
Table 2: Number of features for various tuple sizes.
corpus. The PPMI features are based on direct co-occurrences of two words; that is, PPMI is only greater than zero if the two words actually occur together in the corpus. Domain and function space capture indirect or higher-order co-occurrence, due to the truncated SVD (Lemaire and Denhi`ere, 2006); that is, the values of Dom(xi, xj, k, p) and Fun(xi, xj, k, p) can be high even when xi andxj do not actually co-occur in the corpus. We conjec-ture that there are yet higher orders in this hierarchy that would provide improved similarity measures.
SuperSim learns to classify tuples by representing them with these features. SuperSim uses the sequen-tial minimal optimization (SMO) support vector machine (SVM) as implemented in Weka (Platt, 1998; Witten et al., 2011).4 The kernel is a
normal-ized third-order polynomial. Weka provides proba-bility estimates for the classes by fitting the outputs of the SVM with logistic regression models.
4 Relational Similarity
This section presents experiments with learning rela-tional similarity using SuperSim. The training datasets consist of quadruples that are labeled as positive and negative examples of analogies. Table 2 shows that the feature vectors have 1,348 elements.
We experiment with three datasets, a collection of 374 five-choice questions from the SAT col-lege entrance exam (Turney et al., 2003), a modi-fied ten-choice variation of the SAT questions (Tur-ney, 2012), and the relational similarity dataset from SemEval 2012 Task 2 (Jurgens et al., 2012).5
4Weka is available athttp://www.cs.waikato.ac.
nz/ml/weka/.
5The SAT questions are available on request from the author. The SemEval 2012 Task 2 dataset is available athttps:// sites.google.com/site/semeval2012task2/.
Stem: word:language
Choices: (1) paint:portrait (2) poetry:rhythm (3) note:music (4) tale:story (5) week:year Solution: (3) note:music
Table 3: A five-choice SAT analogy question.
4.1 Five-choice SAT Questions
Table 3 is an example of a question from the 374 five-choice SAT questions. Each five-choice ques-tion yields five labeled quadruples, by combining the stem with each choice. The quadruplehword,
lan-guage, note, musiciis labeledpositiveand the other four quadruples are labelednegative.
Since learning works better with balanced train-ing data (Japkowicz and Stephen, 2002), we use the symmetries of proportional analogies to add more positive examples (Lepage and Shin-ichi, 1996). For each positive quadruple, ha, b, c, di, we add three more positive quadruples, hb, a, d, ci, hc, d, a, bi, andhd, c, b, ai. Thus each five-choice question
pro-vides four positive and four negative quadruples. We use ten-fold cross-validation to apply Super-Sim to the SAT questions. The folds are constructed so that the eight quadruples from each SAT question are kept together in the same fold. To answer a ques-tion in the testing fold, the learned model assigns a probability to each of the five choices and guesses the choice with the highest probability. SuperSim achieves a score of 54.8% correct (205 out of 374).
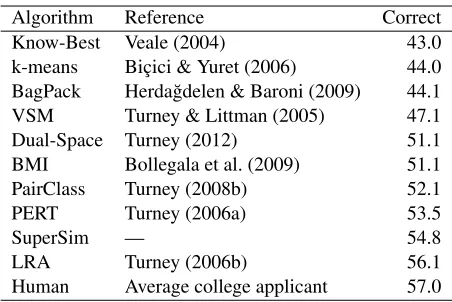
Table 4 gives the rank of SuperSim in the list of the top ten results with the SAT analogy questions.6
The scores ranging from 51.1% to 57.0% are not sig-nificantly different from SuperSim’s score of 54.8%, according to Fisher’s exact test at the 95% confi-dence level. However, SuperSim answers the SAT questions in a few minutes, whereas LRA requires nine days, and SuperSim learns its models automat-ically, unlike the hand-coding of Turney (2012).
6See theState of the Artpage on the ACL Wiki athttp:
[image:6.612.357.497.53.143.2]Algorithm Reference Correct
Know-Best Veale (2004) 43.0
k-means Bic¸ici & Yuret (2006) 44.0 BagPack Herda˘gdelen & Baroni (2009) 44.1
VSM Turney & Littman (2005) 47.1
Dual-Space Turney (2012) 51.1
BMI Bollegala et al. (2009) 51.1
PairClass Turney (2008b) 52.1
PERT Turney (2006a) 53.5
SuperSim — 54.8
LRA Turney (2006b) 56.1
[image:7.612.317.535.52.204.2]Human Average college applicant 57.0
Table 4: The top ten results on five-choice SAT questions.
4.2 Ten-choice SAT Questions
In addition to symmetries, proportional analogies have asymmetries. In general, if the quadruple ha, b, c, di is positive, ha, d, c, bi is negative. For example, hword, language, note, musici is a good analogy, but hword, music, note, languagei is not.
Wordsare the basic units oflanguageandnotesare the basic units ofmusic, butwordsare not necessary formusicandnotesare not necessary forlanguage.
Turney (2012) used this asymmetry to convert the 374 five-choice SAT questions into 374 ten-choice SAT questions. Each choice hc, di was expanded with the stem ha, bi, resulting in the
quadruple ha, b, c, di, and then the order was shuf-fled toha, d, c, bi, so that each choice pair in a five-choice question generated two five-choice quadruples in a ten-choice question. Nine of the quadruples are negative examples and the quadruple consisting of the stem pair followed by the solution pair is the only positive example. The purpose of the ten-choice questions is to test the ability of measures of rela-tional similarity to avoid the asymmetric distractors. We use the ten-choice questions to compare the hand-coded dual-space approach (Turney, 2012) with SuperSim. We also use these questions to per-form an ablation study of the four sets of features in SuperSim. As with the five-choice questions, we use the symmetries of proportional analogies to add three more positive examples, so the training dataset has nine negative examples and four posi-tive examples per question. We apply ten-fold cross-validation to the 374 ten-choice questions.
On the ten-choice questions, SuperSim’s score
Features
Algorithm LF PPMI Dom Fun Correct
Dual-Space 0 0 1 1 47.9
SuperSim 1 1 1 1 52.7
SuperSim 0 1 1 1 52.7
SuperSim 1 0 1 1 52.7
SuperSim 1 1 0 1 45.7
SuperSim 1 1 1 0 41.7
SuperSim 1 0 0 0 5.6
SuperSim 0 1 0 0 32.4
SuperSim 0 0 1 0 39.6
SuperSim 0 0 0 1 39.3
Table 5: Feature ablation with ten-choice SAT questions.
is 52.7% (Table 5), compared to 54.8% on the five-choice questions (Table 4), a drop of 2.1%. The hand-coded dual-space model scores 47.9% (Table 5), compared to 51.1% on the five-choice questions (Table 4), a drop of 3.2%. The dif-ference between SuperSim (52.7%) and the hand-coded dual-space model (47.9%) is not significant according to Fisher’s exact test at the 95% confi-dence level. The advantage of SuperSim is that it does not need hand-coding. The results show that SuperSim can avoid the asymmetric distractors.
Table 5 shows the impact of different subsets of features on the percentage of correct answers to the ten-choice SAT questions. Included features are marked 1 and ablated features are marked 0. The results show that the log frequency (LF) and PPMI features are not helpful (but also not harmful) for relational similarity. We also see that domain space and function space are both needed for good results.
4.3 SemEval 2012 Task 2
The SemEval 2012 Task 2 dataset is based on the semantic relation classification scheme of Bejar et al. (1991), consisting of ten high-level categories of relations and seventy-nine subcategories, with paradigmatic examples of each subcategory. For instance, the subcategory taxonomic in the cate-gory class inclusion has three paradigmatic exam-ples,flower:tulip,emotion:rage, andpoem:sonnet.
[image:7.612.74.300.53.204.2]Algorithm Reference Spearman
BUAP Tovar et al. (2012) 0.014
Duluth-V2 Pedersen (2012) 0.038
Duluth-V1 Pedersen (2012) 0.039
Duluth-V0 Pedersen (2012) 0.050
UTD-SVM Rink & Harabagiu (2012) 0.116 UTD-NB Rink & Harabagiu (2012) 0.229
RNN-1600 Mikolov et al. (2013) 0.275
UTD-LDA Rink & Harabagiu (2013) 0.334
Com Zhila et al. (2013) 0.353
[image:8.612.358.495.52.168.2]SuperSim — 0.408
Table 6: Spearman correlations for SemEval 2012 Task 2.
average of forty-one word pairs per subcategory, a total of 3,218 pairs. In the second phase, each word pair from the first phase was assigned a prototypical-ity score, indicating its similarprototypical-ity to the paradigmatic examples. The challenge of SemEval 2012 Task 2 was to guess the prototypicality scores.
SuperSim was trained on the five-choice SAT questions and evaluated on the SemEval 2012 Task 2 test dataset. For a given a word pair, we created quadruples, combining the word pair with each of the paradigmatic examples for its subcategory. We then used SuperSim to compute the probabilities for each quadruple. Our guess for the prototypicality score of the given word pair was the average of the probabilities. Spearman’s rank correlation coef-ficient between the Turkers’ prototypicality scores and SuperSim’s scores was 0.408, averaged over the sixty-nine subcategories in the testing set. Super-Sim has the highest Spearman correlation achieved to date on SemEval 2012 Task 2 (see Table 6).
5 Compositional Similarity
This section presents experiments using SuperSim to learn compositional similarity. The datasets con-sist of triples, ha, b, ci, such that ab is a
noun-modifier bigram and c is a noun unigram. The
triples are labeled as positive and negative exam-ples of paraphrases. Table 2 shows that the fea-ture vectors have 675 elements. We experiment with two datasets, seven-choice and fourteen-choice noun-modifier questions (Turney, 2012).7
7The seven-choice dataset is available athttp://jair.
org/papers/paper3640.html. The fourteen-choice dataset can be generated from the seven-choice dataset.
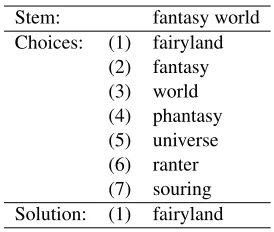
Stem: fantasy world
[image:8.612.76.295.53.190.2]Choices: (1) fairyland (2) fantasy (3) world (4) phantasy (5) universe (6) ranter (7) souring Solution: (1) fairyland
Table 7: A noun-modifier question based on WordNet.
5.1 Noun-Modifier Questions
The first dataset is a seven-choice noun-modifier question dataset, constructed from WordNet (Tur-ney, 2012). The dataset contains 680 questions for training and 1,500 for testing, a total of 2,180 ques-tions. Table 7 shows one of the quesques-tions.
The stem is a bigram and the choices are uni-grams. The bigram is composed of a head noun (world), modified by an adjective or noun (fantasy). The solution is the unigram (fairyland) that belongs to the same WordNet synset as the stem.
The distractors are designed to be difficult for cur-rent approaches to composition. For example, if fan-tasy worldis represented by element-wise multipli-cation of the context vectors forfantasy andworld
(Mitchell and Lapata, 2010), the most likely guess isfantasyorworld, notfairyland(Turney, 2012).
Each seven-choice question yields seven labeled triples, by combining the stem with each choice. The triplehfantasy, world, fairylandiis labeled
pos-itiveand the other six triples are labelednegative. In general, if ha, b, ci is a positive example, then hb, a, ci is negative. For example, world fantasyis not a paraphrase of fairyland. The second dataset is constructed by applying this shuffling transfor-mation to convert the 2,180 seven-choice questions into 2,180 fourteen-choice questions (Turney, 2012). The second dataset is designed to be difficult for approaches that are not sensitive to word order.
Correct
Algorithm 7-choices 14-choices
Vector addition 50.1 22.5
Element-wise multiplication 57.5 27.4
Dual-Space model 58.3 41.5
SuperSim 75.9 68.0
[image:9.612.319.533.52.205.2]Holistic model 81.6 —
Table 8: Results for the two noun-modifier datasets.
better than all other approaches, except for the holis-tic approach, according to Fisher’s exact test at the 95% confidence level.8
The holistic approach is noncompositional. The stem bigram is represented by a single context vec-tor, generated by treating the bigram as if it were a unigram. A noncompositional approach cannot scale up to realistic applications (Turney, 2012). The holistic approach cannot be applied to the fourteen-choice questions, because the bigrams in these ques-tions do not correspond to terms in WordNet, and hence they do not correspond to row vectors in the matrices we use (see Section 3).
Turney (2012) found it necessary to hand-code a soundness check into all of the algorithms (vector addition, element-wise multiplication, dual-space, and holistic). Given a stemaband a choice c, the
hand-coded check assigns a minimal score to the choice ifc = aorc = b. We do not need to
hand-code any checking into SuperSim. It learns automat-ically from the training data to avoid such choices.
5.2 Ablation Experiments
Table 9 shows the effects of ablating sets of fea-tures on the performance of SuperSim with the fourteen-choice questions. PPMI features are the most important; by themselves, they achieve 59.7% correct, although the other features are needed to reach 68.0%. Domain space features reach the sec-ond highest performance when used alone (34.6%), but they reduce performance (from 69.3% to 68.0%) when combined with other features; however, the drop is not significant according to Fisher’s exact test at the 95% significance level.
Since the PPMI features play an important role in answering the noun-modifier questions, let us take 8The results for SuperSim are new but the other results in Table 8 are from Turney (2012).
Features
Algorithm LF PPMI Dom Fun Correct
Dual-Space 0 0 1 1 41.5
SuperSim 1 1 1 1 68.0
SuperSim 0 1 1 1 66.6
SuperSim 1 0 1 1 52.3
SuperSim 1 1 0 1 69.3
SuperSim 1 1 1 0 65.9
SuperSim 1 0 0 0 14.1
SuperSim 0 1 0 0 59.7
SuperSim 0 0 1 0 34.6
SuperSim 0 0 0 1 32.9
Table 9: Ablation with fourteen-choice questions.
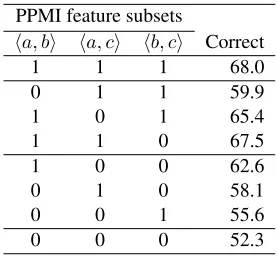
PPMI feature subsets
ha, bi ha, ci hb, ci Correct
1 1 1 68.0
0 1 1 59.9
1 0 1 65.4
1 1 0 67.5
1 0 0 62.6
0 1 0 58.1
0 0 1 55.6
[image:9.612.74.300.54.143.2]0 0 0 52.3
Table 10: PPMI subset ablation with fourteen-choices.
a closer look at them. From Table 2, we see that there are twelve PPMI features for the tripleha, b, ci, whereabis a noun-modifier bigram andcis a noun
unigram. We can split the twelve features into three subsets, one subset for each pair of words, ha, bi, ha, ci, andhb, ci. For example, the subset forha, bi is the four features PPMI(a, b,left), PPMI(b, a,left),
PPMI(a, b,right), and PPMI(b, a,right). Table 10 shows the effects of ablating these subsets.
The results in Table 10 indicate that all three PPMI subsets contribute to the performance of SuperSim, but the ha, bi subset contributes more than the other two subsets. Theha, bifeatures help
to increase the sensitivity of SuperSim to the order of the words in the noun-modifier bigram; for exam-ple, they make it easier to distinguishfantasy world
fromworld fantasy.
5.3 Holistic Training
[image:9.612.357.496.238.366.2]Stem: search engine Choices: (1) search engine
(2) search (3) engine
[image:10.612.350.501.52.104.2](4) search language (5) search warrant (6) diesel engine (7) steam engine Solution: (1) search engine
Table 11: A question based on holistic vectors.
synsets. It would be advantageous to be able to train SuperSim with less reliance on expert knowledge.
Past work with adjective-noun bigrams has shown that we can use holistic bigram vectors to train a supervised regression model (Guevara, 2010; Baroni and Zamparelli, 2010). The output of the regression model is a vector representation for a bigram that approximates the holistic vector for the bigram; that is, it approximates the vector we would get by treat-ing the bigram as if it were a unigram.
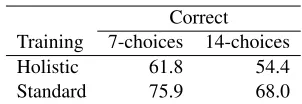
SuperSim does not generate vectors as output, but we can still use holistic bigram vectors for training. Table 11 shows a seven-choice training question that was generated without using WordNet synsets. The choices of the forma bare bigrams, but we repre-sent them with holistic bigram vectors; we pretend they are unigrams. We call a b bigrams pseudo-unigrams. As far as SuperSim is concerned, there is no difference between these pseudo-unigrams and true unigrams. The question in Table 11 is treated the same as the question in Table 7.
We generate 680 holistic training questions by randomly selecting 680 noun-modifier bigrams from WordNet as stems for the questions (search engine), avoiding any bigrams that appear as stems in the testing questions. The solution (search engine) is the pseudo-unigram that corresponds to the stem bigram. In the matrices in Section 3, each term in WordNet corresponds to a row vector. These corresponding row vectors enable us to treat bigrams from WordNet as if they were unigrams. The distractors are the component unigrams in the stem bigram (search and engine) and pseudo-unigrams that share a component word with the stem (search warrant, diesel engine). To construct the holistic training questions, we used WordNet as a
Correct Training 7-choices 14-choices
Holistic 61.8 54.4
Standard 75.9 68.0
Table 12: Results for SuperSim with holistic training.
source of bigrams, but we ignored the rich infor-mation that WordNet provides about these bigrams, such as their synonyms, hypernyms, hyponyms, meronyms, and glosses.
Table 12 compares holistic training to standard training (that is, training with questions like Table 11 versus training with questions like Table 7). The testing set is the standard testing set in both cases. There is a significant drop in performance with holistic training, but the performance still surpasses vector addition, element-wise multiplication, and the hand-coded dual-space model (see Table 8).
Since holistic questions can be generated auto-matically without human expertise, we experi-mented with increasing the size of the holistic train-ing dataset, growtrain-ing it from 1,000 to 10,000 ques-tions in increments of 1,000. The performance on the fourteen-choice questions with holistic train-ing and standard testtrain-ing varied between 53.3% and 55.1% correct, with no clear trend up or down. This is not significantly different from the performance with 680 holistic training questions (54.4%).
It seems likely that the drop in performance with holistic training instead of standard training is due to a difference in the nature of the standard questions (Table 7) and the holistic questions (Table 11). We are currently investigating this issue. We expect to be able to close the performance gap in future work, by improving the holistic questions. However, it is possible that there are fundamental limits to holistic training.
6 Discussion
[image:10.612.112.258.52.167.2]large effect on fourteen-choice noun-modifier para-phrase performance (Table 9).
One advantage of supervised learning over hand-coding is that it facilitates adding new features. It is not clear how to modify the hand-coded equations for the dual-space model of noun-modifier composi-tion (Turney, 2012) to include PPMI informacomposi-tion.
SuperSim is one of the few approaches to distri-butional semantics beyond words that has attempted to address both relational and compositional similar-ity (see Section 2.3). It is a strength of this approach that it works well with both kinds of similarity.
7 Future Work and Limitations
Given the promising results with holistic training for noun-modifier paraphrases, we plan to experiment with holistic training for analogies. Consider the proportional analogy hard is to hard time asgood
is togood time, wherehard timeandgood timeare pseudo-unigrams. To a human, this analogy is triv-ial, but SuperSim has no access to the surface form of a term. As far as SuperSim is concerned, this analogy is much the same as the analogyhardis to
difficulty asgoodis to fun. This strategy automat-ically converts simple, easily generated analogies into more complex, challenging analogies, which may be suited to training SuperSim.
This also suggests that noun-modifier paraphrases may be used to solve analogies. Perhaps we can evaluate the quality of a candidate analogy ha, b, c, di by searching for a term e such that
hb, e, ai and hd, e, ci are good paraphrases. For
example, consider the analogymasonis tostoneas
carpenteris towood. We can paraphrasemasonas
stone worker andcarpenter aswood worker. This transforms the analogy to stone workeris to stone
aswood workeris towood, which makes it easier to recognize the relational similarity.
Another area for future work is extending Super-Sim beyond noun-modifier paraphrases to measur-ing the similarity of sentence pairs. We plan to adapt ideas from Socher et al. (2011) for this task. They usedynamic poolingto represent sentences of vary-ing size with size feature vectors. Usvary-ing fixed-size feature vectors avoids the problem of quadratic growth and it enables the supervised learner to gen-eralize over sentences of varying length.
Some of the competing approaches discussed by Erk (2013) incorporate formal logic. The work of Baroni et al. (2012) suggests ways that SuperSim could be developed to deal with logic.
We believe that SuperSim could benefit from more features, with greater diversity. One place to look for these features is higher levels in the hierar-chy that we sketch in Section 3.
Our ablation experiments suggest that domain and function spaces provide the most important features for relational similarity, but PPMI values provide the most important features for noun-modifier composi-tional similarity. Explaining this is another topic for future research.
8 Conclusion
In this paper, we have presented SuperSim, a unified approach to analogy (relational similarity) and para-phrase (compositional similarity). SuperSim treats them both as problems of supervised tuple classifi-cation. The supervised learning algorithm is a stan-dard support vector machine. The main contribution of SuperSim is a set of four types of features for rep-resenting tuples. The features work well with both analogy and paraphrase, with no task-specific mod-ifications. SuperSim matches the state of the art on SAT analogy questions and substantially advances the state of the art on the SemEval 2012 Task 2 chal-lenge and the noun-modifier paraphrase questions.
References
Eneko Agirre, Daniel Cer, Mona Diab, and Aitor Gonzalez-Agirre. 2012. Semeval-2012 Task 6: A pilot on semantic textual similarity. In Proceedings of the First Joint Conference on Lexical and Compu-tational Semantics (*SEM), pages 385–393, Montr´eal, Canada.
Ion Androutsopoulos and Prodromos Malakasiotis. 2010. A survey of paraphrasing and textual entailment methods. Journal of Artificial Intelligence Research, 38:135–187.
Marco Baroni and Roberto Zamparelli. 2010. Nouns are vectors, adjectives are matrices: Representing adjective-noun constructions in semantic space. In
Proceedings of the 2010 Conference on Empirical Methods in Natural Language Processing (EMNLP 2010), pages 1183–1193.
Marco Baroni, Raffaella Bernardi, Ngoc-Quynh Do, and Chung-chieh Shan. 2012. Entailment above the word level in distributional semantics. InProceedings of the 13th Conference of the European Chapter of the Asso-ciation for Computational Linguistics (EACL 2012), pages 23–32.
Isaac I. Bejar, Roger Chaffin, and Susan E. Embretson. 1991. Cognitive and Psychometric Analysis of Ana-logical Problem Solving. Springer-Verlag.
Ergun Bic¸ici and Deniz Yuret. 2006. Clustering word pairs to answer analogy questions. InProceedings of the Fifteenth Turkish Symposium on Artificial Intelli-gence and Neural Networks (TAINN 2006), Akyaka, Mugla, Turkey.
Danushka Bollegala, Yutaka Matsuo, and Mitsuru Ishizuka. 2008. WWW sits the SAT: Measuring rela-tional similarity on the Web. In Proceedings of the 18th European Conference on Artificial Intelligence (ECAI 2008), pages 333–337, Patras, Greece.
Danushka Bollegala, Yutaka Matsuo, and Mitsuru Ishizuka. 2009. Measuring the similarity between implicit semantic relations from the Web. In Proceed-ings of the 18th International Conference on World Wide Web (WWW 2009), pages 651–660.
John Bullinaria and Joseph Levy. 2007. Extract-ing semantic representations from word co-occurrence statistics: A computational study. Behavior Research Methods, 39(3):510–526.
John Bullinaria and Joseph Levy. 2012. Extract-ing semantic representations from word co-occurrence statistics: Stop-lists, stemming, and SVD. Behavior Research Methods, 44(3):890–907.
John Caron. 2001. Experiments with LSA scor-ing: Optimal rank and basis. In Proceedings of the SIAM Computational Information Retrieval Work-shop, pages 157–169, Raleigh, NC.
Kenneth Church and Patrick Hanks. 1989. Word asso-ciation norms, mutual information, and lexicography. In Proceedings of the 27th Annual Conference of the Association of Computational Linguistics, pages 76– 83, Vancouver, British Columbia.
Daoud Clarke. 2012. A context-theoretic framework for compositionality in distributional semantics. Compu-tational Linguistics, 38(1):41–71.
Katrin Erk. 2013. Towards a semantics for distributional representations. In Proceedings of the 10th Interna-tional Conference on ComputaInterna-tional Semantics (IWCS 2013), Potsdam, Germany.
John Rupert Firth. 1957. A synopsis of linguistic theory 1930–1955. InStudies in Linguistic Analysis, pages 1–32. Blackwell, Oxford.
Dan Garrette, Katrin Erk, and Ray Mooney. 2011. Inte-grating logical representations with probabilistic infor-mation using markov logic. InProceedings of the 9th International Conference on Computational Semantics (IWCS 2011), pages 105–114.
Dedre Gentner. 1983. Structure-mapping: A theoretical framework for analogy. Cognitive Science, 7(2):155– 170.
Roxana Girju, Preslav Nakov, Vivi Nastase, Stan Szpakowicz, Peter Turney, and Deniz Yuret. 2007. Semeval-2007 task 04: Classification of semantic relations between nominals. In Proceedings of the Fourth International Workshop on Semantic Evalua-tions (SemEval 2007), pages 13–18, Prague, Czech Republic.
Emiliano Guevara. 2010. A regression model of adjective-noun compositionality in distributional semantics. InProceedings of the 2010 Workshop on GEometrical Models of Natural Language Semantics (GEMS 2010), pages 33–37.
Zellig Harris. 1954. Distributional structure. Word, 10(23):146–162.
Iris Hendrickx, Su Nam Kim, Zornitsa Kozareva, Preslav Nakov, Diarmuid ´O S´eaghdha, Sebastian Pad´o, Marco Pennacchiotti, Lorenza Romano, and Stan Szpakow-icz. 2010. Semeval-2010 task 8: Multi-way classifica-tion of semantic relaclassifica-tions between pairs of nominals. In Proceedings of the 5th International Workshop on Semantic Evaluation, pages 33–38, Uppsala, Sweden. Amac¸ Herda˘gdelen and Marco Baroni. 2009. Bagpack: A general framework to represent semantic relations. InProceedings of the EACL 2009 Geometrical Models for Natural Language Semantics (GEMS) Workshop, pages 33–40.
Nathalie Japkowicz and Shaju Stephen. 2002. The class imbalance problem: A systematic study. Intelligent Data Analysis, 6(5):429–449.
Task 2: Measuring degrees of relational similarity. InProceedings of the First Joint Conference on Lexi-cal and Computational Semantics (*SEM), pages 356– 364, Montr´eal, Canada.
Thomas K. Landauer and Susan T. Dumais. 1997. A solution to Plato’s problem: The latent seman-tic analysis theory of the acquisition, induction, and representation of knowledge. Psychological Review, 104(2):211–240.
Benoˆıt Lemaire and Guy Denhi`ere. 2006. Effects of high-order co-occurrences on word semantic similar-ity. Current Psychology Letters: Behaviour, Brain & Cognition, 18(1).
Yves Lepage and Ando Shin-ichi. 1996. Saussurian analogy: A theoretical account and its application. In Proceedings of the 16th International Conference on Computational Linguistics (COLING 1996), pages 717–722.
Kevin Lund, Curt Burgess, and Ruth Ann Atchley. 1995. Semantic and associative priming in high-dimensional semantic space. In Proceedings of the 17th Annual Conference of the Cognitive Science Society, pages 660–665.
Tomas Mikolov, Wen-tau Yih, and Geoffrey Zweig. 2013. Linguistic regularities in continuous space word representations. In Proceedings of the 2013 Confer-ence of the North American Chapter of the Associa-tion for ComputaAssocia-tional Linguistics: Human Language Technologies (NAACL 2013), Atlanta, Georgia. Jeff Mitchell and Mirella Lapata. 2008. Vector-based
models of semantic composition. In Proceedings of ACL-08: HLT, pages 236–244, Columbus, Ohio. Association for Computational Linguistics.
Jeff Mitchell and Mirella Lapata. 2010. Composition in distributional models of semantics.Cognitive Science, 34(8):1388–1429.
Ted Pedersen. 2012. Duluth: Measuring degrees of relational similarity with the gloss vector measure of semantic relatedness. In First Joint Conference on Lexical and Computational Semantics (*SEM), pages 497–501, Montreal, Canada.
John C. Platt. 1998. Fast training of support vector machines using sequential minimal optimization. In
Advances in Kernel Methods: Support Vector Learn-ing, pages 185–208, Cambridge, MA. MIT Press. Bryan Rink and Sanda Harabagiu. 2012. UTD:
Deter-mining relational similarity using lexical patterns. In
First Joint Conference on Lexical and Computational Semantics (*SEM), pages 413–418, Montreal, Canada. Bryan Rink and Sanda Harabagiu. 2013. The impact of selectional preference agreement on semantic rela-tional similarity. InProceedings of the 10th Interna-tional Conference on ComputaInterna-tional Semantics (IWCS 2013), Potsdam, Germany.
Richard Socher, Eric H. Huang, Jeffrey Pennington, Andrew Y. Ng, and Christopher D. Manning. 2011. Dynamic pooling and unfolding recursive autoen-coders for paraphrase detection. In Advances in Neural Information Processing Systems (NIPS 2011), pages 801–809.
Richard Socher, Brody Huval, Christopher Manning, and Andrew Ng. 2012. Semantic compositionality through recursive matrix-vector spaces. In Proceed-ings of the 2012 Joint Conference on Empirical Meth-ods in Natural Language Processing and Computa-tional Natural Language Learning (EMNLP-CoNLL 2012), pages 1201–1211.
Mireya Tovar, J. Alejandro Reyes, Azucena Montes, Darnes Vilari˜no, David Pinto, and Saul Le´on. 2012. BUAP: A first approximation to relational similar-ity measuring. In First Joint Conference on Lexi-cal and Computational Semantics (*SEM), pages 502– 505, Montreal, Canada.
Peter D. Turney and Michael L. Littman. 2005. Corpus-based learning of analogies and semantic relations.
Machine Learning, 60(1–3):251–278.
Peter D. Turney and Patrick Pantel. 2010. From fre-quency to meaning: Vector space models of semantics.
Journal of Artificial Intelligence Research, 37:141– 188.
Peter D. Turney, Michael L. Littman, Jeffrey Bigham, and Victor Shnayder. 2003. Combining independent mod-ules to solve multiple-choice synonym and analogy problems. In Proceedings of the International Con-ference on Recent Advances in Natural Language Pro-cessing (RANLP-03), pages 482–489, Borovets, Bul-garia.
Peter D. Turney, Yair Neuman, Dan Assaf, and Yohai Cohen. 2011. Literal and metaphorical sense identifi-cation through concrete and abstract context. In Pro-ceedings of the 2011 Conference on Empirical Meth-ods in Natural Language Processing, pages 680–690. Peter D. Turney. 2006a. Expressing implicit semantic
relations without supervision. InProceedings of the 21st International Conference on Computational Lin-guistics and 44th Annual Meeting of the Association for Computational Linguistics (Coling/ACL-06), pages 313–320, Sydney, Australia.
Peter D. Turney. 2006b. Similarity of semantic relations.
Computational Linguistics, 32(3):379–416.
Peter D. Turney. 2008a. The latent relation mapping engine: Algorithm and experiments. Journal of Artifi-cial Intelligence Research, 33:615–655.
Peter D. Turney. 2012. Domain and function: A dual-space model of semantic relations and compositions.
Journal of Artificial Intelligence Research, 44:533– 585.
Tony Veale. 2004. WordNet sits the SAT: A knowledge-based approach to lexical analogy. In Proceedings of the 16th European Conference on Artificial Intel-ligence (ECAI 2004), pages 606–612, Valencia, Spain. Ian H. Witten, Eibe Frank, and Mark A. Hall. 2011.Data Mining: Practical Machine Learning Tools and Tech-niques, Third Edition. Morgan Kaufmann, San Fran-cisco.