Published Online February 2008 in SciRes (http://www.SRPublishing.org/journal/ijcns/).
Abstract
Energy efficiency and enhanced backbone capacity is obtained by exploiting the geometric orientation of cooperative nodes in wireless sensor network. The cooperative communication in wireless sensor networks (WSN) gives us leverage to get the inherent advantages of its random node’s locations and the direction of the data flow. Depending on the channel conditions and the transmission distance, the number of cooperative nodes is selected, that participate in an energy efficient transmission/reception. Simulation results show that increasing the cooperative receive diversity, decreases the energy consumption per bit in cooperative communications. It has also been shown that the network backbone capacity can be increased by controlled displacement of antennas at base station at the expense of energy per bit.
Keywords: Cooperative Communication, Energy Efficiency, Capacity, Receive Diversity Sensor Network.
1. Introduction
Wireless sensor network consists of hundred or thousand of small, inexpensive wireless nodes responsible for monitoring a physical activity and reporting to the base station (BS), where end user can access the reported data. Cooperative communication has gain an obdurate place in wireless networks. It has been shown [1] that multiple-input multiple-output (MIMO) systems require less transmission energy than the single-input single-output systems. It’s still intricate to build multiple antennas on low-cost, small-sized sensor nodes; therefore MIMO techniques cannot be applied directly on wireless sensor networks. However it is possible to implement MIMO techniques in WSN without physically having multiple antennas at the sensor nodes via cooperative communication techniques [2][3], such distributed MIMO techniques can offer considerable energy saving even after allowing some extra circuit power, communication and training overheads.
The use of cooperative communications in wireless sensor networks allows for energy savings through spatial diversity gains [2]. Traditional MIMO utilizes fixed antenna arrays in transmitter/receiver. These arrays are of definite geometric shapes, e.g., one dimensional array, circular array, rectangular array etc, but in cooperative
MIMO communications there is no pre-defined array of antennas, the cooperative nodes cooperate with each other at run time to send/receive data.
There is already a lot of works related to cluster formation [4-7], capacity improvement [8] and energy efficient cooperative communication [2][3][9] in WSN, but little attention has been given to cooperative nodes selection on the basis of their location in clusters to improve the energy efficiency and reliability.
Most of the recent research work in wireless sensor networks, modeled the wireless channel with rich scattered or Rayleigh fading channel model [2][3][10], which is suitable channel model for wireless communications in urban areas where dense and large man made buildings act as rich scatterers. Sensor networks are usually deployed in the areas far away from human population, e.g., in plain desert areas for surveillance, on volcano hills for early alerts and near sea-shore for storm alerts etc. In all these situations, Ricean fading channel model works well, because it contains both non line-of-sight (NLOS) and line-of-sight (LOS) components.
In this paper, we have divided the WSN into two functional model parts, i) whole sensor network except the backbone link is modeled with Ricean fading channel and ii) the backbone link (the link between base station and the
Exploiting Geometric Advantages of Cooperative
Communications for Energy Efficient Wireless
Sensor Networks
Irfan AHMED1, Mugen PENG2, Wenbo WANG2
Wireless Signal Processing and Network Lab
cooperative nodes near the base station) is modeled by pure deterministic channel.
Remainder of this paper is organized as follows. System model is presented in section 2. Section 3 exploits the inherent advantages of wireless sensor network. Performance analysis in terms of energy efficiency and capacity of sensor network is presented in section 4. We show simulation results in Section 5, and conclude in Section 6.
2. System Model
The system model shown in figure 1, it consists of a cluster based sensor network. Sensor nodes are grouped for cooperative communications. The selection of group nodes is described in next section. In typical wireless sensor network scenarios as narrated above, large number of nodes are randomly deployed in an unattended area. Due to the presence of scatterers as well as line-of-sight component in those areas, Ricean fading channel model has been used to modeled the WSN, Ricean fading channel has both LOS and NLOS components [1]
(
)
(
)
/ 1 1/ 1
H= K +K H+ +K Hw (1)
[image:2.595.69.287.425.613.2]where K/ 1( +K)H is LOS or deterministic component of the channel, 1/ 1( +K)Hw is NLOS or scattered component
Figure 1. System Model
of the channel and K is the Ricean factor, it is the ratio of
the LOS power to the scattered power. K=0 in the
presence of rich scattered or pure Rayleigh fading, and
K→ ∞ in case of non-fading channel.
We restrict our analysis to the case of frequency-flat
fading. The elements of Hw are zero-mean circularly
symmetric complex Gaussian (ZMCSCG) random variable with unit variance [1]. We have assumed binary phase shift keying (BPSK) modulation with Alamouti scheme [11] for cooperative MIMO communications. We
have furthermore assumed that the channel is unknown to the transmit nodes and is perfectly known to the nodes at receive side.
3. Advantages of Cooperative
Communications in WSN
3.1. Exploiting the WSN Architecture
1) WSN is deployed with hundred or thousand of
structural or randomly placed nodes making it ideal for cooperative communications. Selections of nodes in a cooperative group which are approximately at same distance from the intended receive nodes, results in equal energy consumption per bit in cooperative communications.
2) By selecting closest nodes within a cooperative
group, we can decrease energy consumption per bit in intra-cooperative node communications.
3) In WSN the data flow direction is from sensor
network to BS i.e., most of the time BS act as a receiver (neglecting small amount of signaling data from BS to network). By increasing the number of antennas at BS, we can take advantages of receive diversity at BS, because BS has no energy constraint.
4) Usually the base station is located at some height in order to get reliable communication with the network, which results in a dominant LOS component. By exploiting this LOS communications we try to get maximum capacity in this backbone link.
3.2. Selection of Cooperative Nodes in a Network
Cooperative communications in WSN can be more beneficial if transmit cooperative nodes are at equal distance from the intended receive nodes. This strategy evenly distributes the transmission energy in LOS component because in LOS component the power loss is inversely proportional to the square of the distance between the transmitter and receiver. In addition to this the cooperative nodes should be at minimum distance from each other to save energy in local communication within the cooperative nodes group. These measures reduce the required bit energy for desired BER. How these measures can be taken?
3.2.1. Algorithm
After the cluster formation [5] and selection of cluster-heads in each cluster, following steps ensure the energy efficient selection of cooperative nodes:
Step II: Each node χ
( )
i measures receive signal strength, calculated iχ( )
and send back an ACK beaconsignal to BS, where d iχ
( )
is the distance betweennodeχ
( )
i and BS.Step III: Upon receiving the ACK beacons from all nodes, BS calculates their distances from itselfdBS
( )
i .Final estimate dχ_BS
( )
i is obtained by averaging( )
d iχ and dBS
( )
i .Please note that d i
( )
is not an actual physical distance, it is equal-power-distance.Step IV: Based on these estimates BS allocates an equal-power group identity to those nodes which lies within a certain range min
(
dχ_BS( )
i)
+ℵ∆Ξ, where ℵisan integer and ∆Ξ is small distance depends upon
( )
(
_)
min dχ BS i and max
(
dχ_BS( )
i)
.Step V: Each node in equal-power group P multicasts a RSSI beacon signal within its group. It will know its distance from other nodes in the group with the help of ACK receives.
Finally the cooperative communications group ,
C C⊆ P
. Nodes selection preference order in Cis
Proximity > Residual node energy
Node within a cooperative communication group with highest residual energy becomes the cooperative-group-head, it responsible for data aggregation and the communication within the cooperative group.
In the same way cooperative-group-head plays the role of BS for neighbor clusters and follows from Step I to V.
4. Performance Analysis
4.1. Network Performance in Ricean Fading Channel
We have modeled the sensor network with Ricean fading channel model. In the particular arrangement of cooperative nodes shown in figure 1, where all nodes (antennas) are at same distance from the intended receivers, we use following equation [2] for total energy required per bit per hop,
(
)
(
)
2 _ _0 2
4
1 tx elect rx elect
bit l f T R
b b
t r
P P
d
E N M N n n
R R
G G
π α ρ
λ
= + + + (2)
whereα is depends upon the drain efficiency of power
amplifier in transmitter circuitry, ρ is the signal power
(from nT transmit nodes) to noise ratio at each of the
receive node, N0 is AWGN power spectral density, dis the distance between transmitter and receiver, λ is the carrier wavelength, G Gt, r are antenna gains of transmitter
and receiver respectively, Ml is the link margin
compensating hardware process variations and other noise or interference, Nf is the receiver noise figure, Rb is
transmission rate and Ptx elect_ ,Prx elect_ are power dissipated
in transmitter and receiver circuits, respectively. The system parameters related to above equation are taken from [2, Table I], and the power consumption values of transmitter and receiver circuits ( Ptx elect_ =38mW,
_
rx elect
P =41mW) are of TelosB mote1 [12]. Expression for BER as a function of SNR in Ricean fading channel is given as [1]
2 2 min
2 min 4
1 4 2
min 1
1 / 4
HF
T T R T R
T
d K n n n n n d
K n b
T
K
P e
K d n
ρ
ρ
ρ
⎛ ⎞
⎜ ⎟
⎜ ⎟
− × ⎜ ⎟
× ⎜ ⎟
+ +
⎜ ⎟
⎝ ⎠
⎛ + ⎞
≤ ⎜ + + ⎟
⎝ ⎠ (3)
where dmin is the minimum distance of separation of
underlying scalar constellation and HF is the Frobenius
norm of channel matrix H. Using upper bound in above
expression, we obtain table I, which has been used for evaluation of energy per bit in equation (2).
4.1.1. Discussion
From equation (2) and (3), we can see that the transmission energy per bit for a desired BER is functions of the number of transmit/receive nodes, underlying constellation size and the channel condition. Table I
shows the values of ρ for different combinations of
transmit and receive nodes at 103
b
P = − . It can be seen that
required SNR at receiver nodes decreases with increasing number of cooperative nodes for a fixed BER.
4.2. Backbone Link Performance in Deterministic or LOS Channel
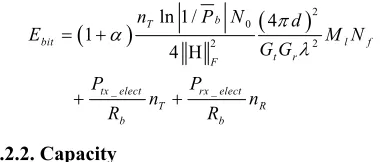
4.2.1. Energy Consumption
The backbone link is modeled by LOS channel, for which the total energy required per bit is given by equation (2). The SNR (ρ) per receive node in equation (2) is given as [1, equation 5.60]
(
2)
exp 4 H /
b F T
P = − ρ n (4)
then the equation (2) becomes
1 With very low power TelosB mote and power loss exponent of two,
(
)
0(
)
2 2
_ _
ln 1/ 4
1
4 H
b T
bit l f
t r F
tx elect rx elect
T R
b b
n P N d
E M N
G G
P P
n n
R R
π α
λ
= +
+ +
(5)
4.2.2. Capacity
The instantaneous capacity (in bps/Hz) for
n
T transmitand
n
R receive cooperative nodes under an averagetransmit power constraint is given by [1]
2
log det IR HHH n
T C
n
ρ
⎡ ⎛ ⎞⎤
= ⎢ ⎜ + ⎟⎥
⎢ ⎝ ⎠⎥
⎣ ⎦ (6)
where InRis nR×nR identity matrix, His nR×nT channel matrix and HH is the Hermitian transpose of H.
For LOS propagation, and a narrow-band channel at
fixed carrier frequency
f
c=
c
/
λ
, ray tracing fromtransmitter to receiver gives following channel matrix H
with complex scalar entries
(
, ,)
, ,
exp 2 node j node k / jk
node j node k
j T R
H
T R
π λ
− −
=
− (7)
where Tnode j, −Rnode k, is the distance between
j
thtransmit node and kth receive node.
Let nR =nT =n be the number of nodes participating
in cooperative communication on either side. With
, r t
d d d in figure 2, the path lengths between any pair
of transmit and receive nodes are approximately the same to within the array size i.e.,d≈ Tnode j, −Rnode k, , and the
complex scalars Hjk all have same magnitude but
different phases θjk . Mathematical example of this
particular type of normalized His given as [13]
( )
exp
jk jk
H = jθ (8)
where jk
(
i i0) (
k k0)
2n
π
θ = ⎡⎣ − − − ⎤⎦ , i k0, 0 are arbitrary
integers.
Consider the case of n=2and i k0, 0 =0, the small path length difference
,1 ,1 ,1 ,2 / 4
node node node node
T R T R
δ = − − − =λ (9)
guaranteed that the channel matrix is orthogonal and of full rank, 2 in this case. Practically this can be realized by the slight movement of antennas at base station. Since base station is mostly act as a receiver in the wireless sensor network, positioning of antennas based on received RSSI
at base station can be easily achieved.
With these values orthogonal channel matrix become 1
1 Horthognal
j j
⎛ ⎞
= ⎜ ⎟
⎝ ⎠ (10) and the capacity from equation (6)
[
]
2
log 1
C=n +ρ (11)
Advantage of cooperative MIMO in terms of capacity can be obtained if the channel matrix H is orthogonal. 4.2.3. Discussion
Interestingly, from equation (5) we see that the distance dependant part of above equation is inversely proportional to the square of Frobenius norm of channel matrix, and, it linearly dependent on the number of transmit nodes. Therefore the receive diversity techniques provide more energy efficient communication.
In clear LOS environment, capacity of wireless channel depends upon the rank of channel matrixHas depicted by equation (6). Capacity becomes maximum, when the channel matrix is of full rank (or orthogonal).
5. Simulation Results
We determine the impact of the selection of cooperative nodes and the physical orientation of antennas of BS on the total energy required per bit transmission in WSN and the capacity of the backbone link. The simulations are
performed using MATLAB® by The MathWorks.
Figure 3 shows an amount of extra energy consumption per bit compared to our selection algorithm. The transmission distance ratio along x-axis is the ratio of the distance of intra cooperative group nodes without our node selection algorithm and with our algorithm. Since intra cooperative group communication is non-cooperative 1 to 1 communication, therefore more energy consumption per bit is observed in the case of severe fading, K=1, it rises with square of the distance and consumes 33% more energy when the nodes separation is 3.5 time to that of closest nodes of our algorithm. With increasing values of K
(i.e., less fading) the slope of extra energy consumption decreases. Therefore in fading channels our algorithm saves a sufficient amount of energy.
In figure 4 we have total energy consumption per bit as a function of long-hual distance in a rich scattering environment i.e., K=1. Among different combinations of transmit and receive cooperative nodes, the largest receive diversity combination (nT =1,nR =4) gives lower energy
[image:4.595.62.257.81.162.2]consumption per bit in a wide range of transmission distance (from 60m to onwards).
less severe fading environment, K=2.
When the deterministic or LOS component is dominant
K=10, (i.e., the channel is more close to AWGN channel) as shown in figure 6 the lowest energy consumption per bit is given by the case when there is one transmit node and two receive cooperative nodes, it remains with lowest energy per bit up to the transmission range of 100m., after that ( nT =1,nR =4 ) combination becomes the lowest
energy. This confirms the effectiveness of large receive diversity in long haul transmissions because at large distances the 1st term (which depends upon d, n
T, andnR) in
equation (2) becomes more dominant than 2nd and 3rd
terms.
[image:5.595.340.518.382.485.2]In pure deterministic or LOS communications with BS, we have neglected the receive circuit energy consumption in the BS, because BS has no energy constraint. Figure 7, shows that the receive diversity case (nT =1,nR =4 ) renders the least energy consumption per bit in the entire transmission range. Due to the LOS BS antennas orientation the energy consumption per bit is smallest among all other Ricean cases. But the cost we have given for this, is the degradation in spectral efficiency (bps/Hz). Figure 8 shows a comparison of LOS orthogonal channel capacity (nT =2,nR =2) with (nT =1,nR =4). We can see that there is a trade off between energy consumed per bit and the capacity. In most of the cases capacity is not the main issue, and we are more concerned about the energy consumption.
Finally, figure 9 shows how cooperative energy
consumption depends on the constellation size b for
various cooperative MIMO schemes. It is clear from Figure 9 that there is an optimal constellation size for each cooperative MIMO scheme for which the total transmission energy per bit is minimized. It again strengthens our argument that receive diversity give more energy efficient cooperative communication. We have used following approx. expression to obtain relation between BER and SER in (3) for K=1,
2
, 2
log
b M
b
P
P M
M
[image:5.595.320.514.530.701.2]≈ = (12)
Table 1.
6. Conclusion
Geometric orientation based selection of cooperative nodes and the specific placement of antennas at BS, greatly impact the total transmission energy consumption per bit and the capacity of the backbone link. Simulation results show that, using the geometric advantages in selecting the cooperative nodes, we come across an energy efficient transmission for different transmission ranges. Since the sensor network is data centric and most of the time there is unidirectional data flow (from network to BS), therefore cooperative communication with minimum number of transmit nodes and maximum optimal number of receive nodes result in low energy per bit transmission. An optimal constellation size for various cooperative schemes also reveals that receive cooperative diversity is near optimal. A trade off exists between energy consumption per bit and the capacity. Since sensor networks are usually a low data rate networks, therefore we usually opt low energy cooperative communication.
7. Acknowledgement
This work was supported by National advanced technologies researching and developing programs. (China 863 programming, NO.: 2006AA01Z257).
Figure 2. nT transmit and nR receive cooperative nodes LOS channel model
1 1.5 2 2.5 3 3.5 4
3 3.1 3.2 3.3 3.4 3.5 3.6 3.7 3.8 3.9
4x 10
-7
Transmission distance ratio
E
xt
ra ene
rg
y c
ons
um
pt
io
n pe
r bi
t
(J
)
Extra Energy Consumption compared to our Algorithm
[image:5.595.56.291.579.724.2]K=1 K=2 K=10 K->infinity
Figure 3. Energy consumption as compared to our algorithm
3
10
b
P = −
ρ
2, 1
T
R n n
= =
1, 2
T
R n n
= =
2, 2
T
R n n
= =
1, 4
T
R n n
= =
2, 4
T
R n n
= =
K=1 16.6 13.6 8.8 5.8 4
K=2 14.7 11.7 7.9 4.9 3.5
20 30 40 50 60 70 80 90 100 110 120 0 0.5 1 1.5 2 2.5 3 3.5
4x 10
Trasmission distance (meters)
[image:6.595.69.278.76.256.2]T ot al ene rg y c ons um pt ion per bi t (J ) nT=2,nR=1 nT=1,nR=2 nT=2,nR=2 nT=1,nR=4 nT=2,nR=4
Figure 4. Total energy per bit in Rayleigh fading, K=1
20 40 60 80 100 120 140 160
0 0.5 1 1.5 2 2.5 3 3.5
4x 10 -6
Trasmission distance (meters)
T ot al ener gy c on sum pt ion per bi t ( J)
Network in less scaterring environment, K=2
[image:6.595.316.522.81.256.2]nT=2,nR=1 nT=1,nR=2 nT=2,nR=2 nT=1,nR=4 nT=2,nR=4
Figure 5. Total energy per bit with K=2
20 40 60 80 100 120 140 160
0.5 1 1.5 2 2.5
3x 10 -6
Trasmission distance (meters)
T ot al ener gy c ons um pt ion per bit ( J)
Network with dominant LOS environment, K=10
nT=2,nR=1 nT=1,nR=2 nT=2,nR=2 nT=1,nR=4 nT=2,nR=4
Figure 6. Total energy per bit with K=10
20 40 60 80 100 120 140 160 1.5 2 2.5 3 3.5 4 4.5 5 5.5 6
Transmission distance (meters)
[image:6.595.69.281.306.489.2]T ran sm is si on e ner gy per bi t ( J) nT=1,nR=1 nT=1,nR=2 nT=2,nR=2 nT=1,nR=4
Figure 7. Total energy consumption in backbone link
-2 0 2 4 6 8 10 12
1 1.5 2 2.5 3 3.5 4 4.5 5 5.5 6 SNR (dB) Capa ci ty ( bps /H z)
Backbone Link Capacity
[image:6.595.316.525.310.488.2]nT=1,nR=4 nT=nR=2
Figure 8. Capacity of backbone link Vs SNR
1 1.5 2 2.5 3 3.5 4 4.5 5 5.5 6 0 0.2 0.4 0.6 0.8 1 1.2 1.4 1.6 1.8
2x 10 -5
Constellation size b
T ot al t rans m is si on en er gy pe r bi t i n J Cooperative MIMO 1x2 2x1 3x1 3x2 3x3 1x3 2x3
[image:6.595.69.280.541.726.2] [image:6.595.316.535.542.721.2]8. References
[1] A. Paulraj, R. Nabar, and D. Gore, Introduction to
Space-Time Wireless Communications, Cambridge Univ. Press, 2003.
[2] C. Shuguang and A. Goldsmith, “Energy-efficiency
of MIMO and cooperative MIMO techniques in sensor networks,” IEEE J. Select. Areas in Comm., vol. 22, no. 6, pp. 1089–1098, Aug.2004.
[3] Wenyu Liu Xiaohua Li Mo Chen, “Energy efficiency
of MIMO transmissions in wireless sensor networks with diversity and multiplexing gains,” Acoustics, Speech, and Signal Processing, 2005. Proc. (ICASSP’05). IEEE International Conference, Vol.: 4, On page(s): iv/897- iv/900 Vol. 4 March 2005
[4] Wenfeng Li; Weike Chen; Xinzhu Ming, “A
Local-centralized Adaptive Clustering Algorithm for Wireless Sensor Networks,” Proc. -15th Int’l Conf. on Computer Comm. and Networks, Oct. 2006 Page(s):149 – 154
[5] SangHak Lee; JuneJae Yoo; TaeChoong Chung;
“Distance based energy efficient clustering for
wireless sensor networks,” 29th Annual IEEE
International Conference on Local Computer Networks, 2004, 16-18 Nov. 2004 Page(s):567 – 568
[6] O. Younis and S. Fahmy, “Distributed Clustering in
Adhoc Sensor Networks: A Hybrid, Energy-Efficient Approach”, IEEE INFOCOM 2004, Mar. 2004.
[7] Y. Xu, J. Heidemann, and D. Estrin,
“Geography-Informed Energy Conservation for Ad Hoc Routing,” MOBICOM 2000, Rome, Italy, July 2001, pp. 70-84.
[8] Sankaranarayanan, L.; Kramer, G.; Mandayam, N.B.;
“Hierarchical sensor networks: capacity bounds and
cooperative strategies using the multiple-access relay channel model,” First Annual IEEE Comm. Society Conference on Sensor and Ad Hoc Comm. and Networks 2004.
[9] J. N. Laneman, D. N. C. Tse, and G. W. Wornell,
“Cooperative diversity in wireless networks: Efficient protocols and outage behavior,” IEEE Trans. on Information Theory, vol. 22, no. 12, pp. 3062–3080, Dec 2004.
[10] Yong Yuan, Min Chen, Tackyong, “A Novel
Cluster-based Cooperative MIMO Scheme for Multihop Wireless Sensor Networks”, EURASIP Journal on Wireless and Networking, Vol 2006, Article ID 72493, page 1-9.
[11] S. Alamouti, “A simple transmit diversity technique for wireless communications,” IEEE J. Select. Areas Commun., vol. 16, pp. 1451–1458, Oct. 1998. [12] Joseph Polastre, Robert Szewczyk, and David Culler,
“Telos: Enabling Ultra-Low Power Wireless Research,” Proceedings of the 4th Int’l symposium on Information processing in sensor networks, Los Angeles, California, Apr.2005
[13] P.F. Driessen, G.J. Foschini, “On the capacity of
multiple- input multiple-output wireless channels: a geometric interpretation,” IEEE Trans. Commun., vol. 47, No.2, pp.173-176, Feb. 1999.
[14] S. K. Jayaweera, “Virtual MIMO-based cooperative