warwick.ac.uk/lib-publications
Original citation:
Wei, Xiaojun and Živanović, Stana (2018) Frequency response function-based explicit framework for dynamic identification in human-structure systems. Journal of Sound and Vibration, 422 . pp. 453-470. doi:10.1016/j.jsv.2018.02.015
Permanent WRAP URL:
http://wrap.warwick.ac.uk/100474
Copyright and reuse:
The Warwick Research Archive Portal (WRAP) makes this work by researchers of the University of Warwick available open access under the following conditions. Copyright © and all moral rights to the version of the paper presented here belong to the individual author(s) and/or other copyright owners. To the extent reasonable and practicable the material made available in WRAP has been checked for eligibility before being made available.
Copies of full items can be used for personal research or study, educational, or not-for-profit purposes without prior permission or charge. Provided that the authors, title and full bibliographic details are credited, a hyperlink and/or URL is given for the original metadata page and the content is not changed in any way.
Publisher’s statement:
© 2018, Elsevier. Licensed under the Creative Commons Attribution-NonCommercial-NoDerivatives 4.0 International http://creativecommons.org/licenses/by-nc-nd/4.0/
A note on versions:
The version presented here may differ from the published version or, version of record, if you wish to cite this item you are advised to consult the publisher’s version. Please see the ‘permanent WRAP url’ above for details on accessing the published version and note that access may require a subscription.
1
Frequency response function‐based explicit framework for dynamic
1
identification in human‐structure systems
2 3
Xiaojun Wei*, Stana Živanović
4
School of Engineering, University of Warwick, CV4 7AL, UK 5
*Corresponding author 6
E-mail address: [email protected]; [email protected] 7
8
Abstract 9
The aim of this paper is to propose a novel theoretical framework for dynamic identification 10
in a structure occupied by a single human. The framework enables the prediction of the 11
dynamics of the human-structure system from the known properties of the individual system 12
components, the identification of human body dynamics from the known dynamics of the 13
empty structure and the human-structure system and the identification of the properties of the 14
structure from the known dynamics of the human and the human-structure system. The 15
novelty of the proposed framework is the provision of closed-form solutions in terms of 16
frequency response functions obtained by curve fitting measured data. The advantages of the 17
framework over existing methods are that there is neither need for nonlinear optimisation nor 18
need for spatial/modal models of the empty structure and the human-structure system. In 19
addition, the second-order perturbation method is employed to quantify the effect of 20
uncertainties in human body dynamics on the dynamic identification of the empty structure 21
and the human-structure system. The explicit formulation makes the method computationally 22
efficient and straightforward to use. A series of numerical examples and experiments are 23
2
Keywords: Human-structure interaction; system identification; human body dynamics; 25
explicit framework; frequency response function. 26
1. Introduction
27
Dynamic interaction between a human and a low-frequency structure supporting the human is 28
a well-recognised phenomenon that has become increasingly prominent over the last two 29
decades due to the increase in slenderness of modern structures [1-4]. Naturally, the dynamic 30
properties of the human-structure system are influenced by the interplay of dynamics of the 31
two subsystems and they differ from those of the structure itself [1-7]. When considering the 32
vertical flexural vibration modes of a structure, the human occupancy is known to cause a 33
shift in the natural frequency and an increase in the damping ratio [3, 8-10]. Knowledge of 34
the dynamic properties of both the occupant(s) and the structure is crucial for developing 35
better understanding of the extent of the human-structure interaction and its influence on the 36
dynamic response analysis and vibration control design for structures accommodating 37
humans. 38
In structural engineering applications, the dynamics of a human are usually described using a 39
single-degree-of-freedom (SDOF) mass-spring-damper model [3, 6, 9-14]. The dynamics of a 40
structure are often described utilising a spatial model or a modal model (having, say,
n
DOFs) 41that can be established using either finite element method or modal analysis [15]. The human-42
structure system can then be represented by a n1 DOFs model whose modal properties are
43
determined from an eigenvalue analysis, either numerically or analytically [9, 15, 16]. 44
Key challenge in studying human-structure systems is the identification of the properties of 45
the human model. Several approaches have been proposed for this purpose. For example, 46
3
or sitting posture by curve fitting measured driving-point apparent masses. On the other hand, 48
Foschi et al. [19] estimated the frequency and damping ratio of a human in a standing posture 49
by minimising differences between the computed and measured displacement responses of 50
the human-floor system exposed to a heel-drop impact. Zheng and Brownjohn [6] measured 51
frequency response functions (FRFs) of both the empty structure and the human-structure 52
system. After identifying a SDOF modal model for a vibration mode of interest from the 53
measured FRFs of the empty structure, they combined this model with assumed properties of 54
the human to derive the eigenvalues of the human-structure system. They used a nonlinear 55
optimisation method to identify the properties of the human that result in the best match 56
between the eigenvalues of the human-structure system and the measured counterparts. This 57
procedure was also employed by Shahabpoor et al. [13] to identify a SDOF model for a 58
walking human. Sachse [2] used a similar procedure for identifying the human’s dynamic 59
properties, the only difference being that she compared the measured and calculated FRFs of 60
the human-structure system rather than the eigenvalues. This method was also used by Van 61
Nimmen et al. [14] to identify a SDOF model for a stationary crowd. Jones et al. [20] 62
summarised the dynamic properties of the human in a standing posture reported in the 63
literature. The properties vary significantly between individuals: natural frequency was in the 64
range from 3.3 Hz to 10.4 Hz while damping ratio was between 33% and 69%. Human body 65
dynamics are also found to vary with postures [14, 18, 21]. 66
Most research is devoted to identifying the dynamics of the human body and predicting the 67
dynamics of human-structure systems. These studies were performed with a sole purpose in 68
mind: to develop dynamic models of humans, either standing or sitting, and then to add them 69
to the dynamic model of an empty structure, usually a grandstand, to predict the dynamic 70
response of the human-structure system in sports or music events [10, 20, 22]. Little attention 71
4
the human-structure system are known. This scenario is relevant in manually operated impact 73
hammer modal testing in which a hammer operator is present on the structure during data 74
collection. The identification of dynamic properties of the structure routinely neglects the 75
presence of the hammer operator and it assumes that the dynamics of the empty structure are 76
the same as those of the hammer operator-structure system. This assumption might be 77
erroneous since the interaction between a single human and a structure is important in some 78
cases, such as for ultra-lightweight fibre reinforced polymer (FRP) footbridges. Although 79
some existing methods for identifying human body dynamics [2, 6, 13, 14] can also be used, 80
at least in some cases, for the dynamic identification of the empty structure, they are not 81
necessarily convenient to apply. 82
To the best knowledge of the authors, there does not exist a single theoretical framework 83
which offers both closed-form solutions and flexibility of being used for any of the three 84
applications as and when needed, i.e. the prediction of the dynamics of the human-structure 85
system when the dynamics of individual systems are known, the identification of human body 86
dynamics when the empty structure and human-structure system dynamics are known and the 87
identification of the empty structure when the human and human-structure dynamics are 88
known. This paper proposes a unifying and simple to implement framework for determining 89
the dynamics of any one of the three systems in terms of the dynamics of the other two. The 90
framework provides closed-form solutions for identifying the dynamics of the system under 91
study and therefore does not require utilisation of nonlinear optimisation techniques inherent 92
to some other studies [2, 6, 13, 14]. The framework utilises curve-fitted FRFs (i.e. 93
receptances, mobilities or accelerances) directly as opposed to using FRFs to derive spatial or 94
modal models of the empty structure and the human-structure system required in some other 95
studies [2, 6, 13, 14]. In addition, the second-order perturbation method is utilised to quantify 96
5
empty structure and the human-structure system. The paper focuses on low-frequency 98
structures (i.e. vibration modes with natural frequencies up to about 8Hz) on which the 99
human-structure interaction is expected to be strongest. In this frequency region, the human is 100
modelled as a SDOF system since only their first vibration mode is likely to interact with the 101
structure. The proposed method is applicable for problems involving humans in any 102
stationary posture (e.g. standing, sitting and crouching to perform the impact hammer test). 103
Future work will be dedicated to generalise the framework for the crowd-structure interaction. 104
Following this introductory section, Section 2 introduces the novel method in the context of 105
identifying properties of a human-structure system. Use of the proposed method for 106
identifying human body dynamics is presented in Section 3, whilst its use for estimating 107
dynamics of the empty structure is presented in Section 4. Each section is supported by 108
numerical examples and/or experiments. Conclusions are drawn in Section 5. 109
2. Identification of the dynamics of a human-structure system
110
This section presents the theoretical framework followed by a numerical example. The 111
proposed framework was inspired by the studies in the research fields of vibration control 112
[23-25] and nonlinear dynamics [26]. 113
2.1. Theoretical framework
114
The equation of forced vibration of a linear structure having
n
DOFs may be cast in second 115order form as 116
s s s s s s s
M x&& C x& K x f (1)
117
6
11 1 1 1
1 1 1 1 1
1 1
s s s
n n
s s s
s
n n n n n
s s s
n n n nn
m m m
m m m
m m m
L
M O M M
L L M ,
11 1 1 1
1 1 1 1 1
1 1
s s s
n n
s s s
s
n n n n n
s s s
n n n nn
c c c
c c c
c c c
L
M O M M
L L C , 119
11 1 1 1
1 1 1 1 1
1 1
s s s
n n
s s s
s
n n n n n
s s s
n n n nn
k k k
k k k
k k k
K L
M O M M
L L , 1 1 s s s n s n x x x M
x ,
1 1 s s s n s n f f f M f . 120 s
M , Cs and Ks n n
R
are the mass, damping and stiffness matrices.fs,xs, x&s, &x&s
1
n
R
are 121
the external force, displacement, velocity and acceleration vectors, respectively. Rdenotes
122
the field of real numbers. Dot denotes the derivative with respect to time. 123
Eq. (1) may be written in Laplace domain as 124
s s s s s s
Z x% f% (2)
125
where
2
s s ss ss s
Z M C K ,
s
is the Laplace variable, whilst x%s
s and f%s
s are the126
Laplace transforms of displacement and force vectors. 127
When a stationary human occupies a structure, the structure and the human form a new joint 128
system whose dynamics are influenced by the dynamics of the two individual components. In 129
line with the previous research, the human is modelled as a SDOF system having mass mh, 130
damping ch and stiffness kh. mh is assumed to represent the full mass of the human, as 131
7
assumed that the human is located at the n-th degree of freedom of the structure. Therefore,
133
the forced-vibration of the human-structure system can be described by 134
sh sh sh sh sh sh sh
M x&& C x& K x f (3)
135 where 136
11 1 1 1
1 1 1 1 1
1 1
0
0 0
0 0 0
s s s
n n
s s s
n n n n n
sh
s s s
n n n nn
h
m m m
m m m
m m m
m L
M O M M M
L L L M ,
11 1 1 1
1 1 1 1 1
1 1
0
0
0 0
s s s
n n
s s s
n n n n n
sh
s s s
n n n nn h h
h h
c c c
c c c
c c c c c
c c L
M O M M M
L L L C , 137
11 1 1 1
1 1 1 1 1
1 1
0
0
0 0
s s s
n n
s s s
n n n n n
sh
s s s
n n n nn h h
h h
k k k
k k k
k k k k k
k k K L
M O M M M
L L L , 1 1 s s sh n s n h x x x x M
x ,
1 1 0 s s sh n s n f f f M f . 138
Eq. (3) may be expressed in Laplace domain as 139
sh s sh s sh s
Z x% f% (4)
140
8
21 1 1 1 1 1
1 1 1 2 1 1 1 1 T 2 1 T .
sh sh sh sh
n n n n
s n n n
h h h h
n
n h
h h h h
n
s n n n
n h
sm
s s s
s
c s k c s k
m s
c s k c s k
s
s s
m s
s s s
Z M C K
0 0 0
Z 0 0 0 0 Z 0 u u 0
Z u u
142
In this expression,
T 1
0 0
n
h h h h
s c s k c s k
u 64 7 48L ,
Tis the transpose of
. 143For the sake of clarity, dimensions of some matrices are stated in the equation. 144
The receptance matrix of the human-structure system is 145
1
T
1sh s sh s sm s s s
H Z Z u u . (5)
146
Let us denote 147
1
11 2 1 s n sm sm n h s s s m s H 0 H Z
0 (6)
148
where Hs
s Zs1
s is the receptance matrix of the empty structure. 149According to the Sherman-Morrison formula [31], the receptance matrix of the human-150
structure system can be re-written as 151
1
T
T
sm sm
sh sm
sm
s s s s
s s
s s s
H u u H
H H
u H u . (7)
9
Therefore, the receptance matrix of the human-structure system can be obtained using the 153
receptance matrix of the empty structure and the mass, damping and stiffness properties of 154
the human. 155
The pn-th
p n
receptance of the human-structure system may be obtained by pre-156multiplying and post-multiplying Eq. (7) by eTp and en, respectively,
157
T
T
T
T1
p sm sm n
sh
pn p sm n
sm
s s s s
h s s
s s s
e H u u H e
e H e
u H u (8)
158
where eiTis a vector of dimension
n 1 1
, whose i-thentry is unity and the other entries are159
zero. 160
Due to 161
T s
p sm s nhpn s
e H e (9)
162
T s
p sm s s c s k hh h pn s
e H u (10)
163
T s
sm n h h nn
s s c s k h s
u H e (11)
164
and 165
T2 1 s
sm h h nn
h
s s s c s k h s
m s
u H u (12)
10 where s
nn
h s is the direct receptance at then-th DOF and hspn
s is the cross receptance167
between the -thp output and then-thinput, both related to the empty structure, Eq. (8) now
168
becomes 169
21 1
s s
h h pn nn
sh s
pn pn
s
h h nn
h
c s k h s h s
h s h s
c s k h s
m s
(13) 170
which indicates that the pn-th cross receptance of the human-structure system may be 171
calculated using the s
nnh s and s
pnh s of the empty structure and the dynamic properties of 172
the human. 173
Ifpn, then
174
21 1
s s
h h nn nn
sh s
nn nn
s
h h nn
h
c s k h s h s
h s h s
c s k h s
m s
(14) 175
which indicates that the direct receptance of the human-structure system could be calculated 176
using s
nnh s of the empty structure and the dynamic properties of the human. 177
The denominator of Eqs. (13) or (14) generates the characteristic equation 178
21
1 s 0
h h nn
h
c s k h s
m s
(15)
179
from which the eigenvalues (and therefore natural frequencies and damping ratios) of the 180
11
2.2. Effect of uncertainties in human properties on predicting the dynamics of the
182
human-structure system
183
The dynamic properties of the human body may vary due to small postural changes and/or 184
changes in vibration response level. These variations inevitably affect the dynamic prediction 185
of the human-structure system. The second-order perturbation method [32] could be used to 186
estimate the effect of the uncertainties. The perturbation method is based on the Taylor series 187
expansion of the system response around the mean value of the input parameters and it is 188
used to compute the expectations and moments of the output parameters. 189
Here, the small variations in the stiffness and damping of the human body are considered. No 190
variation in the mass is considered since the mass can be measured accurately. It is assumed 191
that the stiffness and damping of the human body are independent normal random variables. 192
The expectation and standard deviation of the stiffness are h
k
E and
h
k
, respectively, while 193
for the damping these are h
c
E and
h
c
. 194
The magnitude and phase of the pn-threceptance of the joint system may be expressed as 195
2
2Re Im
sh sh sh
pn pn pn
h s h s h s (16)
196
and 197
Im arctan
Re sh pn sh
pn sh
pn
h s
h s
h s
12
where
g is the magnitude of
g ;
g is the phase of
g ; and Re g and
Im g are the
199real and imaginary parts of
g . Eq. (13) infers that the magnitude and phase are functions of 200the damping and stiffness of the human body. The expectation and standard deviation of the 201
magnitude can be expressed as Eqs. (18) and (19) using the second-order perturbation method 202
[32]. 203
2
2 2
22 2
1 2
h ch h ch h ch
h kh h kh h h kh h
sh sh
pn pn
c E c E c E
sh sh
pn pn k E k E c k E k
h h
h s h s
E h s h s
c k
(18) 204
and 205
h ch 2 2
h ch 2 2h kh h h kh h
sh sh
pn c E pn c E
sh
pn k E c k E k
h h
h s h s
h s
c k
(19) 206
where E
g is the expectation of
g ;
g is the standard deviation of
g ;
sh pn
h s
z
and 207
22
sh pn
h s
z
are the first and second-order partial derivatives of
sh pn
h s with respect to z,
208
zch orkh
, respectively.209
Similarly, the expectation and standard deviation of the phase can be expressed as, 210
2
2 2
22 2
1 2
h ch h ch h ch
h kh h kh h h kh h
sh sh
c E pn c E pn c E
sh sh
pn pn k E k E c k E k
h h
h s h s
E h s h s
c k
(20)
211
13
h ch 2 2
h ch 2 2h kh h h kh h
sh sh
c E c E
pn pn
sh
pn k E c k E k
h h
h s h s
h s
c k
(21)
213
2.3. Numerical example: 2DOF human-structure system
214
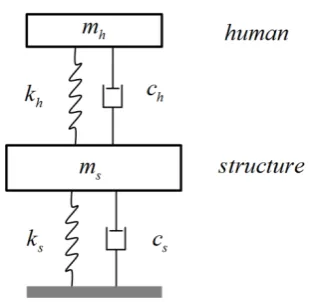
Let us consider a SDOF structure occupied by a SDOF human shown in Fig. 1. The dynamic 215
properties of the individual human and the structure as well as those of the human-structure 216
system (obtained from eigenvalue analysis of the 2DOF model) are given in Table 1. The first 217
vibration mode of the human-structure system having frequency f1and damping ratio 1is
218
dominated by structural motion. The second mode (frequency f2and damping ratio 2) is
219
dominated by human motion. 220
[image:14.595.219.374.368.519.2]221
Fig. 1 2DOF model of human-structure system
222
If the direct receptance of the empty structure were measured accurately, it would have 223
resulted in 224
11 2 2 5
1 1
650 792.31 6.04 10
s
s s s
h s
m s c s k s s
. (22)
14
Taking into account that the mass, damping and stiffness of the human body are mh62 kg,
226
3
1.44 10
h
c N s m -1 and kh 6.12 10 4 N m -1, respectively, the direct receptance of the
227
human-structure system 11sh
h s can be calculated from Eq. (14)
228
11 2 5
2
3 4
2 5
3 4
2 5 2
1
650 792.31 6.04 10
1 1.44 10 6.12 10
650 792.31 6.04 10
1 1
1 1.44 10 6.12 10
650 792.31 6.04 10 62
sh
h s
s s
s
s s
s
s s s
(23) 229
The characteristic equation 230
3 4
2 5 2
1 1
1 1.44 10 6.12 10 0
650 792.31 6.04 10 62
s
s s s
(24)
231
generates the eigenvalues of the human-structure system 1,3 2.0595 28.2310i s1
and 232
2,4 11.2826 31.8841i
s1
[image:15.595.114.481.540.727.2], which are the same as those shown in Table 1. 233
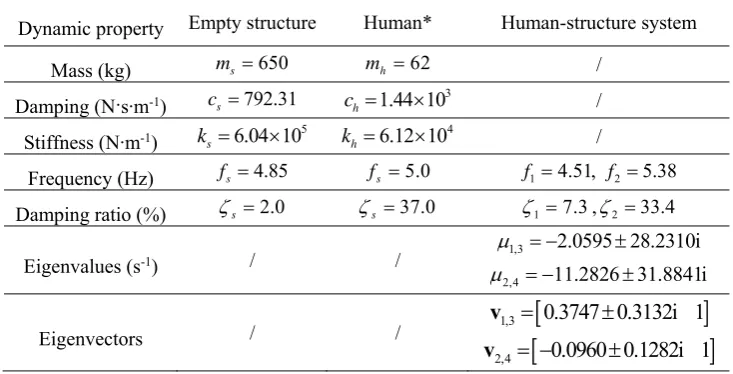
Table 1 Dynamic properties of the human-structure system
234
Dynamic property Empty structure Human* Human-structure system
Mass (kg) ms 650 mh 62 /
Damping (N·s·m-1) cs 792.31 ch1.44 10 3 /
Stiffness (N·m-1) ks6.04 10 5 kh6.12 10 4 /
Frequency (Hz) fs 4.85 fs 5.0 f14.51, f25.38
Damping ratio (%) s 2.0 s 37.0 17.3,233.4
Eigenvalues (s-1) / / 1,3
2.0595 28.2310i
2,4 11.2826 31.8841i
Eigenvectors / / 1,3
0.3747 0.3132i 1
v
2,4 0.0960 0.1282i 1
15
* The human dynamic properties correspond to the fundamental mode of the human model 235
for standing posture specified in ISO 5982 [33]. 236
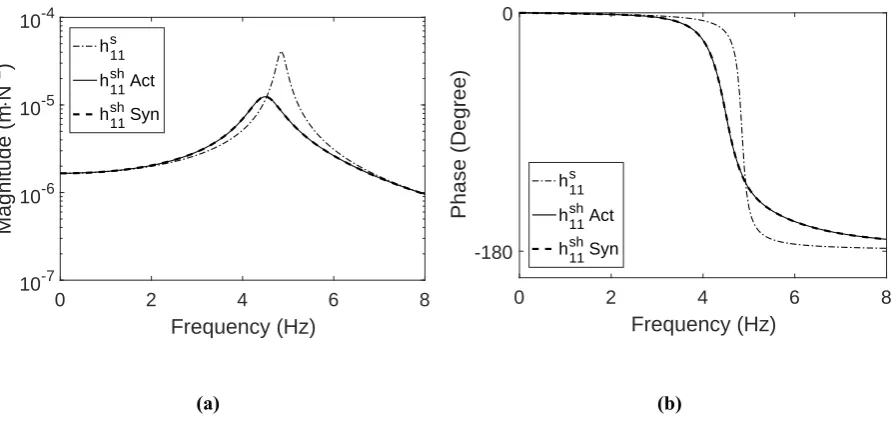
The synthesised direct receptance of the human-structure system described by Eq. (23), 237
shown as the thick dashed line in Fig. 2, accurately reproduces the actual receptance of the 238
human-structure system shown as the thin solid line. Fig. 2 also shows that the presence of 239
the human shifts the frequency from 4.85 Hz for the empty structure (dash-dotted line) to 240
4.51 Hz for the human-structure system. It also significantly increases the damping ratio of 241
the mode dominated by structural motion (from 2.0% to 7.3%). The mode dominated by 242
human motion is heavily damped which is the reason that it cannot be observed in the 243
receptance graph for the human-structure system. The structure in this example is an actual 244
16.9 m long glass FRP composite bridge [34]. The example demonstrates that the presence of 245
a single human can significantly modify the dynamics of the empty structure. 246
[image:16.595.78.525.448.659.2](a) (b) Fig. 2 Receptances of the human-structure system and the structure: (a) Magnitude; (b) Phase
247
Let us assume the expectation and standard deviation of the damping of the human body are 248
3
1.44 10 h
c
E N·s·m-1 and 0.1
h
c ch
N·s·m-1, respectively, while the counterparts for the
249
stiffness are 6.12 104
h
k
E N·m-1 and 0.1
h
k kh
N·m-1 (The corresponding expectations
250
0 2 4 6 8
Frequency (Hz)
10-7 10-6 10-5 10-4
Magnitude (m
N
-1 )
hs11
hsh
11 Act
hsh11 Syn
0 2 4 6 8
Frequency (Hz)
-180 0
Phase (Degree)
hs11
hsh
11 Act
16
and standard deviations of the frequency and damping ratio are 5.0 h
f
E Hz and 0.25
h
f
251
Hz and 37.0% h
E and 4.0%
h
, estimated using the second-order perturbation method 252
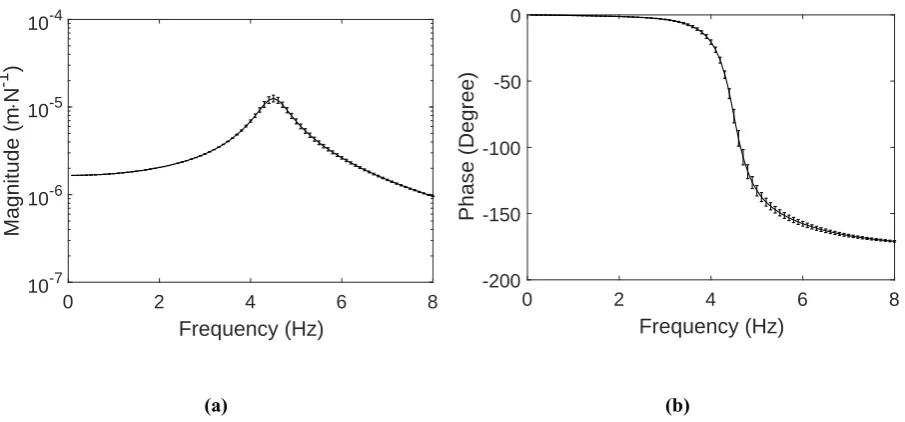
[32]). By using the proposed uncertainty estimation method in Section 2.2, the expectation 253
and standard deviation of the direct receptance of the human-structure system can be obtained, 254
as plotted in Fig. 3. The coefficient of variation (CoV) of 10% for both the damping and 255
stiffness of the human body led to the maximum CoV of 9% for the magnitude and phase of 256
the predicted FRF of the human-structure system. The predicted expectations and standard 257
deviations shown in Fig. 3 were verified using Monte Carlo simulations (sample size = 1000). 258
[image:17.595.74.527.329.540.2](a) (b) Fig. 3 The direct receptance of the human-structure system: (a) Magnitude; (b) Phase;
259
Solid line - Expectation; Error bar - Standard deviation
260
3. Identification of the dynamics of the human body
261
In this section, formulas for identifying the dynamics of a stationary human occupying a 262
structure are presented, and their use is demonstrated in an experiment conducted on a 263
laboratory bridge. 264
0 2 4 6 8
Frequency (Hz)
10-7 10-6 10-5 10-4
Magnitude (m
N
-1 )
0 2 4 6 8
Frequency (Hz)
-200 -150 -100 -50 0
17
3.1. Theoretical derivations
265
Let us assume that the direct receptance at then-th DOF hnns of the empty structure is
266
available (for example, through modal testing). In addition, let us assume that the direct 267
receptance at then-thDOF or the cross receptance between the -thp output and then-thinput
268
of the human-structure system is also available resulting in identifying the complex conjugate 269
eigenvalues sh k
and sh k
of the k-th mode dominated by structural motion of the
human-270
structure system. The eigenvalues sh k
and sh k
should satisfy Eq. (15), i.e. 271
2 2 1
2 2
1 1
1
1
sh
k h
sh s sh
sh
k h nn k
h k
sh
sh
h k
k h
sh s sh
k h nn k
m
m h c
k m
m h
(25) 272
Eq. (25) demonstrates that the damping ch and stiffness kh of the human can be calculated
273
using the mass of the human mh and the direct receptance of the empty structurehnns
s that 274is evaluated at a pair of eigenvalues sh k
and sh k
. Eq. (25) always results in real solutions for 275
h
c and kh due to the use of the complex conjugate pair ksh and ksh.
276
Making use of the proposed approach for experimental identification of human properties is 277
straightforward. It only requires measuring a direct receptance for the empty structure and a 278
direct receptance or a cross receptance for the human-structure system. 279
If the measured quantity is accelerance rather than receptance, an alternative form of Eq. (25) 280
18
2
s s s
a x . The receptance matrix s
s
H and the accelerance matrix s
a s
H satisfy the 282
relationship 283
2s a
s s
s s
H
H (26)
284
leading to the estimate of the damping and stiffness of the human from Eq. (27) 285
2
1
, 2
,
1 1
1
1
sh
k h
s sh sh
h a nn k
h k
sh
sh
h k
k h
s sh h a nn k
m
m h c
k m
m h
(27) 286
As can be seen from Eqs. (25) and (27), the identification of human body dynamics relies on 287
the quality of the curve fitting of the FRFs of the empty structure and also of the FRFs around 288
the modes dominated by structural motion of the joint system. The strategies for performing 289
curve fitting have been investigated elsewhere, e.g. [35, 36], and have not been elaborated in 290
this paper. 291
3.2. Experimental case study: Dynamic properties of a human in a standing posture
292
The use of the proposed method is demonstrated on an example of identifying the dynamic 293
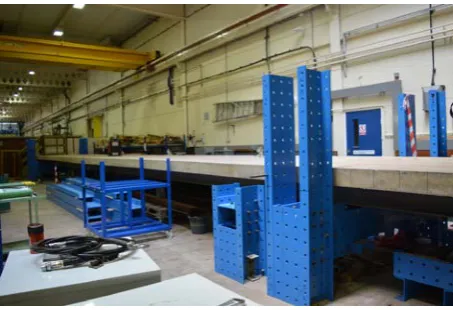
properties of a human standing on a steel-concrete composite bridge situated in the Structures 294
Laboratory at the University of Warwick (Fig. 4). The bridge has a mass of 16,500 kg whilst 295
its deck is 19.9 m long and 2 m wide. It sits on two meccano frames that span 16.34 m. The 296
mass of the human is 100 kg and his height is 180 cm. The experiments were approved by the 297
19
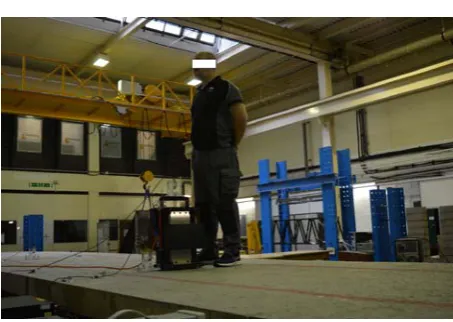
Accelerances of the empty bridge and the human-bridge system were measured in a modal 299
testing programme. The measurement points are shown in Fig. 5. The bridge was excited 300
using an electrodynamic shaker (Model APS 400) placed at test point (TP) 1, as shown in Fig. 301
6. The generated force was indirectly measured using an accelerometer (Honeywell QA750) 302
of nominal sensitivity 1300 mV/g attached to the moving armature. Another two 303
accelerometers of the same type were placed at TP1 and TP2 to measure the vibration 304
responses of the bridge in the vertical direction. The data acquisition system consisted of a 305
laptop, a 4-channel data logger (SignalCalc Ace by Data Physics), a signal conditioner and a 306
power amplifier (Model APS 145). A chirp signal in the frequency range 1-9 Hz was applied 307
to the structure for 64 seconds. A data acquisition window was set to 128 seconds. No 308
window was used in data processing since the vibration responses returned to the ambient 309
level within the data acquisition window. Six averages were used to minimise the effects of 310
noise. The typical standing posture of the human is shown in Fig. 6. 311
[image:20.595.186.413.447.602.2]312
Fig. 4 The empty structure
20 315
Fig. 5 Bridge geometry and measurement points
316 317
[image:21.595.184.411.283.444.2]318
Fig. 6 A human and a shaker at TP1
319
3.2.1. Modal testing
320
The dynamic properties of the human body were identified at three different force levels. The 321
induced maximum accelerations at the driving point on the empty bridge and the human-322
bridge system ranged from 0.36 m·s-2 to 0.65 m·s-2 and from 0.34 m·s-2 to 0.62 m·s-2,
323
respectively. The frequencies and damping ratios of the empty structure showed negligible 324
variation with the response level. The same conclusion was drawn for the human-structure 325
system. These findings suggest that the empty bridge and the human-bridge system exhibited 326
relatively linear behaviour at the three different force levels and they all resulted in almost the 327
same properties of the human body. The force level chosen for presentation in this paper is 328
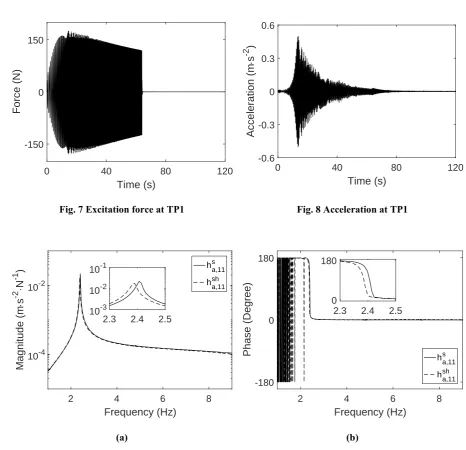
21
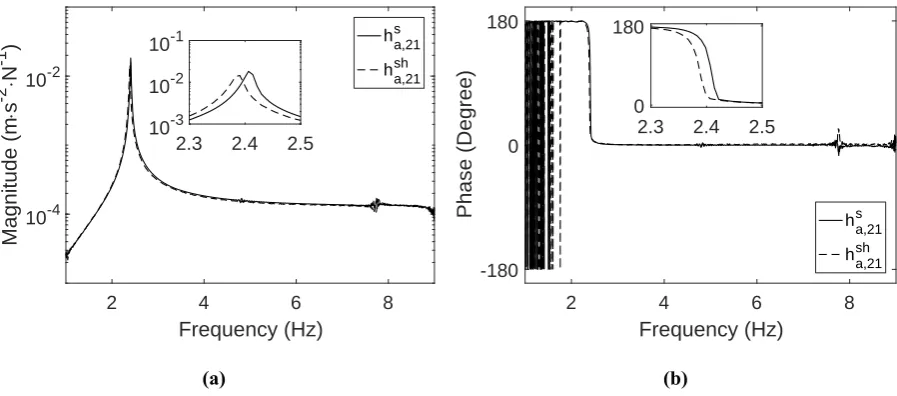
is shown in Fig. 8. The direct and cross accelerances for the empty bridge and the bridge 330
occupied by the test subject are shown in Fig. 9 and Fig. 10, respectively. The two figures 331
[image:22.595.60.527.157.607.2]show that the presence of the test subject affects the dynamics of the system slightly. 332
Fig. 7 Excitation force at TP1 Fig. 8 Acceleration at TP1
333
(a) (b) Fig. 9 Direct accelerances of the unoccupied and occupied structures: (a) Magnitude; (b) Phase
334
0 40 80 120
Time (s)
-150 0 150
Force (N)
0 40 80 120
Time (s)
-0.6 -0.3 0 0.3 0.6
Acceleration (m
s
-2 )
2 4 6 8
Frequency (Hz)
10-4 10-2
Magnitude (m
s
-2
N
-1 )
hs
a,11
hsh
a,11
2.3 2.4 2.5
10-3 10-2 10-1
2 4 6 8
Frequency (Hz)
-180 0 180
Phase (Degree) hs
a,11
hsh
a,11
2.3 2.4 2.5
[image:22.595.92.523.179.345.2]22
[image:23.595.75.524.75.273.2](a) (b) Fig. 10 Cross accelerances of the unoccupied and occupied structures: (a) Magnitude; (b) Phase
335
The measured accelerance s,11 a
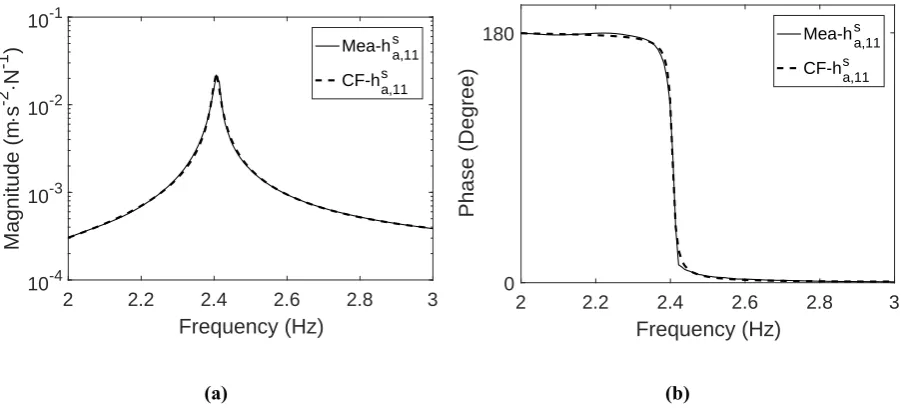
h of the empty structure was curve fitted using the rational 336
fraction polynomial method [35]. Good agreement between the curve-fitted (CF) 337
accelereance and its measured counterpart is demonstrated in Fig. 11. The analytical 338
expression of the curve-fitted accelerance is 339
0 6 1 5 2 4 3 3 4 2 5 6,11 2
0 1 2
s a
a s a s a s a s a s a s a
h s
b s b s b
(28)
340
where 9
0 2.0486 10
a s4 , a1 2.9053 10 9 s3 , a2 1.4985 10 6 s2 ,
341
6 3 1.6243 10
a s , 4
4 5.9928 10
a , a5 2.1540 10 4 s1 , a6 0.0266 s2 ,
342
0 1.8069
b N s m 2 1, b10.1606 N s m 1 and b2 412.8475 N m 1.
343
The pair of eigenvalues corresponding to the first mode of the human-structure system were 344
identified to be 0.0536 14.9840i s1 by curve fitting either the accelerance ,11
sh a
h or hash,21.
345
2 4 6 8
Frequency (Hz)
10-4 10-2
Magnitude (m
s
-2
N
-1 )
hs
a,21
hsh
a,21
2.3 2.4 2.5
10-3 10-2 10-1
2 4 6 8
Frequency (Hz)
-180 0 180
Phase (Degree) hs
a,21
hsh
a,21
2.3 2.4 2.5
23
[image:24.595.74.525.82.286.2](a) (b) Fig. 11 Comparison between measured and curve-fitted accelerenace s,11
a
h : (a) Magnitude; (b) Phase
346
3.2.2. Dynamic properties of the human body
347
Based on the direct accelerance of the empty structure (Eq. (28)), the pair of eigenvalues of 348
the occupied bridge and Eq. (27), the undamped frequency and damping ratio of the test 349
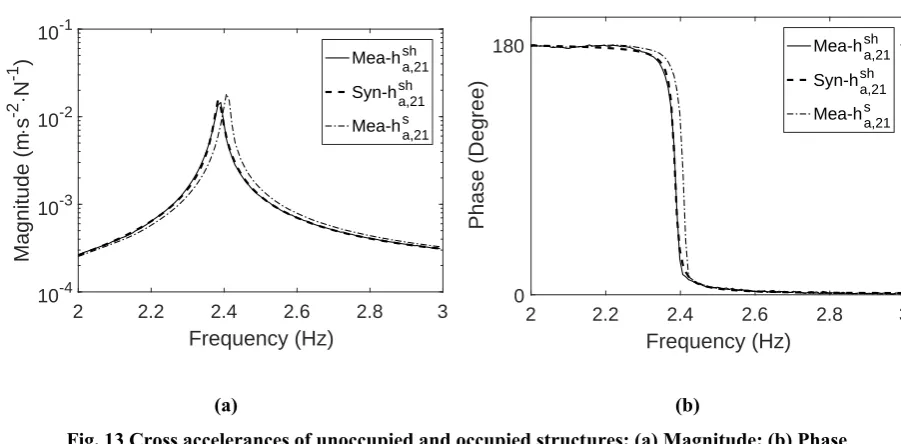
subject were identified to be 4.85 Hz and 27.0%, respectively. 350
To validate the results, the accelerances sh,21 a
h and sh,11 a
h were synthesised using Eqs. (13) and 351
(14). Fig. 12 and Fig. 13 show that the synthesised accelerances (thick dashed curves) of the 352
human-structure system agree well with their measured counterparts (thin solid curves). 353
2 2.2 2.4 2.6 2.8 3
Frequency (Hz)
10-4 10-3 10-2 10-1
Magnitude (m
s
-2
N
-1 )
Mea-hs
a,11
CF-hs
a,11
2 2.2 2.4 2.6 2.8 3
Frequency (Hz)
0 180
Phase (Degree)
Mea-hs
a,11
CF-hs
a,11
2 2.2 2.4 2.6 2.8 3
Frequency (Hz)
10-4 10-3 10-2 10-1
Magnitude (m
s
-2
N
-1 )
Mea-hsh
a,11
Syn-hsh
a,11
Mea-hs
a,11
2 2.2 2.4 2.6 2.8 3
Frequency (Hz)
-180 0 180
Phase (Degree)
Mea-hsh
a,11
Syn-hsh
a,11
Mea-hs
24
(a) (b) Fig. 12 Direct accelerances of unoccupied and occupied structures: (a) Magnitude; (b) Phase
354
[image:25.595.69.520.111.333.2](a) (b) Fig. 13 Cross accelerances of unoccupied and occupied structures: (a) Magnitude; (b) Phase
355
To further validate the results of the identification of human body dynamics, the nonlinear 356
optimisation method [2] was employed. The natural frequency identified in this way was 4.84 357
Hz and damping ratio was 30.0%. These results are close to those identified by the proposed 358
method, confirming its validity. 359
3.2.3. Discussion on the working of the method for identifying the dynamics of the
360
human body
361
According to Eq. (27), theoretically, if the eigenvalues sh k
and sh k
of the human-structure 362
system are different from the eigenvalues s k
and s k
of the empty structure, the damping and 363
stiffness of the human can be identified. In practice, only a reliable detection of the 364
eigenvalue difference between the unoccupied and occupied structures leads to reliable 365
damping and stiffness. The eigenvalue difference is composed of the frequency and damping 366
differences, which correspond to the changes of the peak frequency and magnitude of FRF, 367
respectively. Hence, the working of the proposed method relies on the reliable detection of 368
the changes of the peak frequency and magnitude of FRF. 369
2 2.2 2.4 2.6 2.8 3
Frequency (Hz)
10-4 10-3 10-2 10-1
Magnitude (m
s
-2
N
-1 )
Mea-hsh
a,21
Syn-hsh
a,21
Mea-hs
a,21
2 2.2 2.4 2.6 2.8 3
Frequency (Hz)
0 180
Phase (Degree)
Mea-hsh
a,21
Syn-hsh
a,21
Mea-hs
25
A conservative criterion for reliable identification of two closely spaced spectral peaks states 370
that the frequency separation between the two peaks should be at least twice the frequency 371
resolution provided the rectangular window is used in signal processing [37]. The frequency 372
separation is required to be four times greater than the frequency resolution in cases in which 373
the Hann or Hamming window is used [37]. Therefore, the proposed method allows the 374
reliable identification of human body dynamics if the frequency difference between the 375
unoccupied and occupied structures is at least two times greater than the frequency resolution 376
when the rectangular window is used in data processing or at least four times greater when 377
the Hann or Hamming window is utilised. 378
Since the rectangular window was used in analysis of the human-structure system presented 379
in Section 3.2 and the frequency separation of 0.03 Hz is approximately four times of the 380
frequency resolution (∆f = 1/128 Hz), the identification of the human body dynamics is 381
reliable in the example presented. 382
The structure (modal) to human mass ratio is one of the factors which affects the frequency 383
difference [9]. Based on the criterion about the minimum frequency difference, the effect of 384
the mass ratio may be investigated using parametric analysis. Let us consider the human-385
structure system presented in Section 3.2. Let us assume that the bridge has frequency of 2.41 386
Hz, damping ratio of 0.3% and varying modal mass while the properties of the human are as 387
follows: mass 100kg, frequency 4.85Hz and damping ratio 27.0%. The frequency of the 388
mode dominated by the structural motion of the joint system can be calculated (thick solid 389
line in Fig. 14). The thick dashed line in Fig. 14 is separated by a distance of 2∆f (=0.0156 390
Hz) from the thick dash-dotted line, which indicates the frequency of the unoccupied system 391
(2.41 Hz). The intersection of the thick solid line and the thick dashed line indicates that the 392
26
system presented in Section 3.2, the mass ratio was 70, and therefore the human body 394
dynamics were reliably identifiable. 395
The structure to human ratios for frequency and damping ratio are the other two factors 396
affecting the frequency difference [9]. The parametric analysis for investigating the effect of 397
the structure to human ratios for frequency and damping ratio is similar to that for the mass 398
ratio and therefore it is not presented here. 399
[image:27.595.188.407.272.440.2]400
Fig. 14 Frequency of the mode dominated by structural motion against the modal mass of the structure to
401
the human mass ratio (∆f = 1/128)
402
4. Identification of the dynamics of the empty structure
403
In this section, formulas for the identification of the properties of the empty structure from 404
the known dynamics of the human and human-structure system are presented. Their use is 405
illustrated utilising the experiment described in Section 3.2 and a numerical example of a 406
three-span glass FRP composite bridge. 407
4.1. Theoretical derivations
408
Rearranging Eq. (14) generates the direct receptance of the unoccupied structure 409
0 50 100 150
Mass ratio
2.25 2.3 2.35 2.4 2.45
Frequency (Hz)
f sh f
s f
27
2
2
1 1 1 1
sh
h h nn
h s
nn
sh
h h h h nn
h
c s k h s
m s
h s
c s k c s k h s
m s
(29) 410
which is a function of the known direct receptance sh
nnh s of the human-structure system and 411
the known dynamic properties of the human. 412
Rewriting (13) leads to 413
2
1 1
s sh
nn h h pn
s sh
pn pn
h h
h
h s c s k h s
h s h s
c s k
m s
(30) 414
Substituting (29) into (30) results in 415
2 1 1
sh sh
pn h h nn
s sh
pn pn
sh
h h h h nn
h
h s c s k h s
h s h s
c s k c s k h s
m s
(31) 416
which shows that the cross receptance of the unoccupied structure could be deduced from the 417
direct and cross receptance functions of the human-structure system and the dynamic 418
properties of the human. The natural frequency and damping ratio of the unoccupied structure 419
can then be calculated from the characteristic equation (i.e. denominator in Eqs. (29) or (31) 420
equated to zero). 421
As can be seen from Eqs. (29) and (31), the quality of the curve fitting of the FRFs around 422
28
the modes of the empty structure. The strategies for performing curve fitting have been 424
investigated elsewhere, e.g. [35, 36], and have not been elaborated in this paper. 425
4.2. The effect of uncertainties in the human body dynamics on the identification of the
426
dynamic properties of the empty structure
427
The expectation and standard deviation of the magnitude of thepn-threceptance of the empty 428
structure system can be expressed as 429
2
2 2
22 2
1 2
h ch h ch h ch
h kh h kh h h kh h
s s
pn pn
c E c E c E
s s
pn pn k E k E c k E k
h h
h s h s
E h s h s
c k
(32) 430 and 431
h ch 2 2
h ch 2 2h kh h h kh h
s s
pn c E pn c E
s
pn k E c k E k
h h
h s h s
h s c k (33) 432
Similarly, the expectation and standard deviation of the phase of thepn-threceptance of the 433
empty structure system can be expressed as, 434
2
2 2
22 2
1 E
2
h ch h ch h ch
h kh h kh h h kh h
s s
c E pn c E pn c E
s s
pn pn k E k E c k E k
h h
h s h s
h s h s
c k
(34)
435
and 436
h ch 2 2
h ch 2 2h kh h h kh h
s s
c E c E
pn pn
s
pn k E c k E k
h h
h s h s
h s c k
(35)
29
4.3. Experimental case study: Dynamic properties of the structure
438
The use of the proposed method is demonstrated on an example of identifying the properties 439
of the bridge from Section 3.2, by utilising the measured accelerances while the test subject 440
was standing on the structure and known properties of the human. The measured direct and 441
cross accelerances were curve fitted using the rational fraction polynomial method [35]. The 442
analytical expression of the curve-fitted accelerance sh,11
ah s is
443
0 6 1 5 2 4 3 3 4 2 5 6,11 2
0 1 2
sh a
a s a s a s a s a s a s a
h s
b s b s b
(36)
444
where 9
0 1.8385 10
a s4 , a1 1.7167 10 9 s3 , a2 1.3257 10 6 s2 ,
445
7 3 9.7898 10
a s , 4
4 5.5414 10
a , a5 1.4522 10 4 s1 , a6 0.0228 s2 ,
446
0 1.8417
b N s m 2 1, b10.1975 N s m 1 and b3 413.5110 N m 1.
447
The analytical expression of the curve-fitted accelerance sh,21
ah s is
448
0 6 1 5 2 4 3 3 4 2 5 6,21 2
0 1 2
sh a
a s a s a s a s a s a s a
h s
b s b s b
(37)
449
where 9
0 1.8438 10
a s4 , a1 1.6904 10 9 s3 , a2 1.3114 10 6 s2 ,
450
7 3 9.6580 10
a s , 4
4 5.4878 10
a , a5 1.4277 10 4 s1 , a6 0.0225 s2 ,
451
0 2.2058
b N s m 2 1, b10.2366
1
N s m and b3 495.2469
1
N m . 452
The accelerances s,11 a
h and s,21 a
h were then found using Eqs. (29) and (31). Fig. 15 and Fig. 16 453
30
with their measured counterparts (thin solid lines). Utilising the characteristic equation for the 455
synthesised accelerances of the empty structure, the fundamental natural frequency and 456
damping ratio of the empty structure were identified as 2.41 Hz and 0.3 % (i.e. the same 457
values that would be obtained by curve fitting the measured accelerance for the empty 458
structure). 459
[image:31.595.75.526.235.452.2](a) (b) Fig. 15 Direct accelerances of unoccupied and occupied structures: (a) Magnitude; (b) Phase
460
(a) (b) Fig. 16 Cross accelerances of unoccupied and occupied structures: (a) Magnitude; (b) Phase
461
2 2.2 2.4 2.6 2.8 3
Frequency (Hz)
10-4 10-3 10-2 10-1
Magnitude (m
s
-2
N
-1 )
Mea-hsh
a,11
Mea-hs
a,11
Syn-hs
a,11
2 2.2 2.4 2.6 2.8 3
Frequency (Hz)
-180 0 180
Phase (Degree)
Mea-hsh
a,11
Mea-hs
a,11
Syn-hs
a,11
2 2.2 2.4 2.6 2.8 3
Frequency (Hz)
10-4 10-3 10-2 10-1
Magnitude (m
s
-2
N
-1 )
Mea-hsh
a,21
Mea-hs
a,21
Syn-hsa,21
2 2.2 2.4 2.6 2.8 3
Frequency (Hz)
0 180
Phase (Degree)
Mea-hsh
a,21
Mea-hs
a,21
Syn-hs
[image:31.595.71.527.479.695.2]31
Let the expectations of the damping and stiffness of the human body be 1.65 103
h
c
E
462
N·s·m-1 and 9.28 104
h
k
E N·m-1, respectively. Let us assume that the standard deviations of
463
the damping and stiffness are 0.1 h
c ch
N·s·m-1 and 0.1
h
k kh
N·m-1, respectively. The
464
corresponding expectations and standard deviations of the damping ratio and frequency of the 465
human body are 27.0% h
E and 3.0%
h
and 4.84
h
f
E Hz and 0.24
h
f
Hz, estimated 466
using the second-order perturbation method [32]. By using the proposed uncertainty 467
estimation method, the expectation and standard deviation of the direct accelerance of the 468
empty bridge are plotted in Fig. 17. The CoV of 10% for both the damping and stiffness of 469
the human body led to the maximum CoV of 7% for the magnitude and phase of the 470
predicted FRF of the empty structure. The predicted expectation and standard deviation of 471
FRFs were verified using Monte Carlo simulations (sample size = 1000). 472
473
[image:32.595.77.526.467.677.2](a) (b) Fig. 17 Direct accelerance of the empty system: (a) Magnitude; (b) Phase;
474
Solid line - Expectation; Error bar - Standard deviation
475
2 2.2 2.4 2.6 2.8 3
Frequency (Hz)
10-4 10-3 10-2 10-1
Magnitude (m
s
-2
N
-1 )
2 2.2 2.4 2.6 2.8 3
Frequency (Hz)
0 50 100 150 200