© 2019, IRJET | Impact Factor value: 7.211 | ISO 9001:2008 Certified Journal | Page 4308
Seismic analysis of RC regular and irregular building considering soil
structure interaction for laterite soil
Arun Kumar G S
1, Rakshith Gowda N
2,Roopa T
3, Siddu G Nelagudda
4, Vittal R Bangareppanavar
51 Sr.Assistant professor,Civil Engineering Department ,AIET,Moodbidri, India
2,3,4,5 Under graduate student, Civil Engineering Department, AIET, Moodbidri, India.
Abstract —
Dakshina Kannada is one of a districts in the state of Karnataka in India. Surrounded by the Western Ghats on east and Arabian Sea on the west, Dakshina Kannada receives abundant rainfall during the monsoon season. Latitude of Dakshina Kannada is 12.84380 N &75.24790 E, covers the area of 4559km2. Some of the
standard journals were referred as guide line for this RC regular and irregular structures. Review standard papers are done on the seismic analysis of RC regular irregular structure considering soil structure interaction of laterite soil. . An earthquake is caused by tectonic plates getting stuck and putting a strain on the ground. The strain becomes so great that rocks give way by breaking and sliding along fault planes. Earthquakes may occur naturally or as a result of human activities. Smaller earthquakes can also be caused by volcanic activity, landslides, mine blasts, and nuclear tests. It is therefore essential to consider the lateral force while designing the buildings to mitigate the effects of major earthquakes. In the present study the gravity load analysis and lateral load analysis as per the seismic code IS 1893 (Part 1): 2002 are carried out for regular and irregular building.
Keywords:
Soil Structure Interaction1, Spring Stiffness2,Base Shear3, Displacement4, Natural Time Period5.
I
I
NTRODUCTIONDakshina Kannada is one of the districts in the state of Karnataka in India. Surrounded by the Western Ghats on east and Arabian Sea on the west, Dakshin Kannada receives abundant rainfall during the monsoon season. Latitude of Dakshina Kannada is 12.84380 N & 75.24790 E, covers the area of 4559 km2. Dakshina Kannada is situated at a distance of 229km from the capital city Bengaluru Via NH75. Dakshina Kannada comprises of valleys and hills which will be difficult to construct multi-storey structure of same height at all point of the building. If we level the land for construction activity which will makes the project costlier and hence step back building were constructed which will matches with ground profile, a detailed study of a normal regular building and a height wise irregular structure subjected to seismic forces were studied. Due to tectonic plate movement earthquake happens, if the stress bearing
capacity of a member based on design requirement were constructed as per Indian codes, then we may observe the property or life loss will be reduced to some extent, if a large or high magnitude earthquake happens then we may observe disaster. Earthquake effects enhances the loop-hole of the buildings when they act on it, this may arise due to discontinuity in mass, stiffness and geometry of the structures having this discontinuity are termed as Irregularities in structures. Irregular structures contribute a large portion of urban infrastructure because to obey the byelaws and to increase the building area in the upper floors. Irregularities are one of the major reasons of failures of structures during earthquakes so, the effect of Irregularities in the seismic performance of structures becomes really important. Story wise changes in stiffness and mass render the dynamic characteristics of these buildings differ from the regular building. IS 1893 (Part 1):2016 defines irregular distributions in their mass, strength and stiffness along the height of building as irregular structures, when such buildings are constructed in high seismic zones more precision and accuracy is required to calculate forces in the structural members.
II METHODOLOGY
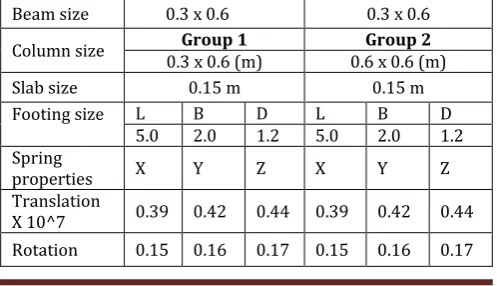
[image:1.595.314.563.640.783.2]In the present study the analysis has been done for a 8 story building using ETA-BS 2013. Finite element analysis was done using the eqvalient static and response spectrum analysis. The properties for the model generated are as mentioned below.
Table No 1: Regular Building Properties & Irregular Building Physical Properties All Dimensions Are In Meter
Beam size 0.3 x 0.6 0.3 x 0.6
Column size 0.3 x 0.6 (m) Group 1 0.6 x 0.6 (m) Group 2
Slab size 0.15 m 0.15 m
Footing size
L 5.0 B 2.0 D 1.2 L 5.0 B 2.0 D 1.2 Spring
properties X Y Z X Y Z
Translation
© 2019, IRJET | Impact Factor value: 7.211 | ISO 9001:2008 Certified Journal | Page 4309 III MODELING AND ANALYSIS
In the present study, regular and irregular dimensional building of varying storey and of plan size 30m x 30m is considered with the beam size 0.3mx0.6m and column size varying from 0.3mx0.6m and 0.6mx0.6m. The buildings of various storey have been considered 8 stories the analysis results for fixed base and flexible base condition. The slab is taken to be of 0.15m thick and is considered to be modelled as membrane. Here the buildings are modelled as fixed end conditions and then the springs are assigned based on the size of footing in the fixed case, to counter act for soil structure interaction, and analyzed for different load cases as per code specification in ETA-BS software.
Fig -1: Plan and elevation of 8 storey building
IV RESULTS AND DISCUSSION
The work attempts to study the behavior of regular and irregular buildings with rigid and flexible foundation. Framed structure of different height with regular and irregular plans have been considered with fixed and flexible foundation resting on Laterite soil. A framed structure of rectangular plan with 8 storey is analyzed for earthquake load consider in zone-III, importance factor of 1.5, with the Laterite soil with fixed and flexible base condition. Response spectrum analysis is done and the parameters like time period, base shear, bending moment in column and top storey displacement are measured and are present below. For 8 storeys buildings is considered and is analyzed for dead load, live load & earthquake load with base as fixed and flexible. In the flexible base condition the soil and foundation is modelled as spring element. The stiffness of spring is calculated based on soil properties.
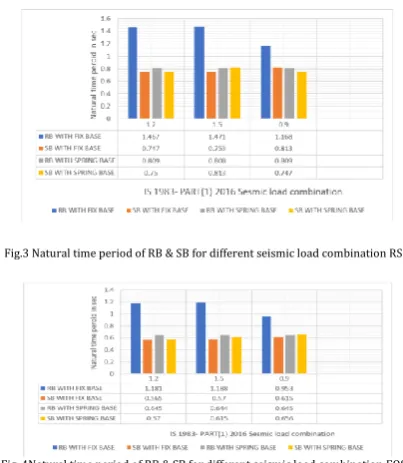
[image:2.595.333.535.90.322.2]Natural time period: Time taken to come back to its original position by a building or structure called as natural time period
Fig.3 Natural time period of RB & SB for different seismic load combination RSM
Fig.,4Natural time period of RB & SB for different seismic load combination EQSM
[image:2.595.37.264.287.408.2]Lateral Displacement: Lateral displacement is the amount of sideway between two adjacent stories of a building caused by lateral (wind and seismic) loads. The Lateral displacement for Human Criteria should be 0.0014H. For 8 storey building model lateral displacement is 34mm is obtained from seismic analysis.
[image:2.595.332.542.430.562.2]Fig.3 Lateral displacement of RB & SB for different seismic load combination EQX.
[image:2.595.332.541.585.735.2]© 2019, IRJET | Impact Factor value: 7.211 | ISO 9001:2008 Certified Journal | Page 4310 Table.2 Lateral displacement of RB & SB for different seismic load
combination EQX with spring base
EQX DISPLACEMENT IN mm
NO OF
STOREY 1.2 RB 1.5 RB 0.9 RB 1.2 SB 1.5 SB 0.9 SB
BASE 0 0 0 0 0 0
STOREY1 0.5 0.7 0.5 0 0 0
STOREY2 3.9 4.8 3.8 0 0 0
STOREY3 7.7 9.5 7.5 1.6 2 1.5
STOREY4 11.5 14.1 11.1 3.6 4.5 3.4 STOREY5 16.2 19.8 15.7 6.2 7.8 5.9 STOREY6 20.2 24.6 19.6 8.5 10.7 8 STOREY7 23.1 28 22.5 10.3 12.9 9.7 STOREY8 24.6 29.7 24 11.4 14.3 10.7
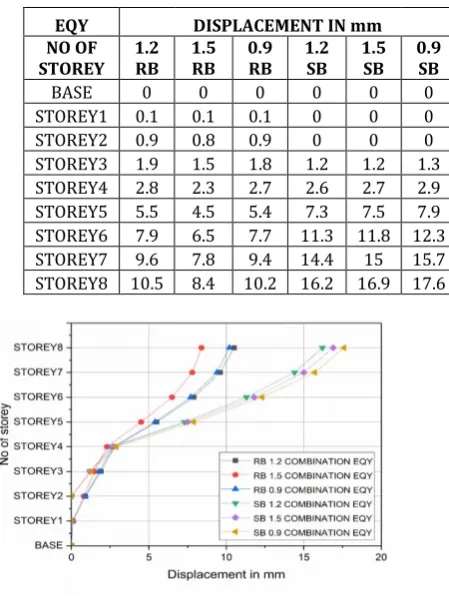
Table., 3 : Lateral displacement of RB & SB for different seismic load combination EQY with spring base
EQY DISPLACEMENT IN mm
NO OF
STOREY 1.2 RB 1.5 RB 0.9 RB 1.2 SB 1.5 SB 0.9 SB
BASE 0 0 0 0 0 0
STOREY1 0.1 0.1 0.1 0 0 0
STOREY2 0.9 0.8 0.9 0 0 0
STOREY3 1.9 1.5 1.8 1.2 1.2 1.3 STOREY4 2.8 2.3 2.7 2.6 2.7 2.9 STOREY5 5.5 4.5 5.4 7.3 7.5 7.9 STOREY6 7.9 6.5 7.7 11.3 11.8 12.3 STOREY7 9.6 7.8 9.4 14.4 15 15.7 STOREY8 10.5 8.4 10.2 16.2 16.9 17.6
Fig. 4 Lateral displacement of RB & SB for different seismic load combination EQY with spring base
[image:3.595.33.252.120.392.2]Storey drift: It is defined as ratio of displacement of two consecutive floor to height of that floor. Various seismic codes suggest values that range from h/50 to h/2000 where h is the height of a building.
[image:3.595.335.541.166.318.2]Fig.5 Story drift of RB for 1.2 seismic load combination EQX
Fig.6 Story drift of RB for 1.2 seismic load combination EQY
[image:3.595.336.538.344.501.2] [image:3.595.41.266.424.725.2] [image:3.595.338.540.537.679.2]© 2019, IRJET | Impact Factor value: 7.211 | ISO 9001:2008 Certified Journal | Page 4311 Fig.8 Story drift of RB for 1.5 seismic load combination EQY
Fig.9 Story drift of RB for 0.9 seismic load combination EQX
Fig.10 Story drift of RB for 0.9 seismic load combination EQY
Fig.11 Story drift of SB for 1.2 seismic load combination EQX
Fig.12 Story drift of SB for 1.2 seismic load combination EQY
© 2019, IRJET | Impact Factor value: 7.211 | ISO 9001:2008 Certified Journal | Page 4312 Fig.15 Story drift of SB for 0.9 seismic load combination EQX
Fig.16 Story drift of SB for 0.9 seismic load combination EQY
Fig.17 Story drift of RB for 1.2 seismic load combination RSX
Fig.18 Story drift of RB for 1.2 seismic load combination RSY
Fig.19 Story drift of RB for 1.5 seismic load combination RSX
© 2019, IRJET | Impact Factor value: 7.211 | ISO 9001:2008 Certified Journal | Page 4313 Fig.21 Story drift of RB for 0.9 seismic load combination RSX
Fig.22 Story drift of RB for 0.9 seismic load combination RSY
Fig.23 Story drift of SB for 1.2 seismic load combination RSX
Fig.23 Story drift of SB for 1.2 seismic load combination RSX
Fig.24 Story drift of SB for 1.2 seismic load combination RSY
© 2019, IRJET | Impact Factor value: 7.211 | ISO 9001:2008 Certified Journal | Page 4314 Fig.26 Story drift of SB for 1.5 seismic load combination RSY
Fig.27 Story drift of SB for 0.9 seismic load combination RSX
Fig.28 Story drift of SB for 0.9 seismic load combination RSY
V CONCLUSION
1. The Regular building with base fixed model exhibits good performances with compare to the other models and the variation can be express in terms of %.
2. The natural time period for Step back building in the Y-direction exhibits large valves and least
valve in the X-direction for the same model & % of variation is as express below 19.49%,24.36%, 20.27% 18.00% for fixed support and 19.23% ,24.30% ,20.29%, 19.8% for springs support.
3. The lateral displacement for Step back building in the Y-direction exhibits large valves and least valve in the X-direction for the same model & % of variation is as express below for 1.2 load combination 25%, 27.77% 15.06%, 24.77%, 28.47%, 29.62%, and40% ,33.33% ,3.8%, 9.3%,14%,15.38%.
4. The story drift for Step back building in the Y-direction exhibits large valves and least valve in the X-direction for the same model & of
variation is as express below
58.78%,81.12%,77.38%,76.83%,75.53%,70.44 %.
5.
The base shear for Step back building in the Y-direction exhibits large valves and least valves in the X-direction for the same model & % of variation is as express below 18.14% , 5.9%, 26.29% and 40.20%,13.54%,7.1%.VI REFERENCES:-
[1] Agrawal and Charkha (2012), “Significant effects on deflection in orthogonal direction by the shifting the shear wall location”
[2] Chandurkar and Pajgade (2013) “Changing the position of shear wall will affect the Attraction of forces, the dimensions of shear wall are large then major amount of horizontal forces are taken by shear wall”.
[3] Chopra and Goel (2002). “A modal pushover
analysis procedure for estimating seismic demands for buildings was developed by Chopra and Goel (2002). The modal pushover analysis was applied to a nine-storey steel building to determine the peak inelastic response and it was compared with rigorous non-linear response history
[4] Analysis”
[5] D.R. Panchal, P.M. Marathe (2011), “Comparative Study of RCC, steel and composite (G+30 storey) building”, Nirma University, Ahmadabad, India.
[6] Dinesh J. Sabu and Pajgade (2012)
© 2019, IRJET | Impact Factor value: 7.211 | ISO 9001:2008 Certified Journal | Page 4315
[7] Elnashai (2001) “analyzed the dynamic response of structures using static pushover Analysis. The significance of pushover analysis as an alternative to inelastic dynamic
[8] Analysis in seismic design and assessment were discussed”.
[9] Helmut Krawinkler and Seneviratna (1998) “discussed that, the pushover analysis would be a great improvement over presently employed elastic evaluation procedures and they also pointed out that a carefully performed pushover analysis would provide insight into structural aspects that control performances during severe earthquakes.
[10] IS 1893: 2002, “Code for earthquake resistant design of structures- general provisions for buildings, Part I, Bureau of Indian Standards”,
New Delhi.
[11] IS 456: 2000, “Code for practice of plain and reinforced concrete code of practice, Bureau of Indian Standards”, New Delhi.
[12] IS 800: 2007, “Indian Standard Code of practice for General Construction of Steel in India, Bureau of Indian Standards”, New Delhi.
[13] IS 11384:1985, “Code of Practice for Design of Composite Structure, Bureau of Indian Standards”, New Delhi.
[14] Jaswant et al. (1997): “The buildings were considered to be located in seismic zone III. Linear elastic analysis was performed for the models of the building using ETABs analysis package”.
[15] Kevadkar and Kodag (2013) “are investigated the concept of using steel bracing is one of the advantageous concepts which can be used to strengthen structure.”
[16] LIU Jingbo, LIU Yangbing (2008), “Seismic behavior analysis of steel-concrete Composite frame structure systems”, Tsinghua University, Beijing, China,.
[17] Mwafy and Elanashai (2000): “Simplicity of inelastic static pushover analysis, a dynamic analysis and inelastic static pushover analysis for 12 reinforced concrete buildings of different characteristics.
[18] Sudhir K. Jain and Rahul Navin (2000) “seismic strengthening of multistory reinforced concrete