1
Modulation of intra- and inter-hemispheric connectivity between primary and
1premotor cortex during speech perception
23
Helen E. Nuttall1,2, Dan Kennedy-Higgins2, Joseph T. Devlin3, Patti Adank2
4 5
1. Department of Psychology, Fylde College, Lancaster University, Lancaster, UK, LA1 4YF 6
2. Department of Speech, Hearing and Phonetic Sciences, University College London, Chandler 7
House, 2 Wakefield Street, London, UK, WC1N 1PF 8
3. Department of Experimental Psychology, University College London, 26 Bedford Way, London, UK, 9
WC1H 0AP 10
11
Please address correspondence to Helen Nuttall, D5, Fylde College, Department of Psychology, 12
Lancaster University, Bailrigg, LA1 4YW, UK. Email: [email protected]. Tel: +44 (0)1524 13
592842 14
2
Abstract
27 28
Primary motor (M1) areas for speech production activate during speech perception. It has been 29
suggested that such activation may be dependent upon modulatory inputs from premotor cortex 30
(PMv). If and how PMv differentially modulates M1 activity during perception of speech that is easy 31
or challenging to understand, however, is unclear. This study aimed to test the link between PMv 32
and M1 during challenging speech perception in two experiments. The first experiment investigated 33
intra-hemispheric connectivity between left hemisphere PMv and left M1 lip area during 34
comprehension of speech under clear and distorted listening conditions. Continuous theta burst 35
stimulation (cTBS) was applied to left PMv in eighteen participants (aged 18-35). Post-cTBS, 36
participants performed a sentence verification task on distorted (imprecisely articulated), and clear 37
speech, whilst also undergoing stimulation of the lip representation in the left M1 to elicit motor 38
evoked potentials (MEPs). In a second, separate experiment, we investigated the role of inter-39
hemispheric connectivity between right hemisphere PMv and left hemisphere M1 lip area. Dual-coil 40
transcranial magnetic stimulation was applied to right PMv and left M1 lip in eighteen participants 41
(aged 18-35). Results indicated that disruption of PMv during speech perception affects 42
comprehension of distorted speech specifically. Furthermore, our data suggest that listening to 43
distorted speech modulates the balance of intra- and inter-hemispheric interactions, with a larger 44
sensorimotor network implicated during comprehension of distorted speech than when speech 45
perception is optimal. The present results further understanding of PMv-M1 interactions during 46
auditory-motor integration. 47
3
1. Introduction
56
After decades of research, the neurobiological network subserving speech perception 57
remains unclear. Without this knowledge, we are limited in our ability to understand how humans 58
perceive and use language (Skipper, Devlin, & Lametti, 2017). The role of motor regions in the 59
speech perception network, in particular, is still hotly debated. Involvement of motor areas in 60
speech perception is based on the observation that speech perception activates speech production 61
brain regions (Silbert, Honey, Simony, Poeppel, & Hasson, 2014; Skipper, Nusbaum, & Small, 2005; 62
Wilson, Saygin, Sereno, & Iacoboni, 2004). However, discussion continues as to whether observed 63
motor activity during situations requiring auditory-motor integration really is essential to speech 64
processing (Meister, Wilson, Deblieck, & Wu, 2007), complementary (Möttönen & Watkins, 2009), or 65
epiphenomenal (Hickok, Houde, & Rong, 2011). This has led to the division of ‘fractionated’ and 66
‘integrated’ views of speech perception (Schomers & Pulvermüller, 2016). In the fractionated view, 67
the temporal speech perception network is key to recognising speech, but does not significantly 68
depend on fronto-parietal speech production circuits. The ‘integrated’ view, however, postulates 69
strong reciprocal links between temporal and fronto-parietal areas, yielding multimodal distributed 70
neuronal circuits capable of reciprocal influence that are causally involved in language 71
understanding, and provide the neuronal basis for speech perception and production. 72
The evidence for the latter ‘integrated’ network view has been proposed based largely on 73
Transcranial Magnetic Stimulation (TMS) studies. TMS research has demonstrated that primary 74
motor (M1) areas for speech production activate during speech perception. This has been 75
established using single-pulse TMS to the left hemisphere to generate Motor Evoked Potentials 76
(MEPs) in speech articulators such as the lips or tongue, which serve to index the excitability of the 77
underlying motor pathway. Such studies have identified that activity in the corticobulbar motor 78
pathway from left hemisphere M1 lip and tongue regions to the respective speech muscles is 79
facilitated when perceiving speech relative to non-speech sounds (Fadiga et al., 2002; Murakami, 80
Kell, Restle, Ugawa, & Ziemann, 2015; Murakami, Restle, & Ziemann, 2012; Watkins, Strafella, & 81
Paus, 2003). This speech-specific increase in motor pathway excitability is further modulated by 82
listening difficulty, whereby speech-internal distortions, such as unfamiliar manner of speaking, as 83
well as speech-external distortions, such as background noise, have both been found to affect the 84
excitability of the left hemisphere motor pathway for speech production (Murakami, Restle, & 85
Ziemann, 2011; Nuttall, Kennedy-Higgins, Hogan, Devlin, & Adank, 2016). TMS studies have also 86
been used to disrupt activation in M1 lip area, which was found to impair perception of speech 87
sounds produced by the lips, suggesting a potentially causal role for lip M1 under ambiguous 88
4 regions have been found to be muscle-specific, with no corresponding effects on speech perception 90
or MEPs after TMS to M1 hand area (Möttönen & Watkins, 2009; Nuttall et al., 2016). 91
Although such findings are striking, articulatory M1 is not known to receive direct inputs 92
from auditory areas, raising the question of how is auditory information able to influence activity in 93
M1, when M1 is not connected to auditory temporal cortex. One candidate possibility is that effects 94
observed at M1 during speech perception are mediated by ventral premotor cortex (PMv), which is 95
thought to receive auditory inputs and is linked to temporal auditory association areas via the 96
superior longitudinal and arcuate fasciculi. Using fMRI multivariate analysis in conjunction with 97
probabilistic fibre tracking based on diffusion tensor imaging data, Saur and colleagues (2010) 98
identified that the posterior Superior Temporal Gyrus (pSTG) exhibits extensive direct interactions 99
with PMv nodes, mediated via the dorsal arcuate fasciculus/superior longitudinal fasciculus system 100
(Frey, Campbell, Pike, & Petrides, 2008; Saur et al., 2008). This temporo–premotor interaction via 101
the dorsal pathway is suggested to be important for a rapid, automated conversion of acoustic 102
representations into motor representations (Vigneau et al., 2006). 103
It has also been suggested that right PMv mediates mirror facilitation effects observed in left 104
M1 hand area, where it is thought that learned associations between multi-modal inputs at PMv 105
contribute to facilitation of the corticospinal motor pathway to the hand (Catmur, Mars, Rushworth, 106
& Heyes, 2011). In humans, the motor system governing the fingers of the hand has been found to 107
be specifically facilitated by mirror facilitation. Mirror facilitation refers to the idea that an MEP from 108
a finger muscle will be greater in size when a subject observes a movement performed involving that 109
muscle, relative to a movement involving a separate muscle. Indeed, Catmur et al (2011) observed 110
that inter-hemispheric PMv-M1 connections modulate the M1 corticospinal response to observed 111
actions, and suggest that MEP mirror facilitation may be governed by PMv. This finding also raises 112
the question of the role of inter-hemispheric connectivity in action observation. It stands to reason, 113
therefore, that articulatory M1 facilitation measured during perception of speech may be 114
underpinned by a similar PMv mechanism, if Catmur et al.’s observation can be generalised to the 115
corticobulbar motor system. However, the intra- and inter-hemispheric significance of activity in 116
articulatory motor networks during speech perception is not clear, as it has not been explored. 117
Consistent with the possibility of a (intra- or inter-hemispheric) mediating connection 118
between PMv and M1 during speech perception, a body of neuroimaging evidence indicates that 119
frontal brain areas involved in the planning and execution of speech gestures, i.e., the posterior part 120
of the left inferior frontal gyrus and the PMv are activated during passive speech perception 121
5 Disruptive TMS to left hemisphere PMv has indeed indicated a mediating role for PMv in
123
understanding speech, particularly during phonemic segmentation (Sato, Tremblay, & Gracco, 2009) 124
and syllable discrimination in background noise (Meister et al., 2007). This has led to the hypothesis 125
that PMv, during language learning, may mediate the comparison of sensory representations of 126
speech against stored articulatory productions held in repertoire, and similarly, these comparisons 127
may further assist listening in difficult environments by helping to disambiguate auditory 128
information (Sato et al., 2009) in line with M1 observations (D’Ausilio, Bufalari, Salmas, & Fadiga, 129
2012). 130
However, if, and how, PMv differentially modulates M1 activity during perception of speech 131
that is easy or challenging to understand is unknown. Correlational evidence from PET and MEPs 132
(Watkins & Paus, 2004) suggests that increased excitability of the left articulatory M1 during speech 133
perception is significantly related to an increase in blood flow to left hemisphere frontal brain area 134
BA 44 (Watkins & Paus, 2004). This led the authors to propose that BA 44 (pars opercularis of Broca’s 135
area) may directly, or indirectly via PMv, ‘prime’ the motor system during speech perception, even 136
when no speech output is required. 137
Taken together, the role of PMv in speech perception remains unclear, particularly the intra- 138
and inter-hemispheric association between PMv and articulatory M1. During effortful listening, 139
accumulating evidence from TMS, fMRI, and PET studies has demonstrated that PMv is active 140
relative to control conditions (Meister et al., 2007; Sato et al., 2009; Watkins & Paus, 2004; Wilson et 141
al., 2004). Relatedly, evidence from hand MEP studies has indicated a mediating role of PMv on M1 142
during hand action observation, indicating that PMv may govern activity in M1 during hand 143
perception. To further understand the role of PMv in speech perception, two outstanding issues 144
need to be resolved. Firstly, how does disrupting activity in PMv affect speech perception 145
behaviourally, and what effect does this disruption have on articulatory M1? Secondly, what is the 146
significance of inter-hemispheric PMv-M1 connectivity during speech perception? 147
The present study aimed to build on and extend observations from Watkins and Paus (2004), 148
by examining connectivity between left articulatory M1 and left and right PMv in two experiments. 149
The first experiment investigated intra-hemispheric connectivity between left hemisphere PMv and 150
M1 lip area during comprehension of speech under clear and distorted listening conditions. To this 151
end, continuous theta burst stimulation (cTBS) was applied to PMv to directly manipulate brain 152
activity in that region. Post-cTBS, participants performed a sentence verification task on distorted 153
(imprecisely articulated), and clear speech, whilst also undergoing single-pulse stimulation of left M1 154
lip area to elicit MEPs. In a second experiment, we investigated the role of inter-hemispheric 155
6 hemispheric inhibition TMS protocol to moderate lip MEPs, whilst subjects listened to clear and 157
distorted speech, and a no-speech control. Taken together, these experiments allowed us to assess 158
how manipulating the influence of ipsilateral and contralateral PMv impacted left hemisphere M1 lip 159
when listening to speech. 160
161
2. Method
162
2.1. Subjects 163
In Experiment 1, twenty-two subjects took part (eight males; average age: 22 years 8 months (± 164
SD 3 months); age range: 18–28 years). Four subjects could not tolerate cTBS to PMv and withdrew 165
from participation. Twenty-one subjects took part in Experiment 2 (seven males; average age: 22 166
years 6 months (± SD 3.8 months); age range: 18–30 years), two of whom had also participated in 167
Experiment 1. Three subjects could not tolerate the dual-pulse protocol to right PMv and left M1 lip, 168
and withdrew from participation. All subjects in Experiments 1 and 2 were right-handed, 169
monolingual, native speakers of British English, with normal language function and hearing 170
thresholds. Handedness was established via self-report. Pure-tone audiometric hearing thresholds 171
were established using a diagnostic audiometer (AD229b, Interacoustic A/S, Denmark) in accordance 172
with The British Society of Audiology Recommended Procedure (The British Society of Audiology, 173
2011), across 0.25, 0.5, 1, 2, 4, and 8 kHz bilaterally. All subjects had clinically normal thresholds (≤20 174
dB HL). Subjects presented no TMS contraindications as assessed by the University College London 175
TMS safety screening form. All subjects had a minimum high school-level education, with the 176
majority currently studying at University level. Experiments were undertaken with the understanding 177
and written consent of each subject, according to Research Ethics Board of University College 178
London. 179
180
2.2. Speech stimuli 181
For Experiment 1, 160 unique sentences were recorded from the Speed and Capacity of 182
Language Processing (SCOLP) stimuli set (Baddeley, Emslie, and Nimmo-Smith, 1992). The SCOLP 183
sentences are not matched for psycholinguistic variables. However, SCOLP sentences have been 184
found to be a sensitive and reliable measure of the speed of language comprehension, as errors tend 185
to be low across patient and control groups (Adank, Evans, Stuart-Smith, & Scott, 2009; Baddeley, 186
Emslie, & Nimmo-Smith, 1992; Bayre, Geffen, & McFarland, 1997). These comprised two sets of clear 187
sentences, and two sets of distorted sentences based on motor distortion (40 sentences for each 188
7 clear sentences was 2008 ms (SD 351 ms), and for distorted sentences was 2585 ms (SD 516 ms). 190
These durations reflect the natural articulation of both types of speech, with the distorted sentences 191
being more difficult and taking longer to articulate. Stimuli were presented in blocks of clear and 192
distorted sentences, with one block of each stimulus type. The order of stimulus block type was 193
counter-balanced across subjects. The SCOLP sentences are designed to be used for semantic 194
verification; are all obviously true or are false, with false sentences being based on a mismatch of 195
subject and predicate from true sentences, i.e., ‘Melons are people’. For each subject, and for each 196
stimulus type and time point (baseline or post-cTBS), a stimulus list containing forty stimuli was 197
randomly permuted, and stimuli were presented according to this order in each condition. 198
In Experiment 2, twenty vowel-consonant vowel (VCV) syllables containing an equal 199
distribution of lip- (/apa/, /aba/) tongue-articulated (/ata/, /ada/) syllables were recorded. Two sets 200
of the same twenty syllables were created: a clear set based on natural articulation, and a set based 201
on motor distortion. All stimuli were naturally produced to be of approximately the same duration 202
(mean 2864 ms) but were not synthetically manipulated to be precisely the same length. Stimuli 203
varied by a standard deviation of 573 ms. For each subject, and for each condition, a stimulus list 204
containing five occurrences of /apa/, /aba/, /ata/ and /ada/ stimuli was randomly permuted, and 205
stimuli were presented according to this order (20 stimuli in total per condition). 206
Distorted stimuli were always based on a motor distortion, where the speaker produced the 207
stimuli whilst speaking with a tongue depressor. The tongue depressor was a flat wooden spatula 208
with rounded ends, and was five inches long and one inch wide. A tongue depressor was specifically 209
chosen so as to introduce a motor-based distortion into the speech signal, to relate the speech 210
perception challenge to a speech production difficulty (for further information about these stimuli, 211
and how they are perceived, please see Nuttall et al., 2016). This enabled us to contrast clear speech 212
against distorted speech produced by the same speaker, in contrast to imposing synthetic 213
manipulations upon the spectral characteristics of the original clear speech. Clear speech comprised 214
naturally articulated, normal speech. 215
Stimuli were produced by a female British English speaker aged 27 years old for Experiment 216
1, and by a male British English speaker aged 23 for Experiment 2. Stimuli were recorded in a sound-217
attenuated room and audio digitized at 44.1 kHz with 16 bits. All stimuli were amplitude root-mean-218
square normalized offline using Praat (Boersma and Weenink, 2016), and then presented using 219
Matlab (The Mathworks, Inc., Natick, MA) through ultra-shielded insert earphones (ER-3A; Etymotic 220
Research, Inc., IL), at a comfortable listening level of around 65 dB SPL. 221
222
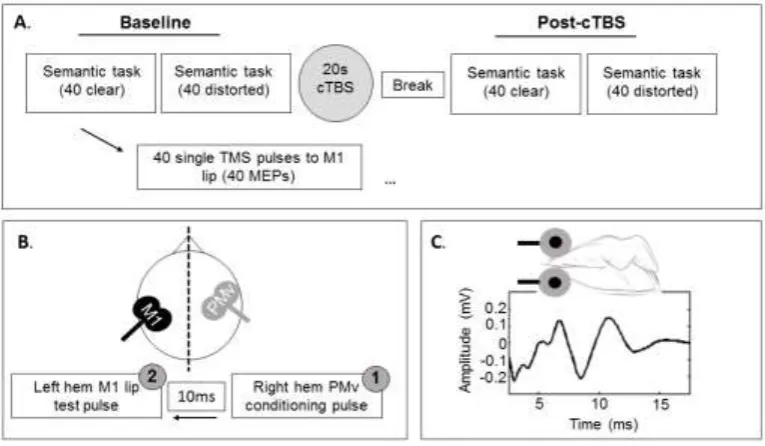
8 Two separate experiments were undertaken to assess how PMv-M1 interactions are modulated 224
when listening to clear and distorted speech, as shown in Figure 1. In Experiment 1, continuous theta 225
burst stimulation (cTBS) TMS was applied to modulate cortico-cortical interactions between left PMv 226
and left M1 lip. This allowed us to test the contribution of left PMv to lip MEPs evoked during speech 227
perception, as well as perception of the associated speech. Subjects were instructed to semantically 228
verify the sentences at baseline and post-cTBS as quickly as possible without compromising 229
accuracy. Subjects were asked to respond using the index finger of the left hand, and to press the 230
left arrow key ‘<’ if a sentence was true, and the right arrow key ’>’ if a sentence was false. The left 231
hand was used instead of the dominant right hand in order to avoid any motor preparation and 232
execution effects affecting global motor activity in left hemisphere M1. The order of experimental 233
conditions in Experiment 1 was counter-balanced. The following two experimental conditions were 234
tested: 235
236
1) Distorted: Listening to motor-distorted speech produced using a tongue depressor. 237
2) Clear: Listening to naturally articulated clear speech. 238
239
In Experiment 2, an inter-hemispheric TMS protocol was used to modulate inter-hemispheric 240
connectivity between right PMv, and left M1 lip (Chen, 2004; Ni et al., 2009). This allowed us to 241
examine if right hemisphere PMv exerts an influence over left M1 lip during speech perception. 242
Subjects were instructed to listen passively to the speech stimuli. The order of experimental 243
conditions in Experiment 2 was randomised. The following three experimental conditions were 244
tested in the inter-hemispheric double-pulse protocol and were all expressed relative to the single-245
pulse control condition, which was measured using single-pulse stimulation to left M1 lip, without 246
any auditory stimulation: 247
248
1) Distorted: Listening to motor-distorted speech produced using a tongue depressor. 249
2) Clear: Listening to naturally articulated clear speech. 250
3) No-speech Control: No auditory stimulation. 251
9 253
Figure 1. A. Schematic of the cTBS design in Experiment 1. Subjects semantically verified 40 clear 254
sentences and 40 distorted sentences at baseline. At the same time, subjects received single-pulse 255
TMS to M1 lip area. Each sentence was accompanied by one TMS pulse, generating one lip MEP per 256
sentence (example MEP given in C.). Subjects received 20 seconds of cTBS. After a 5 minute break, 257
subjects then performed the semantic verification task again with MEP measurement, as described 258
at baseline. Note that baseline measurements were performed before cTBS, as shown in A., or at the 259
end of the experiment. B. Schematic of inter-hemispheric TMS design in Experiment 2. One 260
conditioning pulse was applied at 120% aMT to right PMv (1). A test pulse was then applied after 10 261
ms at 0.5mV threshold intensity to left M1 lip area (2), generating an MEP. This procedure was 262
performed during perception of clear speech, distorted speech, and without auditory stimulation 263
(no-speech control). 264
265 266
2.4. Transcranial magnetic stimulation 267
2.4.1 MRI acquisition and co-registration 268
T1-weighted structural magnetic resonance imaging (MRI) scans were acquired using a 269
Siemens Avanto 1.5T MRI scanner and a 32 channel head coil (Siemens Healthcare, GmbH, Germany) 270
at the Birkbeck-UCL Centre for Neuroimaging (BUCNI). A structural image for each participant was 271
10 voxel size = 1x1x1mm; slices = 176]. Once obtained, the structural scans were later used in the main 273
TMS session in conjunction with Brainsight frameless stereotaxy (Rogue Research, Montreal, 274
Canada). For each participant, we performed co-registration between the participant’s head and 275
MRI using four anatomical landmarks (tip of the nose, bridge of the nose, and intertragal notch on 276
the left and right ears), which were first identified and marked on the participant’s MRI. Accuracy of 277
co-registration was assessed visually using an infrared tracking system (Polaris, Northern Digital, 278
Waterloo, Canada). Upon successful co-registration, infrared tracking was used throughout the 279
experiments in order to maintain coil position during the stimulation. 280
281
2.4.2. Motor thresholds 282
In both Experiments 1 and 2, monophasic single TMS pulses were generated by a Magstim 283
2002 unit and delivered to left M1 by a 70mm diameter figure-of-eight coil (Magstim, Dyfed, UK) set
284
to simultaneous discharge mode (inter-pulse spacing of 1 ms). The coil was placed tangential to the 285
skull at a 45 degree angle such that the induced current flowed from posterior to anterior under the 286
junction of the two wings of the figure-of-eight coil. The lip area of M1 was found by using the 287
functional ‘hot spot’ localization method, whereby application of TMS elicits an MEP from the 288
contralateral muscle. Here, the coil position on the precentral gyrus is adjusted in millimetre 289
movements to ascertain the location on the scalp at which the most robust MEPs are elicited. This 290
location was then marked on a cap and the motor threshold (MT) determined. Before finding the lip 291
area, we first located the hand area by asking subjects to perform a pinching action where the index 292
finger was held against the thumb to activate first dorsal interosseous. Following this, the lip area 293
‘hot spot’ was identified by moving the coil ventrally and slightly anterior until an MEP was observed 294
in the contralateral lip muscle. In Experiment 1, the active MT was identified, which constitutes the 295
intensity at which TMS pulses elicited 5 out of 10 MEPs with an amplitude of at least 0.2 mV during 296
20% of maximum voluntary muscle contraction (Möttönen, Rogers, & Watkins, 2014). The intensity 297
of the stimulator was then set to 120% of aMT for the single-pulse stimulations applied during the 298
experiment. The mean stimulator intensity (120% aMT ± SD) used to elicit lip MEPs in Experiment 1 299
was 51.4% (±4). 300
In Experiment, 2 a dual-pulse inter-hemispheric inhibition protocol was utilised, which 301
comprised a conditioning pulse to right PMv followed by a test pulse to left M1 lip (Chen, 2004; Ni et 302
al., 2009). First, aMT was established as detailed above in right M1 lip area, though a 50mm 303
diameter figure-of-eight coil (Magstim, Dyfed, UK) was used in thresholding, which was the same coil 304
11 2.4.3.2 for further details). However, we were unable to record robust lip MEPs from right M1 lip in 306
three subjects, who did not continue on with the study. The intensity of the TMS pulse to right PMv 307
(conditioning stimulus) was subsequently set to 120% of right M1 lip aMT (mean 61.5% ±5.7). For 308
left M1 lip, we found the hot spot using the method detailed above using a 70mm diameter figure-309
of-eight coil (Magstim, Dyfed, UK), and then set the intensity such that the TMS pulse elicited a lip 310
MEP of on average 0.5 mV in 5 out of 10 MEPs (test stimulus), without any conditioning pulse 311
stimulation, in line with inter-hemispheric inhibition protocols based on M1 hand (Di Lazzaro et al., 312
1999; Mochizuki, Huang, & Rothwell, 2004). The mean stimulation intensity for the test pulse was 313
67.6% (±5.6) of maximum stimulator output. All test pulses were applied using the 70mm coil that 314
had been used for left M1 lip thresholding. 315
316
2.4.3. TMS protocols 317
2.4.3.1. Experiment 1 318
After establishing TMS test intensity, half of the subjects then received two blocks of single-319
pulse TMS to the lip area of M1 in the left hemisphere to measure baseline MEPs during perception 320
of blocks of clear and distorted speech. This was followed immediately by 20s cTBS to PMv, and then 321
two more test blocks of single-pulse TMS to measure MEPs during perception of clear and distorted 322
blocks of speech, post-cTBS. The other half of the subjects received cTBS first, and then two test 323
blocks of single-pulse TMS during perception of clear and distorted speech to record post-cTBS 324
MEPs. This was followed by a break, and then repeated in order to record baseline MEPs during 325
perception of clear and distorted speech. The baseline MEP measurements were always performed 326
at least 30 minutes after administering cTBS to ensure that baseline performance had returned, as 327
20s of cTBS is thought to affect the brain for around 20 minutes (Huang, Edwards, Rounis, Bhatia, & 328
Rothwell, 2005). The order of baseline testing was counter-balanced to control for order effects. 329
This design mitigates against post-TMS results being confounded by practice effects. Baseline order 330
showed no significant interactions with any of the experimental variables (all p > 0.1), which 331
suggests that it is highly unlikely that cTBS contaminated the baseline data for subjects who 332
performed baseline measurements after cTBS. 333
During the single-pulse TMS test blocks, subjects were presented with the speech stimuli 334
(see Methods section 2) and were asked to semantically verify the sentences. During the 335
presentation of each speech stimulus, Matlab was used to externally trigger the TMS system at a 336
12 effects, i.e., where reaction times to the auditory stimuli is primed due to the sensation of a TMS 338
pulse occurring at a predictable time. All speech stimuli were accompanied by a TMS pulse; 339
therefore, all trials were presented with TMS. The timing of the single-pulse TMS delivery was not 340
manipulated to coincide specifically with a particular phoneme; therefore, MEPs did not represent 341
specific time-locked phoneme-based MEPs. TMS test blocks lasted for approximately 3-4 minutes, 342
allowing for the application of 40 TMS pulses per block. Single-pulse TMS was always performed 343
using a Magstim 2002 unit and delivered by a 70mm diameter figure-of-eight coil (Magstim, Dyfed,
344
UK). 345
For cTBS to PMv, a Rapid2 stimulator and 70mm diameter figure-of-eight coil (Magstim,
346
Dyfed, UK) was always used. The intensity of cTBS was fixed for all subjects at 40%, as it is not 347
feasible to record robust lip MEPs using a biphasic pulse, as delivered by the Rapid2, and nor is it
348
possible to extrapolate motor thresholds obtained using a monophasic stimulator (Magstim 2002
349
unit), to a biphasic stimulator. The stimulation site for cTBS to left PMv was based on the average 350
MNI space co-ordinate from Meister et al., 2007: -53, -4 and -49, which fell within the superior 351
portion of the PMv. This was marked in each subject’s anatomical scan using Brainsight software 352
(Rogue Research Ltd, Montreal, Canada). Across subjects, the co-ordinate fell within premotor 353
cortex, but not always within superior PMv. For the stimulation, we used 20s of cTBS in one offline 354
train of 300 pulses. cTBS is a patterned form of repetitive TMS. The standard theta burst pattern 355
consists of three pulses given in a 50 Hz burst and repeated every 200 ms (5 Hz). We allowed for a 5 356
minute interval immediately after stimulation to allow for stimulation effects to stabilise, in line with 357
published literature (Huang et al., 2005), after which the single-pulse protocol was administered. 358
359
2.4.3.2 Experiment 2 360
In Experiment 2 a dual-pulse inter-hemispheric inhibition protocol was utilised involving a 361
conditioning pulse to right PMv and a test pulse to left M1 lip. Test pulses in the dual-pulse TMS 362
conditions, and the single-pulse control TMS condition were always performed using a Magstim 2002
363
unit and delivered by a 70mm diameter figure-of-eight coil for left hemisphere stimulation. A 50mm 364
dimeter figure-of-eight coil was always used for the conditioning pulses to the right hemisphere in 365
the dual-pulse conditions (Magstim, Dyfed, UK). It was necessary to use the 50mm coil on the right 366
side of the head as two 70mm coils will not fit when both are positioned at a 45o angle tangential to
367
the skull, which we did not wish to compromise as different coil orientations target different 368
populations of neurons (D’Ostilio et al., 2016; Hannah & Rothwell, 2017). The stimulation site for the 369
13 57, 12, and 23. This was marked in each subject’s anatomical scan using Brainsight software (Rogue 371
Research Ltd, Montreal, Canada). We used a 10ms inter-pulse-interval after the conditioning pulse 372
before administering the subsequent test pulse to left M1 lip area, consistent with inter-hemispheric 373
inhibition protocols (Di Lazzaro et al., 1999; Mochizuki et al., 2004). This dual-pulse protocol was 374
always administered by two experimenters who held one coil each, as it is not feasible for one 375
experimenter to hold both coils at the same time. 376
377
2.4.4 Electromyography 378
In both Experiments 1 and 2, electromyographic (EMG) activity was recorded from the lip 379
muscle, orbicularis oris, using surface electrodes (Ag/AgCl; 10-mm diameter) in a non-Faraday caged, 380
double-walled sound-attenuating booth. Electrodes were attached to the orbicularis oris on the right 381
side of the mouth in a bipolar belly-belly montage, with an electrode placed at the right temple 382
serving as a common ground. To stabilize background EMG activity, subjects were trained for 383
approximately five minutes to produce a constant level of contraction (approximately 20% of 384
maximum voluntary contraction) of the lip muscles by pursing, which was verified via visual feedback 385
of the ongoing EMG signal (Möttönen et al., 2014; Watkins et al., 2003). Contraction of the lip 386
muscle also facilitates a lower motor threshold relative to when the muscle is at rest, enabling the 387
use of lower levels of stimulation during the experiment. The raw EMG signal was amplified by a 388
factor of 1000, band-pass filtered between 100–2000 Hz, and sampled at 5000 Hz online using a 389
1902 amplifier (Cambridge Electronic Design, Cambridge), and analog-to-digital converted using a 390
Micro1401-3 unit (Cambridge Electronic Design, Cambridge). Continuous data were acquired and 391
recorded using Spike2 software (version 8, Cambridge Electronic Design, Cambridge). 392
393
2.5. Data analysis 394
In Experiment 1, the proportion of correct responses and associated relative reaction times 395
for the distorted and clear speech pre- and post-cTBS were calculated for each individual. Reaction 396
times were expressed relative to the end of each stimulus, which shows how long after the end of 397
the stimulus a response was made. This is in contrast to expressing the response from the onset of 398
the stimulus, which does not take into account differences in stimulus length. The end of each 399
stimulus was visually identified from the waveform and spectrogram by a trained phonetician using 400
Praat software, who located the final voicing cycle of a vowel, release of a consonant, or cessation of 401
14 sweeps starting 40 ms before the TMS pulse and ending 1000 ms post-stimulation were exported 403
offline from the recording software into Matlab. Individual MEPs were identified in each trial and 404
rectified. The integrated area under the curve (AUC) of the rectified EMG signal of each individual 405
mean MEP was then calculated. In Experiment 2, dual-coil MEP ratios were calculated for by dividing 406
each dual-coil condition MEP (clear, distorted, and no-speech control) by the MEPs in the single-407
pulse no-speech control condition, to express the influence of the dual-coil protocol on MEPs 408
relative to the single-pulse baseline measure. MEP AUCs were then converted into standard scores 409
within subjects, to control for inter-subject variability. The standardized AUCs of MEPs were used in 410
the statistical analyses. The average height of the pre-TMS baseline EMG activity was also computed, 411
and paired t-tests confirmed that there were no significant differences between baseline activity 412
levels between any conditions in Experiment 1 nor 2, indicating that baseline activity did not 413
influence MEPs across conditions. 414
Statistical analyses were carried out using SPSS (version 22.0, IBM). In Experiment 1, two-415
way repeated measures analysis of variance (RMANOVA) were conducted on reaction time, 416
accuracy, and standardised MEP AUC as the dependent variables, with stimulus type (clear, 417
distorted), and time (baseline, post-cTBS), as within-subjects factors. In Experiment 2, a one-way 418
RMANOVA was conducted on standardised MEP AUC ratio, with stimulus type (clear, distorted, no-419
speech control) as the within-subject factor. Planned comparisons were subsequently computed 420
where appropriate (alpha level = .05). 421
422
3. Results
423
3.1. Experiment 1 424
3.1.1. Accuracy 425
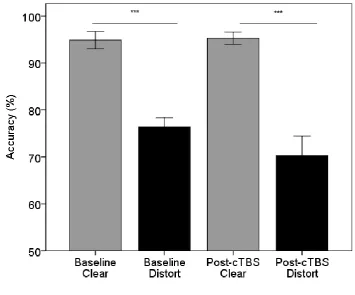
Experiment 1 tested how cTBS to left PMv affected behaviour and MEP responses from left 426
M1 lip during perception of clear and distorted speech. The mean difference in accuracy as a 427
function of time and stimulus type is shown in Figure 2. On average, there was a difference in the 428
accuracy of responses to clear and distorted speech at baseline and after cTBS. A two-way repeated 429
measures ANOVA demonstrated a significant main effect of stimulus type on accuracy (F(1,17) = 430
117.68, p < 0.001, partial eta = .87), confirming that subjects were less accurate in identifying 431
distorted stimuli (73.3%, SE 2.8%) relative to clear (95.1%, SE 1.15%). The main effect of time was 432
15 .16), indicating that cTBS did not modulate the accuracy of subjects’ responses to clear and distorted 434
stimuli. 435
[image:15.595.77.433.121.416.2]436 437
Figure 2. Average percent correct performance for clear (grey) and distorted (black) stimuli at 438
baseline and after cTBS to left PMv. Error bars represent +/- 1 SE. 439
440
3.1.2. Reaction time 441
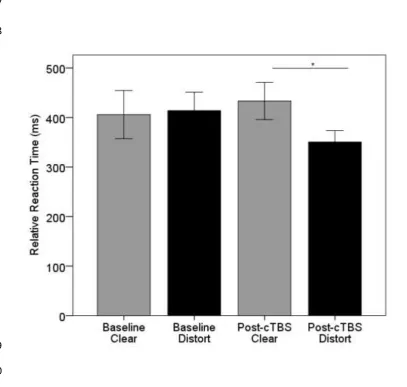
[image:15.595.48.452.145.617.2]The mean difference in reaction time as a function of time and stimulus type is shown in 442
Figure 3. On average, there was little difference between reaction times to clear and distorted 443
speech at baseline. The difference between reaction times to clear and distorted speech increased 444
after cTBS. A two-way repeated measures ANOVA found that the interaction between stimulus type 445
and time was significant (F(1,17) = 5.35; p = 0.033), suggesting that cTBS affected reaction times 446
differently depending on the type of speech stimulus perceived. Paired t-tests (two-tailed) 447
confirmed a significant difference between reaction times post-cTBS to clear and distorted speech 448
(t(17) = 2.13, p = 0.048 [clear = 433.37 ms, SE 37.45 ms; distorted = 350.43 ms, SE 23.16 ms]), which 449
was not present at baseline (t(17) = -0.22, p=0.83 [clear = 405.82 ms, SE 48.57 ms; distort = 413.94, 450
16 1.29, p = 0.27. There was a trend towards a significant reduction in reaction times post-cTBS relative 452
to baseline for distorted speech (p = 0.08 [baseline: 413.94 ms, 37.52 SE ms, post-cTBS: 350.43 ms, 453
SE 23.16 ms]), which was not evident in reaction times to clear speech post-cTBS (p = 0.4). These 454
data indicate, therefore, that the significant interaction is driven by cTBS to PMv reducing response 455
time to distorted speech specifically, without changing response time to clear stimuli. 456
457 458
[image:16.595.52.460.185.572.2]459 460
Figure 3. Average relative reaction time to clear (grey) and distorted (black) stimuli at baseline and 461
after cTBS to left PMv. Error bars represent +/-1 SE. 462
463
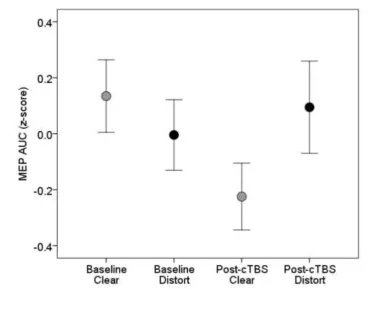
3.1.3. Effect of cTBS on Lip MEPs 464
The mean difference between MEPs elicited during perception of clear and distorted speech 465
at baseline and post-cTBS is shown in Figure 4. Two-way RMANOVA indicated that MEPs were not 466
17 interaction was also not significant (F(1,17) = .94, p = .17). These data confirmed that cTBS to PMv 468
did not influence MEPs during perception of clear or distorted stimuli. 469
470
[image:17.595.63.434.142.454.2]471 472
Figure 4. Average MEP area during perception of clear (grey) and distorted (black) speech at baseline 473
and after cTBS to left PMv. Error bars represent +/-1 SE. 474
475
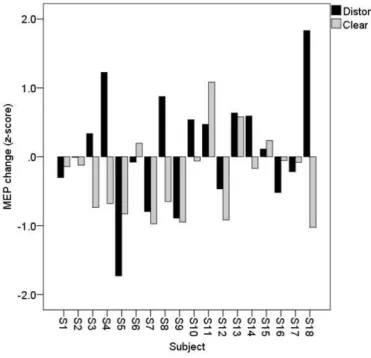
Notably, there was considerable variability in the effect of cTBS on motor excitability. Individual 476
subject’s responses to cTBS for each condition are shown for in Figure 5. In some subjects, cTBS 477
caused MEP facilitation, whereas in other subjects, cTBS caused MEP inhibition. The direction of the 478
18 480
Figure 5. Bars express individual participant’s change scores (Δ) in MEP area from baseline, to post-481
cTBS, in both Distorted (black) and Clear (grey) conditions. 482
483 484
3.2. Experiment 2 485
3.2.1. Motor Evoked Potentials 486
Experiment 2 tested how a dual-pulse inter-hemispheric inhibition protocol to right PMv 487
affected MEP responses from left M1 lip during perception of clear and distorted speech, as well as 488
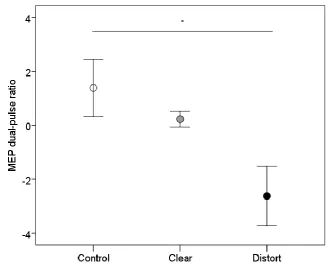
during the no-speech control condition. Mean MEP data are shown in Figure 6, where it can be 489
observed that distorted MEP data are further away from the mean than either clear or control MEP 490
data. A one-way RMANOVA indicated that there was a significant effect of stimulus type on the 491
extent of the inter-hemispheric MEP inhibition resulting from disruption of right PMv (F(1,14) = 3.5, 492
p = 0.044, partial eta squared 0.2). Planned comparisons confirmed a significant difference between 493
19 difference between control and distorted MEPs showed a trend towards a significant difference (p = 495
0.08). There was no significant difference between control MEPs and MEPs elicited during 496
perception of clear speech (p = 0.3). These data indicate that when listening to distorted speech, 497
inhibiting right PMv inhibits MEPs from left M1 lip area. These findings suggest that right PMv may 498
play a role during perception of distorted speech specifically 499
500
[image:19.595.74.403.207.486.2]501 502
Figure 6. MEP ratios following dual-pulse inter-hemispheric TMS to right PMv and left M1 lip area, 503
during perception of clear (grey) and distorted (black) speech, and no-speech control (no auditory 504
stimulation, open circle) conditions. MEP ratios were calculated by dividing each dual-coil condition 505
MEP (clear, distorted, and no-speech control) by the MEPs in the single-pulse no-speech control 506
condition, to express the influence of the dual-coil protocol on MEPs relative to the single-pulse 507
baseline measure. 508
509
4. Discussion
510
The present study aimed to investigate the intra- and inter-hemispheric influence of PMv on 511
left M1 during speech perception. Experiment 1 showed that disruption to PMv causally affected 512
20 to clear speech. Effects were specific to reaction times and not accuracy. This is in keeping with 514
previous reports of behavioural changes post-TMS, which predominantly manifest in a change in 515
response time (Devlin, Matthews, & Rushworth, 2003; Krieger-Redwood, Gaskell, Lindsay, & 516
Jefferies, 2013; Pobric, Jefferies, & Ralph, 2007; Whitney, Kirk, O’Sullivan, Lambon Ralph, & Jefferies, 517
2011). Surprisingly, MEPs were not modulated by distorted sentences, despite this form of distortion 518
modulating MEPs to pre-lexical stimuli (Nuttall, Kennedy-Higgins, Devlin, & Adank, 2017; Nuttall et 519
al., 2016). MEPs were not affected by cTBS when considered at group level. In Experiment 2, we 520
found an inter-hemispheric influence of PMv on left M1 lip MEPs. This finding was specific to the 521
distorted listening condition only, in line with the behavioural findings from Experiment 1, with no 522
modulation of control MEPs, or MEPs elicited during perception of clear speech, by right PMv. 523
However, we used syllables instead of sentences in Experiment 2, meaning that different patterns of 524
connectivity were potentially evaluated in both experiments. As such, data should be interpreted in 525
light of this methodological difference. 526
Our observation in Experiment 1 that PMv influences behavioural responses to distorted but 527
not clear speech resonates with previous findings regarding the role of PMv in speech perception. 528
Specifically, PMv may be causally involved in accurate identification and discrimination of speech 529
that is difficult to understand (Meister et al., 2007; Sato et al., 2009). Here, we demonstrate that 530
PMv also plays a role in higher-level speech comprehension. The task employed in Experiment 1 531
involved the semantic verification of sentences, relative to lower-level phonetic identification or 532
discrimination tasks that have previously been used in some PMv studies (D'Ausilio et al., 2012; 533
Krieger-Redwood et al., 2013; Meister et al., 2007; Sato et al., 2009). This is in line with previous 534
findings that point to a role of motor areas in speech comprehension (Fadiga et al., 2002; Murakami 535
et al., 2015; Schomers, Kirilina, Weigand, Bajbouj, & Pulvermüller, 2015; Watkins et al., 2003). 536
Importantly, however, previous studies that used TMS to disrupt PMv found that 537
behavioural performance became worse and not better after the stimulation, as our data might 538
suggest. One reason for this difference may be due to the effect of the TMS paradigm used, as the 539
effect of cTBS appears to vary considerably across people (Hannah, Rocchi, Tremblay, & Rothwell, 540
2016; Hordacre et al., 2016; Volz, Hamada, Rothwell, & Grefkes, 2014). In our subject sample, five 541
participants showed increased reaction times, whereas thirteen showed decreased reaction times, 542
leading to a reduction in reaction time on average. These different effects may reflect the highly 543
variable response profile associated with cTBS. Future studies should seek to replicate involvement 544
of PMv in speech comprehension paradigms using alternative TMS protocols, to further clarify the 545
role of PMv in speech perception. Furthermore, it would also be informative to pre-screen subjects 546
21 cTBS, or a facilitatory response to cTBS. This would allow for response profile to be included in the 548
design and analysis, and the influence of cTBS to be accurately measured. It cannot necessarily be 549
assumed that the same form of stimulation will affect all subjects equally, 550
Surprisingly, however, we did not observe facilitation of lip MEPs to the complex sentential 551
stimuli used. One reason for this may be that the complexity of the task, and/or stimulus type, did 552
not draw on resources from articulatory M1 in the same way that distorted syllables modulate M1 553
activity. Indeed, MEP studies observing facilitation to speech stimuli are largely based on passive 554
protocols, or low-level pre-lexical speech stimuli (Fadiga et al., 2002; Möttönen & Watkins, 2009; 555
Roy, Craighero, Fabbri-Destro, & Fadiga, 2008; Watkins et al., 2003). Therefore, it may be the case 556
that M1 is not recruited to the same extent when this type of perceptual ambiguity can be resolved 557
using other mechanisms and resources, or resolution is not solely dependent upon phonetic analysis 558
by the subject. Indeed, presence of extensive semantic top-down information, as in the semantic 559
verification task, may render phonetic analysis unnecessary. However, it should be noted that Dial & 560
Martin’s (2017) data suggest that pre-lexical access may also occur in spite of such semantic 561
information being available. Nonetheless, the lack of MEP changes by cTBS of left PMv indicates no 562
modulation of intra-hemispheric PMv-M1 connectivity on lip motor excitability, under the conditions 563
used in this experiment. 564
We also did not observe any effect of cTBS on group-level lip MEPs. This is line with previous 565
findings regarding cTBS effects on M1 lip, where MEPs were found to reveal no measurable change 566
in motor excitability following 40 seconds of cTBS (Rogers, Mottonen, Boyles, & Watkins, 2014). 567
However, in accordance with our results, Rogers and colleagues also observed an influence of cTBS 568
on behaviour, despite finding no effect of cTBS on MEPs, the lack of which they attribute to inter-569
individual variability. Indeed, we also found highly variable MEP responses to cTBS, to both types of 570
speech stimuli. This is in line with recent observations of highly variable MEP response profiles 571
following cTBS (Goldsworthy et al., 2016; Hannah et al., 2016; Hordacre et al., 2016; Vallence et al., 572
2015; Vernet et al., 2014). Whilst progress has been made in understanding the causes of MEP 573
variability (for review see Ridding & Ziemann, 2010), a large component of this variability remains 574
unexplained, and may contribute to non-significant group results after cTBS. Identifying additional 575
factors contributing to response variability is important for improving understanding of the 576
physiology underpinning MEP responses to cTBS. 577
In Experiment 2, we found that disruption of right PMv interacted with the type of speech 578
stimulus being perceived during lip MEP recording. Specifically, during perception of speech that was 579
difficult to understand, we observed that disrupting right PMv inhibited left M1 lip MEPs. This may 580
22 for distorted listening conditions, such that right PMv may be recruited when speech perception is 582
challenging. 583
Context-dependent modulation of PMv-M1 interactions has been observed intra-cortically in 584
hand action observation and execution literature. During hand action observation, PMv facilitates 585
grip-specific representations in M1, but only while grip formation is observed (de Beukelaar, Alaerts, 586
Swinnen, & Wenderoth, 2016). These findings suggest that PMv and M1 interact temporarily to 587
facilitate grip-specific representations in M1, but no sustained input from PMv to M1 seems to be 588
required to maintain action representations that are anticipated based on contextual information or 589
once the grip is formed. These findings are also in line with the intra-hemispheric relationship 590
between PMv and M1 during hand action execution, where it is known that PMv-M1 interactions are 591
selectively modulated during specific types of grasp (Davare, Lemon, & Olivier, 2008). Considerably 592
less, however, is known about modulation of inter-hemispheric PMv-M1 interactions during action 593
observation. 594
Taken together, data from Experiments 1 and 2 highlight several findings with regards to the 595
and inter-hemispheric influence of PMv during speech perception. With respect to intra-596
hemispheric effects, we observed a reduction in reaction time to distorted speech specifically in 597
Experiment 1. There was no corresponding effect on clear speech. TMS timing was jittered 598
substantially for both types of stimuli, which should mitigate against a general inter-sensory 599
explanation for this TMS effect, though we cannot rule it out completely. The influence of cTBS to 600
PMv on lip MEPs appeared to be bidirectional; i.e., for some subjects, cTBS suppressed MEPs, 601
whereas for other subjects, cTBS facilitated MEPs. Due to this difference in response profile, the net 602
effect of the cTBS influence is obscured when considered at group-level. With regards to the inter-603
hemispheric influence of right PMv on left M1, we observed a specific pattern of results that 604
indicated an involvement of right PMv in the sensorimotor network only under distorted listening 605
conditions. This differed from the MEP results from Experiment 1, where there was no difference 606
between clear and distorted speech, and suggests the PMv-M1 intra-hemispheric interactions may 607
be relevant for both clear and distorted speech perception, but PMv-M1 inter-hemispheric 608
interactions are influential only during perception of distorted speech. In other words, the entire 609
system for speech perception works harder when listening becomes more difficult. As we did not 610
measure behavioural responses in Experiment 2, we cannot attest to the necessity of right PMv in 611
perception of distorted speech. It must be noted, however, that our interpretation of PMv is based 612
on two protocols that use different speech stimuli. For a full understanding of the role of PMv in 613
speech perception, future work should seek to use different types of speech stimuli within the same 614
23 Data presented within this paper feed into speech perception models that are characterised 616
by reverberant, bilateral speech-motor circuits, which adapt dynamically based on context. As 617
emphasised by Skipper and colleagues (Skipper et al., 2017), it is not the case that the 618
neurobiological network for speech perception should be conceived of as fixed, as one might 619
interpret from dual stream models (Hickok, 2012). It is indeed unambiguous that the brain is 620
adaptable and highly plastic. Likewise, we are in agreement with Skipper and colleagues that it is 621
equally possible that multiple permutations of different speech perception and speech production 622
brain networks exist. The specifics of which particular network is brought online will be most likely 623
moderated by context demands. For example, the engagement of a particular speech perception 624
network is highly dependent on listening difficulty. This is evidenced by how clear and distorted 625
speech differentially modulate intra-cortical and inter-cortical PMv-M1 interactions, which may 626
reflect the influence of PMv operating within two different types of neurobiological networks, 627
dependent upon the auditory stimulus. 628
The functional role of PMv and articulatory M1 regions in speech perception and language 629
comprehension is likely to help disambiguate auditory information that is hard to understand. Under 630
this interpretation, motor regions provide a supportive, but perhaps not essential role, relative to 631
how they have been measured in the present study. The size of the effects reported here may also 632
corroborate the suggestion that motor regions play a supportive, but non-essential role. However, 633
given that the involvement of motor regions is likely to adapt dynamically in response to situational 634
demands, the role of motor regions should not be considered fixed, and may increase in influence 635
depending on the listening context. Neurobiological interactions, of course, do not map neatly onto 636
behavioural relevance, which we believe poses a different question (for extensive treatment see 637
Schomers & Pulvermüller, 2016). 638
In summary, the present study explored whether PMv exerts an influence intra-cortically, 639
and inter-cortically, during perception of speech that is easy or challenging to understand. Data 640
indicated that left PMv may exert online influence over perception of distorted speech. We also 641
found evidence to suggest that right PMv influences left M1 lip only when listening conditions are 642
challenging. These data support bilateral models of speech perception, where sensorimotor 643
interaction is adaptive depending upon context and stimulus (Schomers & Pulvermüller, 2016; 644
Skipper et al., 2017). 645
24
Acknowledgements
648
This work was supported by a Project Grant from The Leverhulme Trust (RPG-2013-13 254). Our 649
thanks go to The Leverhulme Trust, and the individuals who participated in this study. 650
651
References
652 653
Baddeley, A. D., Emslie, H., and Nimmo-Smith, I. (1992). The speed and capacity of language 654
processing (SCOLP) test. Bury St Edmunds: Thames Valley Test Company. 655
Catmur, C., Mars, R. B., Rushworth, M. F., & Heyes, C. (2011). Making mirrors: premotor cortex 656
stimulation enhances mirror and counter-mirror motor facilitation. Journal of Cognitive 657
Neuroscience, 23(9), 2352–62. http://doi.org/10.1162/jocn.2010.21590 658
Chen, R. (2004). Interactions between inhibitory and excitatory circuits in the human motor cortex. 659
Experimental Brain Research. Retrieved from http://link.springer.com/article/10.1007/s00221-660
003-1684-1 661
D’Ausilio, A., Bufalari, I., Salmas, P., & Fadiga, L. (2012). The role of the motor system in 662
discriminating normal and degraded speech sounds. Cortex, 48(7), 882–887. 663
http://doi.org/10.1016/j.cortex.2011.05.017 664
D’Ostilio, K., Goetz, S. M., Hannah, R., Ciocca, M., Chieffo, R., Chen, J.-C. A., … Rothwell, J. C. (2016). 665
Effect of coil orientation on strength-duration time constant and I-wave activation with 666
controllable pulse parameter transcranial magnetic stimulation. Clinical Neurophysiology : 667
Official Journal of the International Federation of Clinical Neurophysiology, 127(1), 675–83. 668
http://doi.org/10.1016/j.clinph.2015.05.017 669
Davare, M., Lemon, R., & Olivier, E. (2008). Selective modulation of interactions between ventral 670
premotor cortex and primary motor cortex during precision grasping in humans. The Journal of 671
Physiology, 586(11), 2735–2742. http://doi.org/10.1113/jphysiol.2008.152603 672
de Beukelaar, T. T., Alaerts, K., Swinnen, S. P., & Wenderoth, N. (2016). Motor facilitation during 673
action observation: The role of M1 and PMv in grasp predictions. Cortex, 75, 180–192. 674
http://doi.org/10.1016/j.cortex.2015.11.009 675
Devlin, J. T., Matthews, P. M., & Rushworth, M. F. S. (2003). Semantic Processing in the Left Inferior 676
Prefrontal Cortex: A Combined Functional Magnetic Resonance Imaging and Transcranial 677
Magnetic Stimulation Study. Journal of Cognitive Neuroscience, 15(1), 71–84. 678
http://doi.org/10.1162/089892903321107837 679
Dial, H., & Martin, R. (2017). Evaluating the relationship between sublexical and lexical processing in 680
speech perception: Evidence from aphasia. Neuropsychologia, 96, 192–212. 681
http://doi.org/10.1016/j.neuropsychologia.2017.01.009 682
Di Lazzaro, V., Insola, A., Mazzone, P., Tonali, P., Rothwell, J. C., Profice, P., & Oliviero, A. (1999). 683
Direct demonstration of interhemispheric inhibition of the human motor cortex produced by 684
transcranial magnetic stimulation. Experimental Brain Research, 124(4), 520–524. 685
25 Fadiga, L., Craighero, L., Buccino, G., & Rizzolatti, G. (2002). Speech listening specifically modulates 687
the excitability of tongue muscles: A TMS study. European Journal of Neuroscience, 15(2), 399– 688
402. 689
Frey, S., Campbell, J. S. W., Pike, G. B., & Petrides, M. (2008). Dissociating the human language 690
pathways with high angular resolution diffusion fiber tractography. The Journal of 691
Neuroscience : The Official Journal of the Society for Neuroscience, 28(45), 11435–44. 692
http://doi.org/10.1523/JNEUROSCI.2388-08.2008 693
Goldsworthy, M. R., Vallence, A.-M., Hodyl, N. A., Semmler, J. G., Pitcher, J. B., & Ridding, M. C. 694
(2016). Probing changes in corticospinal excitability following theta burst stimulation of the 695
human primary motor cortex. Clinical Neurophysiology, 127(1), 740–747. 696
http://doi.org/10.1016/j.clinph.2015.06.014 697
Hannah, R., Rocchi, L., Tremblay, S., & Rothwell, J. C. (2016). Controllable Pulse Parameter TMS and 698
TMS-EEG As Novel Approaches to Improve Neural Targeting with rTMS in Human Cerebral 699
Cortex. Frontiers in Neural Circuits, 10, 97. http://doi.org/10.3389/fncir.2016.00097 700
Hannah, R., & Rothwell, J. C. (2017). Pulse Duration as Well as Current Direction Determines the 701
Specificity of Transcranial Magnetic Stimulation of Motor Cortex during Contraction. Brain 702
Stimulation, 10(1), 106–115. http://doi.org/10.1016/j.brs.2016.09.008 703
Hickok, G. (2012). The cortical organization of speech processing: Feedback control and predictive 704
coding the context of a dual-stream model. Journal of Communication Disorders, 45(6), 393– 705
402. http://doi.org/10.1016/j.jcomdis.2012.06.004 706
Hickok, G., Houde, J., & Rong, F. (2011). Sensorimotor integration in speech processing: 707
computational basis and neural organization. Neuron, 69(3), 407–22. 708
http://doi.org/10.1016/j.neuron.2011.01.019 709
Hordacre, B., Goldsworthy, M. R., Vallence, A.-M., Darvishi, S., Moezzi, B., Hamada, M., … Ridding, M. 710
C. (2016). Variability in neural excitability and plasticity induction in the human cortex: A brain 711
stimulation study. Brain Stimulation. http://doi.org/10.1016/j.brs.2016.12.001 712
Huang, Y.-Z., Edwards, M. J., Rounis, E., Bhatia, K. P., & Rothwell, J. C. (2005). Theta burst stimulation 713
of the human motor cortex. Neuron, 45(2), 201–6. 714
http://doi.org/10.1016/j.neuron.2004.12.033 715
Krieger-Redwood, K., Gaskell, M. G., Lindsay, S., & Jefferies, E. (2013). The Selective Role of Premotor 716
Cortex in Speech Perception: A Contribution to Phoneme Judgements but not Speech 717
Comprehension. Journal of Cognitive Neuroscience, 25(12), 2179–2188. 718
http://doi.org/10.1162/jocn_a_00463 719
Liberman, & Whalen. (2000). On the relation of speech to language. Trends in Cognitive Sciences, 720
4(5), 187–196. Retrieved from http://www.ncbi.nlm.nih.gov/pubmed/10782105 721
Meister, Wilson, Deblieck, & Wu. (2007). Report The Essential Role of Premotor Cortex in Speech 722
Perception. Current Biology, 17(19), 1692–1696. http://doi.org/10.1016/j.cub.2007.08.064 723
Mochizuki, H., Huang, Y.-Z., & Rothwell, J. C. (2004). Interhemispheric interaction between human 724
dorsal premotor and contralateral primary motor cortex. The Journal of Physiology, 561(1), 725
331–338. http://doi.org/10.1113/jphysiol.2004.072843 726
Möttönen, R., Rogers, J., & Watkins, K. E. (2014). Stimulating the lip motor cortex with transcranial 727
magnetic stimulation. Journal of Visualized Experiments : JoVE, (88). 728
26 Möttönen, R., & Watkins, K. E. (2009). Motor representations of articulators contribute to
730
categorical perception of speech sounds. The Journal of Neuroscience : The Official Journal of 731
the Society for Neuroscience, 29(31), 9819–9825. http://doi.org/10.1523/JNEUROSCI.6018-732
08.2009 733
Murakami, T., Kell, C. A., Restle, J., Ugawa, Y., & Ziemann, U. (2015). Left Dorsal Speech Stream 734
Components and Their Contribution to Phonological Processing. Journal of Neuroscience, 35(4), 735
1411–1422. http://doi.org/10.1523/JNEUROSCI.0246-14.2015 736
Murakami, T., Restle, J., & Ziemann, U. (2011). Observation-execution matching and action inhibition 737
in human primary motor cortex during viewing of speech-related lip movements or listening to 738
speech. Neuropsychologia, 49(7), 2045–2054. 739
http://doi.org/10.1016/j.neuropsychologia.2011.03.034 740
Murakami, T., Restle, J., & Ziemann, U. (2012). Effective connectivity hierarchically links 741
temporoparietal and frontal areas of the auditory dorsal stream with the motor cortex lip area 742
during speech perception. Brain and Language, 122(3), 135–141. 743
http://doi.org/10.1016/j.bandl.2011.09.005 744
Ni, Z., Gunraj, C., Nelson, A. J., Yeh, I.-J., Castillo, G., Hoque, T., & Chen, R. (2009). Two Phases of 745
Interhemispheric Inhibition between Motor Related Cortical Areas and the Primary Motor 746
Cortex in Human. Cerebral Cortex, 19(7), 1654–1665. http://doi.org/10.1093/cercor/bhn201 747
Nuttall, H. E., Kennedy-Higgins, D., Devlin, J. T., & Adank, P. (2017). The role of hearing ability and 748
speech distortion in the facilitation of articulatory motor cortex. Neuropsychologia, 94, 13–22. 749
http://doi.org/10.1016/j.neuropsychologia.2016.11.016 750
Nuttall, H. E., Kennedy-Higgins, D., Hogan, J., Devlin, J. T., & Adank, P. (2015). The effect of speech 751
distortion on the excitability of articulatory motor cortex. NeuroImage. 752
http://doi.org/10.1016/j.neuroimage.2015.12.038 753
Nuttall, H. E., Kennedy-Higgins, D., Hogan, J., Devlin, J. T., & Adank, P. (2016). The effect of speech 754
distortion on the excitability of articulatory motor cortex. NeuroImage, 128, 218–226. 755
http://doi.org/10.1016/j.neuroimage.2015.12.038 756
Pobric, G., Jefferies, E., & Ralph, M. A. L. (2007). Anterior temporal lobes mediate semantic 757
representation: Mimicking semantic dementia by using rTMS in normal participants. 758
Proceedings of the National Academy of Sciences, 104(50), 20137–20141. 759
http://doi.org/10.1073/pnas.0707383104 760
Pulvermüller, F., Huss, M., Kherif, F., Moscoso del Prado Martin, F., Hauk, O., & Shtyrov, Y. (2006). 761
Motor cortex maps articulatory features of speech sounds. Proceedings of the National 762
Academy of Sciences of the United States of America, 103(20), 7865–70. 763
http://doi.org/10.1073/pnas.0509989103 764
Ridding, M. C., & Ziemann, U. (2010). Determinants of the induction of cortical plasticity by non-765
invasive brain stimulation in healthy subjects. The Journal of Physiology, 588(Pt 13), 2291–304. 766
http://doi.org/10.1113/jphysiol.2010.190314 767
Rogers, J. C., Möttönen, R., Boyles, R., & Watkins, K. E. (2014). Discrimination of speech and non-768
speech sounds following theta-burst stimulation of the motor cortex. Frontiers in Psychology, 5, 769
754. http://doi.org/10.3389/fpsyg.2014.00754 770
Roy, A. C., Craighero, L., Fabbri-Destro, M., & Fadiga, L. (2008). Phonological and lexical motor 771
facilitation during speech listening: A transcranial magnetic stimulation study. Journal of 772
27 Sato, M., Tremblay, P., & Gracco, V. L. (2009). A mediating role of the premotor cortex in phoneme 774
segmentation. Brain and Language, 111(1), 1–7. http://doi.org/10.1016/j.bandl.2009.03.002 775
Saur, D., Kreher, B. W., Schnell, S., Kummerer, D., Kellmeyer, P., Vry, M.-S., … Weiller, C. (2008). 776
Ventral and dorsal pathways for language. Proceedings of the National Academy of Sciences, 777
105(46), 18035–18040. http://doi.org/10.1073/pnas.0805234105 778
Saur, D., Schelter, B., Schnell, S., Kratochvil, D., Küpper, H., Kellmeyer, P., … Weiller, C. (2010). 779
Combining functional and anatomical connectivity reveals brain networks for auditory language 780
comprehension. NeuroImage, 49(4), 3187–97. 781
http://doi.org/10.1016/j.neuroimage.2009.11.009 782
Schomers, M. R., Kirilina, E., Weigand, A., Bajbouj, M., & Pulvermüller, F. (2015). Causal Influence of 783
Articulatory Motor Cortex on Comprehending Single Spoken Words: TMS Evidence. Cerebral 784
Cortex (New York, N.Y. : 1991), 25(10), 3894–902. http://doi.org/10.1093/cercor/bhu274 785
Schomers, M. R., & Pulvermüller, F. (2016). Is the Sensorimotor Cortex Relevant for Speech 786
Perception and Understanding? An Integrative Review. Frontiers in Human Neuroscience, 10, 787
435. http://doi.org/10.3389/fnhum.2016.00435 788
Silbert, L. J., Honey, C. J., Simony, E., Poeppel, D., & Hasson, U. (2014). Coupled neural systems 789
underlie the production and comprehension of naturalistic narrative speech. Proceedings of the 790
National Academy of Sciences of the United States of America, 111(43), E4687-96. 791
http://doi.org/10.1073/pnas.1323812111 792
Skipper, J. I., Devlin, J. T., & Lametti, D. R. (2017). The hearing ear is always found close to the 793
speaking tongue: Review of the role of the motor system in speech perception. Brain and 794
Language, 164, 77–105. http://doi.org/10.1016/j.bandl.2016.10.004 795
Skipper, J. I., Nusbaum, H. C., & Small, S. L. (2005). Listening to talking faces: motor cortical 796
activation during speech perception. NeuroImage, 25(1), 76–89. 797
http://doi.org/10.1016/j.neuroimage.2004.11.006 798
Vallence, A.-M., Goldsworthy, M. R., Hodyl, N. A., Semmler, J. G., Pitcher, J. B., & Ridding, M. C. 799
(2015). Inter- and intra-subject variability of motor cortex plasticity following continuous theta-800
burst stimulation. Neuroscience, 304, 266–278. 801
http://doi.org/10.1016/j.neuroscience.2015.07.043 802
Vernet, M., Bashir, S., Yoo, W.-K., Oberman, L., Mizrahi, I., Ifert-Miller, F., … Pascual-Leone, A. (2014). 803
Reproducibility of the effects of theta burst stimulation on motor cortical plasticity in healthy 804
participants. Clinical Neurophysiology, 125(2), 320–326. 805
http://doi.org/10.1016/j.clinph.2013.07.004 806
Vigneau, M., Beaucousin, V., Hervé, P. Y., Duffau, H., Crivello, F., Houdé, O., … Tzourio-Mazoyer, N. 807
(2006). Meta-analyzing left hemisphere language areas: phonology, semantics, and sentence 808
processing. NeuroImage, 30(4), 1414–32. http://doi.org/10.1016/j.neuroimage.2005.11.002 809
Volz, L. J., Hamada, M., Rothwell, J. C., & Grefkes, C. (2014). What Makes the Muscle Twitch: Motor 810
System Connectivity and TMS-Induced Activity. Cerebral Cortex (New York, N.Y. : 1991), (Friston 811
1994), 1–8. http://doi.org/10.1093/cercor/bhu032 812
Watkins, K. E., Strafella, A. P., & Paus, T. (2003). Seeing and hearing speech excites the motor 813
system involved in speech production. Neuropsychologia, 41(8), 989–994. 814
http://doi.org/10.1016/S0028-3932(02)00316-0 815
Watkins, K. E., & Paus, T. (2004). Modulation of Motor Excitability during Speech Perception: The 816
28 http://doi.org/10.1162/0898929041502616
818
Whitney, C., Kirk, M., O’Sullivan, J., Lambon Ralph, M. A., & Jefferies, E. (2011). The neural 819
organization of semantic control: TMS evidence for a distributed network in left inferior frontal 820
and posterior middle temporal gyrus. Cerebral Cortex (New York, N.Y. : 1991), 21(5), 1066–75. 821
http://doi.org/10.1093/cercor/bhq180 822
Wilson, S. M., & Iacoboni, M. (2006). Neural responses to non-native phonemes varying in 823
producibility: evidence for the sensorimotor nature of speech perception. NeuroImage, 33(1), 824
316–25. http://doi.org/10.1016/j.neuroimage.2006.05.032 825
Wilson, S. M., Saygin, A. P., Sereno, M. I., & Iacoboni, M. (2004). Listening to speech activates motor 826
areas involved in speech production. Nature Neuroscience, 7(7), 701–2. 827
http://doi.org/10.1038/nn1263 828