warwick.ac.uk/lib-publications
Manuscript version: Author’s Accepted ManuscriptThe version presented in WRAP is the author’s accepted manuscript and may differ from the published version or Version of Record.
Persistent WRAP URL:
http://wrap.warwick.ac.uk/111521 How to cite:
Please refer to published version for the most recent bibliographic citation information. If a published version is known of, the repository item page linked to above, will contain details on accessing it.
Copyright and reuse:
The Warwick Research Archive Portal (WRAP) makes this work by researchers of the University of Warwick available open access under the following conditions.
Copyright © and all moral rights to the version of the paper presented here belong to the individual author(s) and/or other copyright owners. To the extent reasonable and
practicable the material made available in WRAP has been checked for eligibility before being made available.
Copies of full items can be used for personal research or study, educational, or not-for-profit purposes without prior permission or charge. Provided that the authors, title and full
bibliographic details are credited, a hyperlink and/or URL is given for the original metadata page and the content is not changed in any way.
Publisher’s statement:
Please refer to the repository item page, publisher’s statement section, for further information.
1
Title page
Musculoskeletal pain in adults born preterm: Evidence from two birth
cohort studies
Running head/short title:Musculoskeletal pain in adults born preterm
KAI Evensen,a,b,c, M Tikanmäki,d,e K Heinonen,f HM Matinolli,d,g M Sipola-Leppänen,d,e,h A
Lano,i D Wolke,j M Vääräsmäki,d,h JG Eriksson,d,k,l S Andersson,i MR Järvelin,e,m P Hovi,d K
Räikkönen,f, E Kajantie,a,d,h,i
Affiliations:
aDepartment of Clinical and Molecular Medicine, Norwegian University of Science and
Technology, Trondheim, Norway; bDepartment of Public Health and Nursing, Norwegian
University of Science and Technology, Trondheim, Norway; cDepartment of Physiotherapy,
Trondheim Municipality, Trondheim, Norway; dDepartment of Public Health Solutions,
National Institute for Health and Welfare, Oulu and Helsinki, Finland; eInstitute of Health
Sciences, University of Oulu, Oulu, Finland; fDepartment of Psychology and Logopedics,
University of Helsinki, Helsinki, Finland; gDepartment of Nursing Science, University of
Turku, Turku, Finland; hPEDEGO Research Unit (Research Unit for Pediatrics, Dermatology,
Clinical Genetics, Obstetrics and Gynecology), Medical Research Center Oulu (MRC Oulu),
Oulu University Hospital and University of Oulu, Oulu, Finland; iChildren’s Hospital,
Helsinki University Central Hospital and University of Helsinki, Helsinki, Finland;
jDepartment of Psychology, University of Warwick, Coventry, United Kingdom;
kDepartment of General Practice and Primary Health Care, University of Helsinki and
2 Finland; mDepartment of Epidemiology and Biostatistics, Imperial College, London, United
Kingdom
Corresponding author: Kari Anne I. Evensen, Department of Clinical and Molecular
Medicine, Norwegian University of Science and Technology, PO Box 8905 MTFS, NO-7491
Trondheim, Norway, + 47 977 33 635, karianne.i.evensen@ntnu.no
The manuscript is submitted as Original Article
Funding sources:
AYLS childhood follow-up was financially supported by the Bundesministerium für
Forschung und Technik (Federal Goverment of Germany, Ministry of Science and
Technology) program grants PKE 4 and JUG 14 (FKZ’s 0706224, 0706564 and 01EP9504)
to Drs Riegel, Wolke, and Ohrt; AYLS adulthood follow-up was financially supported by the
Academy of Finland program grants to Drs Eriksson, Raikkonen and Kajantie; The work by
Dr Heinonen was supported by Academy of Finland post-doctoral grant;Dr Eriksson was
supported also by grant from Samfundet Folkhälsan; Dr Andersson from Päivikki and Sakari
Sohlberg Foundation and Finska Läkaresällskapet; and Dr Kajantie by Foundation for
Pediatric Research, Juho Vainio Foundation, Novo Nordisk Foundation, Signe and Ane
Gyllenberg Foundation, Sigrid Jusélius Foundation. The work of Drs Wolke, Räikkönen and
Kajantie was supported by European Commission Horizon 2020 Award
(SC1-2016-RTD-733280 RECAP).
Conflict of interest: The authors have no conflicts of interest to disclose.
Significance: Young adults born preterm do not have increased rates of musculoskeletal
pain. Our findings rather suggest that these rates may be slightly lower than among those
3
Abstract
Background: Individuals born preterm are at risk for later developmental problems and
long-term morbidities. There is conflicting evidence regarding musculoskeletal pain in young
adulthood. We investigated the prevalence of self-reported musculoskeletal pain in young
adults born across the range of preterm birth compared with a term-born reference group.
Methods: From two Finnish birth cohorts, 184 individuals born early preterm (<34 weeks),
350 late preterm (34 to <37 weeks), and 641 at term completed a self-report questionnaire of
musculoskeletal pain at mean age 24.1 (SD1.4) years. Group differences were examined by
logistic regression models adjusting for sex, age and cohort (Model 1), potential early life
confounders (Model 2), and lifestyle factors related to physical (Model 3) and mental health
(Model 4).
Results: The late preterm group had lower odds for reporting neck pain (0.73; 95%
confidence interval (CI): 0.56-0.96), which was further reduced when adjusting for early life
confounders and lifestyle factors (Model 4). Odds for reporting peripheral pain was 0.69
(95% CI: 0.48-0.99, Model 4) in the early preterm group. The odds for reporting any pain,
shoulder, low back or widespread pain did not differ significantly between groups, although
odds for reporting widespread pain was 0.77 (95% CI: 0.58-1.03, Model 4) in the late preterm
group.
Conclusions: We did not find evidence of increased prevalence ofmusculoskeletal pain in
adults born early or late preterm. In contrast, our results suggest that adults born preterm have
a slightly lower risk for reporting musculoskeletal pain, also when we adjusted for lifestyle
4
Introduction
Musculoskeletal conditions, especially low back and neck pain, constitute one of the leading
causes of disability globally, accounting for 12% of years lived with disability in 2015 (GBD
2015 Disease and Injury Incidence and Prevalence Collaborators 2016). Although localized
musculoskeletal pain does exist, pain in any body region is frequently associated with pain in
other regions. This may also give rise to functional limitations (Kamaleri et al. 2008).
Musculoskeletal pain and symptoms are frequent in the general population, with a prevalence
ranging from 70% for adults with a recall period of one week (Kamaleri et al. 2008),
increasing up to 95% during a lifetime (Baldwin et al. 2017). The pathophysiology is not
clear and some speculate whether early life conditions may influence development of pain
(Beggs et al. 2012, Walker 2017).
Worldwide, 11.1% of children are born preterm, i.e. prior to 37 weeks of gestation (Blencowe
et al. 2012). Most of these neonates survive, but there is an increased risk of later
developmental problems and long-term morbidities (Aarnoudse-Moens et al. 2009, Raju et al.
2017). In particular those born very preterm (before week 32 of gestation) undergo multiple
invasive pain procedures including intubation, intravenous or intra-arterial cannula and, in
high-resource settings, most preterm infants undergo frequent blood sampling (Grunau 2013).
Such early pain exposure has raised concern about long-term hypersensitivity to pain.
Previous studies on pain sensitivity and self-reported pain in individuals born preterm are
inconsistent. Some experimental studies have demonstrated increased sensitivity to tender
points (Buskila et al. 2003), heat (Hermann et al. 2006) and cold (Vederhus et al. 2012) in
children and adolescents born very preterm/at very low birth weight (VLBW: <1500g) or at
5 In ELBW children and adolescents, as well as in ELBW and VLBW adults, there are self-
and parent-reports of lesser (Grunau, Whitfield and Petrie 1994a), equal (Cooke 2004,
Vederhus et al. 2012, Buskila et al. 2003, Walker et al. 2009, Baumgardt et al. 2012, Husby
et al. 2016, Batsvik et al. 2015, Grunau, Whitfield and Petrie 1998, Saigal et al. 2006, Lund et
al. 2012) and higher (Saigal et al. 1996, Iversen et al. 2017, Grunau et al. 1994b, Husby et al.
2016) levels of pain and somatic complaints. Also in children born 32-35 weeks of gestation,
the risk for somatic complaints was reported to be almost twice as high when compared with
term-born children (Potijk et al. 2012). Larger studies examining musculoskeletal pain in
adolescents and adults across the whole range of preterm birth have not been able to
demonstrate consistent associations with chronic or non-chronic pain (Iversen et al. 2015,
Mallen et al. 2006, Littlejohn et al. 2012). One study has even reported lower risk of low
back pain in 12-22 year old males with low birth weight (LBW: <2500g) (Hestbaek et al.
2003).
The prevalence and experience of musculoskeletal pain may undergo age-related changes
(Baldwin et al. 2017, GBD 2015 Disease and Injury Incidence and Prevalence Collaborators
2016). Previous studies on pain in preterm individuals have mainly been conducted in
children (Grunau et al. 1994a, Grunau et al. 1994b, Saigal et al. 1996, Grunau et al. 1998,
Hermann et al. 2006, Potijk et al. 2012, Valeri et al. 2016, Walker et al. 2009) and
adolescents (Buskila et al. 2003, Batsvik et al. 2015, Saigal et al. 1996, Hohmeister et al.
2010, Vederhus et al. 2012, Iversen et al. 2015) or in mixed populations comprising both
adolescents and adults (Mallen et al. 2006, Hestbaek et al. 2003). As studies in adulthood
yield mixed findings (Littlejohn et al. 2012, Husby et al. 2016, Iversen et al. 2017, Cooke
2004, Baumgardt et al. 2012, Saigal et al. 2006), it still remains unclear whether individuals
6 aimed to investigate the prevalence of self-reported musculoskeletal pain in two birth cohorts
of young adults born across the whole range of prematurity and a reference group born at
term.
Participants and Methods
Study design
The study participants were recruited from two separate birth cohorts in Finland; the Preterm
Birth and Early-Life Programming of Adult Health and Disease (ESTER) Preterm Birth
Study (Sipola-Leppänen et al. 2015) and the Arvo Ylppö Longitudinal Study (AYLS)
(Heinonen et al. 2008) (Figure 1).
The ESTER Preterm Birth cohort comprised 1980 individuals born in the two northernmost
provinces of Finland between 1985 and 1989, and aimed to explore effects of early (<34
weeks of gestational age: GA) and late (34 to <37 weeks of GA) preterm birth on health and
well-being in young adult life. Young adults born preterm (<37 weeks of GA) were traced
through Northern Finland Birth Cohort 1986 (NFBC, births 1985-1986) or Finnish Medical
Birth Registry (FMBR, births 1987-1989 in the same geographical area) and a term-born
reference group was randomly selected from the same source population.
The original AYLS cohort comprised 2193 individuals born between March 14 1985 and
March 15 1986 in the province of Uusimaa in Southern Finland. They comprised 1535
infants born alive and admitted to neonatal wards of the birth hospitals or transferred to the
Neonatal Intensive Care Unit of the Children’s Hospital, University of Helsinki and Helsinki
7 illness and born after every second admitted infant in one of the three largest maternity
hospitals in the area.
In young adult age, individuals from both studies were invited to a clinical examination,
including a self-report pain questionnaire. Both studies were approved by the Coordinating
Ethics Committee at Helsinki and Uusimaa Hospital District, and all participants gave written
informed consent according to the Helsinki Declaration.
Participants
Of the 1980 invited individuals in the ESTER Preterm Birth cohort, 779 (39.3%) took part in
a clinical examination between 2009 and 2011 (Figure 1); 152 were born early preterm, 266
late preterm and 361 at term. Length of gestation was confirmed from medical records in 149
early preterm, 248 late preterm and 356 term-born participants. Of these, 143 born early
preterm, 240 born late preterm and 345 term-born participants answered the pain
questionnaire.
Of the 2193 individuals in the AYLS cohort, 1913 were invited and 1136 (51.8% of original
cohort) took part in a clinical examination between 2009 and 2012. As in previous
ESTER-AYLS publications (Matinolli et al. 2016, Bjorkqvist et al. 2018), we included as term
controls only individuals from the group not admitted to neonatal ward (see Study design
above), because the admitted group represents a range of prenatal and neonatal adversities not
representative of those born at term. Length of gestation was confirmed from medical records
for 489 individuals who gave their permission; 46 were born early preterm, 129 late preterm
and 314 were born at term. Of these, 41 born early preterm, 110 born late preterm and296
8 In total, we report results on 1175 participants; 184 born early preterm, 350 late preterm and
641 at term (reference group). Detailed non-participation analyses have been published
(Sipola-Leppänen et al. 2015, Matinolli et al. 2016).
Musculoskeletal pain
The participants completed a self-report questionnaire of musculoskeletal pain during the last
six months, in which they were asked if they had had any aches or pains during the last six
months in the following areas of the body: Head, neck, shoulders, low back, elbows, wrists,
knees, and ankle–foot area. As headache may not be primarily musculoskeletal, this area was
not included in our analyses. The response alternatives were: 1) No, 2) Yes, but I have not
consulted a physician, physiotherapist, nurse, or other health professional because of the pain
and 3) Yes, and I have consulted a physician, physiotherapist, nurse, or other health
professional because of the pain. For our main analyses, we compared the response
alternative “No” (1) with the two “Yes” alternatives (2 and 3). In supplementary analyses, we
also compared participants who had sought health care (3) with those who had no pain or had
not sought health care for the pain (1 and 2). Pain locations were categorized in four separate
body regions as previously described by Auvinen et al. (Auvinen et al. 2009): 1) Neck, 2)
Shoulder, 3) Low back, and 4) Peripheral areas (elbow, wrist, knee, or ankle–foot). We
defined widespread pain as three or more pain sites including both upper and lower parts of
the body as well as axial pain (neck and/or low back), as this is close to the definition of
chronic widespread pain (Wolfe et al. 2010), except we did not have information on duration
9
Covariates
Maternal smoking during pregnancy (yes/no) was based on a questionnaire completed during
pregnancy for ESTER participants from NFBC (Tikanmäki et al. 2017b), and on medical
records for ESTER participants from FMBR and for AYLS participants. Diagnosis of
gestational diabetes and hypertension (gestational/chronic or preeclampsia) were reviewed
from hospital records and confirmed according to current criteria for all participants
(Matinolli et al. 2016). We calculated the birth weight standard deviation (SD) score by
gestational age and sex according to Finnish birth weight standards (Pihkala et al. 1989). We
used educational attainment of the higher educated parent, reported by the participant at the
clinical examination to indicate the childhood socioeconomic status (dummy coded, with
separate category for missing data). Current body mass index (BMI) was calculated from the
height and weight measured during the clinical visit and current smoking (daily smoking,
yes/no) as self-reported by questionnaire. Physical activity level was calculated in metabolic
equivalent (MET) hours per week on the basis of a questionnaire on light (assuming a value
of 3 METs), moderate to vigorous (5 METs), and commuting from home to work or study
and back (4 METs) physical activity (Tikanmäki et al. 2016). Depressive symptoms were
measured by the Beck Depression Inventory – second edition (BDI-II) (Beck, Steer and
Brown 1996), with scores 0-13 indicative of no depression, scores 14-19 indicative of mild
depression and scores >19 indicative of moderate/severe depression (dummy coded, with
separate category for missing data). Information about neurosensory impairment, severe
physical or cognitive disability, fracture history and whether the participant was pregnant was
10
Statistical analyses
Statistical analyses were performed with IBM SPSS for Windows 23.0. Two-tailed p-values
<0.05 were considered statistically significant. Background/descriptive characteristics were
compared by using one-way ANOVA for continuous data, and linear-by-linear association
for categorical data. Logistic regression models were used to compare differences between
the groups and covariates selected as in previous publications from the source cohorts
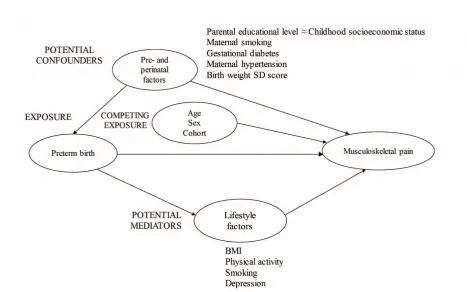
(Matinolli et al. 2016, Sipola-Leppänen et al. 2015, Tikanmäki et al. 2016) (Figure S1). We
first estimated the crude effect of preterm birth, adjusting for sex, age and cohort (Model 1).
To assess the total effect, we adjusted for variables in Model 1 in addition to potential early
life confounders; parental educational level as a proxy of childhood socioeconomic position,
maternal smoking during pregnancy, gestational diabetes, maternal hypertension and birth
weight SD score as indicators of fetal conditions during pregnancy (Model 2). Specifically,
birth weight SD score, which indicates birth weight in relation to gestational age and is a
commonly used indicator of fetal growth, was included as another marker of pregnancy
conditions predisposing to preterm birth. Additionally, as potential mediators, we adjusted for
lifestyle factors related to physical health; BMI, self-reported physical activity level and daily
smoking (Model 3), and mental health; depressive symptoms (Model 4) at the time of the
study. We also ran the analyses by replacing current BMI with lean body mass, without and
with fat percentage, available for 1140 (97%) participants assessed by segmental
multifrequency bioelectrical impendance (InBody 3.0, Biospace Co., Seoul, Korea)
(Sipola-Leppänen et al. 2015). We performed a subgroup analysis comparing individuals born
VLBW (<1500g; n=67) with the term-born reference group. We also performed logistic
regression analyses after exclusion of individuals with self-reported neurosensory
11 the same year as the clinical examination (n=13), and pregnant women (n=26), due to their
possible effect on musculoskeletal pain.
Results
Background characteristics
Table 1 shows the background characteristics of the study groups.
Prevalence of musculoskeletal pain
Table 2 shows the prevalence of musculoskeletal pain in different areas of the body and
Figure 2 shows the proportion of participants with no, one or more pain sites in the three
study groups. Any pain was reported in 82.3-85.8% and widespread pain in 39.1-45.1% of all
participants.
Table 3 shows the odds ratio for reporting any pain, pain in the four body regions and
widespread pain. The late preterm group had lower odds for reporting neck pain (OR: 0.73;
95% CI: 0.56-0.96), which was unchanged when adjusting for potential early life
confounders (Model 2), and further reduced when adjusting for BMI, physical activity level
and daily smoking (Model 3), and depressive symptoms (Model 4). The odds for reporting
peripheral pain was 0.73; 95% CI: 0.52-1.02 in the early preterm group, and significantly
reduced after adjustment for early life confounders and lifestyle factors (0.69; 95% CI:
0.48-0.99, Model 4). The odds for reporting any pain, shoulder, low back or widespread pain did
not differ significantly between groups, although the late preterm group had a tendency of
reporting less widespread pain (0.80; 95% CI: 0.61-1.05), which remained when we adjusted
12
Seeking health care for musculoskeletal pain
Table S1 shows the prevalence of musculoskeletal pain and health care seeking in the three
groups. When we compared young adults who had sought health care with all participants
who had not sought health care (with or without pain), there were no significant group
differences, except the late preterm group had lower odds for seeking provider for widespread
pain when adjusted for early life confounders and lifestyle factors (OR: 0.42; 95% CI:
0.18-0.98, Model 4) (Table S2).
Subgroup analyses
Table S3 shows the odds ratio for reporting any pain, pain in the four body regions and
widespread pain in a subgroup of VLBW participants compared with the term-born reference
group. The VLBW group had a tendency of reporting less peripheral pain (0.67; 95% CI:
0.40-1.14), the difference was significant when we adjusted for early life confounders, and
lifestyle factors (0.50; 95% CI: 0.26-0.94, Model 4).
Sensitivity analyses
All results were essentially the same when we excluded individuals with neurosensory
impairment, severe physical or cognitive disability (n=17), fractures during the last year
(n=13) and/or pregnant women (n=26) (data not shown).
Discussion
The preterm groups reported similar prevalence of musculoskeletal pain during the last six
months in most body regions as the term-born reference group. The early preterm group
tended to report less peripheral pain and the late preterm group had lower odds for reporting
13 sensitivity analyses when we excluded individuals with neurosensory impairment, severe
physical or cognitive disability, fractures during the last year and pregnant women.
The pain questionnaire used in this study is similar to the Standardized Nordic Questionnaire
(SNQ) (Kuorinka et al. 1987), which has been used in several studies of musculoskeletal pain
worldwide. The original SNQ has nine anatomical regions, including upper back and hip, that
were not recorded in our study. Although pain in the specified body areas may not necessarily
be primarily musculoskeletal, this term has been widely applied when using these types of
questionnaires (Kuorinka et al. 1987, Kamaleri et al. 2008, Auvinen et al. 2009).
Furthermore, as other types of pain, such as neuropathic pain, are quite rare in the general
population (Torrance et al. 2006), it is likely that most pain recorded in the specified body
areas in our study is musculoskeletal. As we did not ask for duration of pain, the
questionnaire used in our study provides six months prevalence of pain and may thus include
both acute and chronic pain. We defined widespread pain according to the literature as three
or more pain sites including upper and lower body parts as well as axial pain (Wolfe et al.
2010). Our definition may be regarded as a proxy for chronic widespread pain, as pain in
several body regions is likely to be lasting. Furthermore, in the general population, there is a
strong association between number of musculoskeletal pain sites and functional problems
(Kamaleri et al. 2008).
Studies on self-reported pain in children, adolescents and adults born preterm include smaller
clinical cohort studies and larger population-based studies. The findings are conflicting. This
may be due to different definitions and methods used as well as ages and populations studied.
It has been speculated that early pain and stressful events may alter pain modulating systems
14 (NICU) experiences (Iversen et al. 2017, Vederhus et al. 2012). Even though ELBW infants
are more prone to have a prolonged stay in the NICU than most of the participants in our
study, importantly studies of ELBW children (Grunau et al. 1998), adolescents (Vederhus et
al. 2012) and adults (Saigal et al. 2006) have not found differences in pain ratings compared
with controls. The VLBW participants in our study did not report more pain than the
term-born reference group. This is consistent with findings of no differences in self-report of
bodily pain by the Short Form 36 Health Survey (Ware and Gandek 1998) between adults
born at VLBW and at term in UK, Norwegian and Swiss cohorts at 20 (Cooke 2004, Lund et
al. 2012) and 23 years of age (Baumgardt et al. 2012). Also supportive of our findings, no
consistent association was found between preterm birth and self-reported chronic pain in a
large Norwegian study linking birth registry data with a population-based health survey
conducted at 13-18 years (Iversen et al. 2015). Boys born preterm did report higher rates of
chronic daily pain than did boys born at term, but so did also boys born post-term (Iversen et
al. 2015). Furthermore, in a population-based Danish twin register study including 12-22 year
olds, there was no significant association between preterm birth and lifetime prevalence of
low back pain (Hestbaek et al. 2003). In contrast, this study reported a positive association
between increasing birth weight and low back pain in males (Hestbaek et al. 2003).
If anything, some of our findings also suggested lower pain ratings in adults born preterm.
Those born early preterm had lower odds for reporting peripheral pain, statistically
significant after adjustment for lifestyle factors. This wassupported by the lower odds in the
subgroup analysis of VLBW participants. Adults born late preterm did have lower odds for
neck pain, and their lower odds for widespread pain were close to statistical significance.
However, no difference was present in relation to the other pain sites, and the findings above
15 other participants. Therefore we urge for caution when interpreting these findings. Yet, there
would be a number of plausible explanations. Studies have demonstrated that individuals
born preterm have a different personality type than term-born individuals with more
conscientiousness, agreeableness and neuroticism, but less extraversion (Allin et al. 2006,
Pesonen et al. 2008), which may predispose them to give more socially desirable answers and
report less pain. Our findings may also be influenced by parental and surrounding attitudes
towards pain or reflect true differences in the programming of sensitivity to pain.
Most participants (82-86%) in our study reported some form of musculoskeletal pain. This is
in accordance with results from the Northern Finland Birth Cohort, where 85% of
18-year-olds reported musculoskeletal pain (Auvinen et al. 2009). Also, the Global Burden of Disease
Study 2015 reports that low back pain, neck pain, osteoarthritis, and other musculoskeletal
disorders are extremely common in nearly all populations (GBD 2015 Disease and Injury
Incidence and Prevalence Collaborators 2016). In the large Australian cross-sectional
observational 1000 Norms Project, 12-month prevalence of all musculoskeletal symptoms
was 69% for adolescents (11-17 years) and 82% for adults (18-101 years), making the
authors conclude that musculoskeletal symptoms are a “normal feature of the human
experience” (Baldwin et al. 2017). Widespread pain was reported in 39-45% of all
participants in our study. This estimate corresponds well with the prevalence of chronic pain
of 44% in adolescence (13-18 years) (Iversen et al. 2015), but is higher than the 29%
prevalence that has been reported for chronic widespread musculoskeletal complaints in
young adulthood (20-29 years) (Hagen et al. 2011).
In the general population, musculoskeletal pain increases with age (GBD 2015 Disease and
16 inactivity (Landmark et al. 2011). As recent papers from the ESTER birth cohort
demonstrated, young adults born early preterm were less fit (Tikanmäki et al. 2016) and less
physically active than term-born controls (Tikanmäki et al. 2017a). This may predispose
adults born preterm to more musculoskeletal pain with age. This may be part of the
explanation of the (non-significant) association of preterm birth and VLBW with chronic
widespread pain in 45-year-olds in the British 1958 Cohort Study (Littlejohn et al. 2012). The
Norwegian population-based HUNT-3 study has demonstrated higher prevalence of chronic
pain in individuals who smoke, are depressed and of lower educational attainment (Landmark
et al. 2011); these could serve as mediators of possible altered pain in adults born preterm.
However, our study gave no further support for this; additional adjustments for lifestyle
factors like body composition, physical activity and smoking as well as depressive symptoms
did not affect the odds of having musculoskeletal pain much. Neither did exclusion of
individuals with neurosensory impairment, severe physical or cognitive disability, fractures
during the last year and pregnant women.
A key strength of the present study is the large number of participants from two geographical
cohorts. The narrow confidence intervals imply that we are able to exclude any but very small
differences in pain between the groups. However, the participation rate especially in the
ESTER study was low, but previous published non-participant analysis in ESTER (Matinolli
et al. 2016, Sipola-Leppänen et al. 2015) and AYLS (Matinolli et al. 2016) cohorts have not
raised concern of bias due to loss to follow-up. As the pain questionnaire was included as part
of an extensive follow-up assessment, people with severe musculoskeletal pain might be less
likely to participate. However, this would introduce bias only if the association between
participation and musculoskeletal pain would be different in the preterm and term groups.
17
Conclusion
We found no evidence of increased prevalence of musculoskeletal pain during the last six
months in adults born early or late preterm compared with a term-born reference group. Our
study had adequate power to exclude any other than small increases in musculoskeletal pain
between the groups. Rather, our findings suggest slightly lower rates of musculoskeletal pain
in young adults born preterm. This difference is likely to be small and needs to be confirmed
in future studies.
Author Contributions
Dr. Evensen carried out the analyses and drafted the manuscript. Dr. Tikanmaki collected and
cleaned ESTER data, interpreted the analyses and contributed to redrafts. Dr. Heinonen
collected and cleaned AYLS data and contributed to redrafts. Dr. Matinolli collected and
cleaned AYLS and ESTER data and contributed to redrafts. Dr. Sipola-Leppanen collected
and cleaned ESTER data and contributed to redrafts. Dr. Lano saw the AYLS participants as
children or contributed to the AYLS childhood data collection, designed the AYLS adult
study and contributed to redrafts. Dr. Wolke contributed to the AYLS design and contributed
to redrafts. Dr. Vaarasmaki designed and supervised the ESTER study and contributed to
redrafts. Drs. Eriksson and Raikkonen designed the AYLS adult study, contributed to the
ESTER study and contributed to redrafts. Dr. Andersson contributed to the AYLS adult study
and contributed to redrafts. Drs. Jarvelin and Hovi contributed to the ESTER design and
contributed to redrafts. Dr. Kajantie contributed to the AYLS adult study and data collection,
designed the ESTER study, supervised data collection and cleaning and contributed to
18
References
Aarnoudse-Moens, C. S., N. Weisglas-Kuperus, J. B. van Goudoever & J. Oosterlaan (2009)
Meta-analysis of neurobehavioral outcomes in very preterm and/or very low birth
weight children. Pediatrics, 124, 717-28.
Allin, M., M. Rooney, M. Cuddy, J. Wyatt, M. Walshe, L. Rifkin & R. Murray (2006)
Personality in young adults who are born preterm. Pediatrics, 117, 309-16.
Auvinen, J. P., M. V. Paananen, T. H. Tammelin, S. P. Taimela, P. O. Mutanen, P. J. Zitting
& J. I. Karppinen (2009) Musculoskeletal pain combinations in adolescents. Spine
(Phila Pa 1976), 34, 1192-7.
Baldwin, J. N., M. J. McKay, N. Moloney, C. E. Hiller, E. J. Nightingale, J. Burns & C.
Norms Project (2017) Reference values and factors associated with musculoskeletal
symptoms in healthy adolescents and adults. Musculoskelet Sci Pract, 29, 99-107.
Batsvik, B., B. J. Vederhus, T. Halvorsen, T. Wentzel-Larsen, M. Graue & T. Markestad
(2015) Health-related quality of life may deteriorate from adolescence to young
adulthood after extremely preterm birth. Acta Paediatr, 104, 948-55.
Baumgardt, M., H. U. Bucher, R. A. Mieth & J. C. Fauchere (2012) Health-related quality of
life of former very preterm infants in adulthood. Acta Paediatr, 101, e59-63.
Beck, A. T., R. A. Steer & G. K. Brown. 1996. Manual for the Beck Depression Inventory-II.
San Antonio, TX: Psychological Corporation.
Beggs, S., G. Currie, M. W. Salter, M. Fitzgerald & S. M. Walker (2012) Priming of adult
pain responses by neonatal pain experience: maintenance by central neuroimmune
activity. Brain, 135, 404-17.
Bjorkqvist, J., A. K. Pesonen, L. Kuula, H. M. Matinolli, A. Lano, M. Sipola-Leppanen, M.
Tikanmaki, D. Wolke, M. R. Jarvelin, J. G. Eriksson, S. Andersson, M. Vaarasmaki,
19 circadian preference in young adulthood: evidence from two birth cohorts.
Chronobiol Int, 35, 555-564.
Blencowe, H., S. Cousens, M. Z. Oestergaard, D. Chou, A. B. Moller, R. Narwal, A. Adler,
C. Vera Garcia, S. Rohde, L. Say & J. E. Lawn (2012) National, regional, and
worldwide estimates of preterm birth rates in the year 2010 with time trends since
1990 for selected countries: a systematic analysis and implications. Lancet, 379,
2162-72.
Buskila, D., L. Neumann, E. Zmora, M. Feldman, A. Bolotin & J. Press (2003) Pain
sensitivity in prematurely born adolescents. Arch Pediatr Adolesc Med, 157, 1079-82.
Cooke, R. W. I. (2004) Health, lifestyle, and quality of life for young adults born very
preterm. Archives of Disease in Childhood, 89, 201-206.
GBD 2015 Disease and Injury Incidence and Prevalence Collaborators (2016) Global,
regional, and national incidence, prevalence, and years lived with disability for 310
diseases and injuries, 1990-2015: a systematic analysis for the Global Burden of
Disease Study 2015. Lancet, 388, 1545-1602.
Grunau, R., M. F. Whitfield & J. H. Petrie (1994a) Pain sensitivity and temperament in
extremely low-birth-weight premature toddlers and preterm and full-term controls.
Pain, 58, 5.
Grunau, R. E. (2013) Neonatal pain in very preterm infants: long-term effects on brain,
neurodevelopment and pain reactivity. Rambam Maimonides Med J, 4, e0025.
Grunau, R. E., M. F. Whitfield & J. Petrie (1998) Children's judgements about pain at age
8-10 years: do extremely low birthweight (< or = 8-1000 g) children differ from full
20 Grunau, R. V., M. F. Whitfield, J. H. Petrie & E. L. Fryer (1994b) Early pain experience,
child and family factors, as precursors of somatization: a prospective study of
extremely premature and fullterm children. Pain, 56, 353-9.
Hagen, K., M. Linde, I. Heuch, L. J. Stovner & J. A. Zwart (2011) Increasing prevalence of
chronic musculoskeletal complaints. A large 11-year follow-up in the general
population (HUNT 2 and 3). Pain Med, 12, 1657-66.
Heinonen, K., K. Raikkonen, A. K. Pesonen, E. Kajantie, S. Andersson, J. G. Eriksson, A.
Niemela, T. Vartia, J. Peltola & A. Lano (2008) Prenatal and postnatal growth and
cognitive abilities at 56 months of age: a longitudinal study of infants born at term.
Pediatrics, 121, e1325-33.
Hermann, C., J. Hohmeister, S. Demirakca, K. Zohsel & H. Flor (2006) Long-term alteration
of pain sensitivity in school-aged children with early pain experiences. Pain, 125,
278-85.
Hestbaek, L., C. Leboeuf-Yde, K. O. Kyvik & C. Manniche (2003) Is low back pain in youth
associated with weight at birth? A cohort study of 8000 Danish adolescents. Dan Med
Bull, 50, 181-5.
Hohmeister, J., A. Kroll, I. Wollgarten-Hadamek, K. Zohsel, S. Demirakca, H. Flor & C.
Hermann (2010) Cerebral processing of pain in school-aged children with neonatal
nociceptive input: an exploratory fMRI study. Pain, 150, 257-67.
Husby, I. M., K. M. Stray, A. Olsen, S. Lydersen, M. S. Indredavik, A. M. Brubakk, J.
Skranes & K. A. Evensen (2016) Long-term follow-up of mental health,
health-related quality of life and associations with motor skills in young adults born preterm
21 Iversen, J. M., G. B. Hoftun, P. R. Romundstad & M. Rygg (2015) Adolescent chronic pain
and association to perinatal factors: linkage of Birth Registry data with the
Young-HUNT Study. Eur J Pain, 19, 567-75.
Iversen, J. M., M. S. Indredavik, K. A. Evensen, P. R. Romundstad & M. Rygg (2017)
Self-reported Chronic Pain in Young Adults With a Low Birth Weight. Clin J Pain, 33,
348-355.
Kamaleri, Y., B. Natvig, C. M. Ihlebaek & D. Bruusgaard (2008) Localized or widespread
musculoskeletal pain: does it matter? Pain, 138, 41-6.
Kuorinka, I., B. Jonsson, A. Kilbom, H. Vinterberg, F. Biering-Sorensen, G. Andersson & K.
Jorgensen (1987) Standardised Nordic questionnaires for the analysis of
musculoskeletal symptoms. Appl Ergon, 18, 233-7.
Landmark, T., P. Romundstad, P. C. Borchgrevink, S. Kaasa & O. Dale (2011) Associations
between recreational exercise and chronic pain in the general population: evidence
from the HUNT 3 study. Pain, 152, 2241-7.
Littlejohn, C., D. Pang, C. Power, G. J. Macfarlane & G. T. Jones (2012) Is there an
association between preterm birth or low birthweight and chronic widespread pain?
Results from the 1958 Birth Cohort Study. Eur J Pain, 16, 134-9.
Lund, L. K., T. Vik, S. Lydersen, G. C. Lohaugen, J. Skranes, A. M. Brubakk & M. S.
Indredavik (2012) Mental health, quality of life and social relations in young adults
born with low birth weight. Health Qual Life Outcomes, 10, 146.
Mallen, C. D., G. Peat, E. Thomas & P. R. Croft (2006) Is chronic musculoskeletal pain in
adulthood related to factors at birth? A population-based case-control study of young
adults. Eur J Epidemiol, 21, 237-43.
Matinolli, H. M., S. Männistö, M. Sipola-Leppänen, M. Tikanmäki, K. Heinonen, J. Lahti, M.
22 G. Eriksson, M. Vääräsmäki, K. Räikkönen & E. Kajantie (2016) Body image and
eating behavior in young adults born preterm. Int J Eat Disord, 49, 572-80.
Pesonen, A. K., K. Raikkonen, K. Heinonen, S. Andersson, P. Hovi, A. L. Jarvenpaa, J. G.
Eriksson & E. Kajantie (2008) Personality of young adults born prematurely: the
Helsinki study of very low birth weight adults. J Child Psychol Psychiatry, 49,
609-17.
Pihkala, J., T. Hakala, P. Voutilainen & K. Raivio (1989) [Characteristic of recent fetal
growth curves in Finland]. Duodecim, 105, 1540-6.
Potijk, M. R., A. F. de Winter, A. F. Bos, J. M. Kerstjens & S. A. Reijneveld (2012) Higher
rates of behavioural and emotional problems at preschool age in children born
moderately preterm. Arch Dis Child, 97, 112-7.
Raju, T. N. K., A. S. Buist, C. J. Blaisdell, M. Moxey-Mims & S. Saigal (2017) Adults born
preterm: a review of general health and system-specific outcomes. Acta Paediatr, 106,
1409-1437.
Saigal, S., D. Feeny, P. Rosenbaum, W. Furlong, E. Burrows & B. Stoskopf (1996)
Self-perceived health status and health-related quality of life of extremely low-birth-weight
infants at adolescence. JAMA, 276, 453-459.
Saigal, S., B. Stoskopf, J. Pinelli, D. Streiner, L. Hoult, N. Paneth & J. Goddeeris (2006)
Self-perceived health-related quality of life of former extremely low birth weight
infants at young adulthood. Pediatrics, 118, 1140-8.
Sipola-Leppänen, M., M. Vääräsmäki, M. Tikanmäki, H. M. Matinolli, S. Miettola, P. Hovi,
K. Wehkalampi, A. Ruokonen, J. Sundvall, A. Pouta, J. G. Eriksson, M. R. Järvelin &
E. Kajantie (2015) Cardiometabolic risk factors in young adults who were born
23 Tikanmäki, M., N. Kaseva, T. Tammelin, M. Sipola-Leppänen, H. M. Matinolli, J. G.
Eriksson, M. R. Järvelin, M. Vääräsmäki & E. Kajantie (2017a) Leisure Time
Physical Activity in Young Adults Born Preterm. J Pediatr, 189, 135-142 e2.
Tikanmäki, M., T. Tammelin, M. Sipola-Leppänen, N. Kaseva, H. M. Matinolli, S. Miettola,
J. G. Eriksson, M. R. Järvelin, M. Vääräsmäki & E. Kajantie (2016) Physical Fitness
in Young Adults Born Preterm. Pediatrics, 137.
Tikanmäki, M., T. Tammelin, M. Vääräsmäki, M. Sipola-Leppänen, S. Miettola, A. Pouta,
M. R. Järvelin & E. Kajantie (2017b) Prenatal determinants of physical activity and
cardiorespiratory fitness in adolescence - Northern Finland Birth Cohort 1986 study.
BMC Public Health, 17, 346.
Torrance, N., B. H. Smith, M. I. Bennett & A. J. Lee (2006) The epidemiology of chronic
pain of predominantly neuropathic origin. Results from a general population survey. J
Pain, 7, 281-9.
Valeri, B. O., M. Ranger, C. M. Chau, I. L. Cepeda, A. Synnes, M. B. Linhares & R. E.
Grunau (2016) Neonatal Invasive Procedures Predict Pain Intensity at School Age in
Children Born Very Preterm. Clin J Pain, 32, 1086-1093.
Vederhus, B. J., G. E. Eide, G. K. Natvig, T. Markestad, M. Graue & T. Halvorsen (2012)
Pain tolerance and pain perception in adolescents born extremely preterm. J Pain, 13,
978-87.
Walker, S. M. (2017) Translational studies identify long-term impact of prior neonatal pain
experience. Pain, 158 Suppl 1, S29-S42.
Walker, S. M., L. S. Franck, M. Fitzgerald, J. Myles, J. Stocks & N. Marlow (2009)
Long-term impact of neonatal intensive care and surgery on somatosensory perception in
24 Ware, J. E., Jr. & B. Gandek (1998) Overview of the SF-36 Health Survey and the
International Quality of Life Assessment (IQOLA) Project. J Clin Epidemiol, 51,
903-12.
Wolfe, F., D. J. Clauw, M. A. Fitzcharles, D. L. Goldenberg, R. S. Katz, P. Mease, A. S.
Russell, I. J. Russell, J. B. Winfield & M. B. Yunus (2010) The American College of
Rheumatology preliminary diagnostic criteria for fibromyalgia and measurement of
25
Table 1. Descriptive characteristics of young adults born early and late preterm and at term.
Characteristics Early preterm (n=184) Late preterm (n=350) Term-born (n=641) No.
missing p-value
Male n (%) 88 (47.8) 174 (49.7) 293 (45.7) 0/0/0 0.393
ESTER cohort n (%) 143 (77.7) 240 (68.6) 345 (53.8) 0/0/0 <0.001 Maternal smoking
during pregnancy n (%)
36 (20.3) 67 (19.5) 101 (15.9) 7/6/7 0.101
Gestational diabetes n (%)
4 (2.5) 15 (4.6) 16 (2.5) 21/23/9 0.537
Maternal hypertension n (%)
Gestational or chronic 23 (12.8) 44 (13.1) 72 (11.7)
Preeclampsia 39 (21.7) 43 (12.8) 19 (3.1) 4/15/24 <0.001 Normotensive 118 (65.6) 248 (74.0) 526 (85.3)
Birth weight (g) 1737 (486) 2687 (532) 3594 (479) 0/0/0 <0.001 Birth weight SD score -0.73 (1.41) -0.59 (1.32) 0.03 (0.97) 0/0/0 <0.001
Parental educational level n (%)
Basic or less 14 (7.6) 26 (7.5) 45 (7.1)
Secondary 111 (60.3) 189 (54.3) 333 (52.4) 0/2/5 0.076
Lower-level tertiary 17 (9.2) 40 (11.5) 77 (12.1) Upper-level tertiary 42 (22.8) 93 (26.7) 181 (28.5) Age at clinical
examination (years)
23.6 (1.6) 23.8 (1.5) 24.4 (1.3) 0/0/0 <0.001
Height (cm) 170.0 (10.1) 171.8 (9.1) 171.5 (9.4) 2/1/10 0.081 Weight (kg) 70.2 (17.1) 71.6 (15.6) 70.2 (14.5) 2/1/10 0.358 Body mass index
(kg/m2)
24.2 (5.0) 24.1 (4.3) 23.8 (4.0) 2/1/10 0.306
Physical activity (MET h/wk)
23.7 (14.5) 24.9 (14.6) 25.8 (13.9) 0/1/2 0.199
Daily smoking n (%) 48 (26.4) 90 (26.2) 165 (26.4) 2/6/16 0.973
Beck depression inventory n (%)
No depression 142 (85.5) 281 (88.9) 525 (89.7)
18/34/56 0.112
Mild depression 15 (9.0) 20 (6.3) 41 (7.0)
Moderate/severe depression
9 (5.4) 15 (4.7) 19 (3.2)
Neurosensory impairment, severe physical or mental disability n (%)
11 (6.0) 2 (0.6) 4 (0.6) 0/0/0 <0.001
Fractures the last year n (%)
1 (0.5) 3 (0.9) 9 (1.4) 0/0/0 0.269
Pregnant women n (%)
6 (3.3) 7 (2.0) 13 (2.0) 0/0/5 0.416
One-way ANOVA for continuous data, Linear-by-linear association for categorical data.
ESTER: Preterm Birth and Early-Life Programming of Adult Health and Disease Preterm Birth Study MET: Metabolic Equivalent
26
Table 2. Prevalence of musculoskeletal pain in young adults born early and late preterm and at term.
Early preterm (n=184)
Late preterm (n=350)
Term-born (n=641)
Pain site n (%) n (%) n (%)
Any pain 152 (82.6) 288 (82.3) 550 (85.8)
Neck 94 (51.1) 154 (44.0) 335 (52.3)
Shoulder 111 (60.3) 208 (59.4) 405 (63.2)
Low back 106 (57.6) 186 (53.1) 365 (56.9)
Elbow 12 (6.5) 17 (4.9) 39 (6.1)
Wrist/hand 33 (17.9) 73 (20.9) 156 (24.3)
Knee 40 (21.7) 81 (23.1) 172 (26.8)
Ankle/foot 37 (20.1) 66 (18.9) 115 (17.9)
Widespread paina 81 (44.0) 137 (39.1) 289 (45.1)
27
Table 3. Logistic regression models showing the odds ratio (95% confidence interval) for reporting any pain, pain in four body regions and widespread pain during the last six months in the early and late preterm groups compared with the term-born reference group.
Outcome variable and Modela
Early preterm (n=184) Late preterm (n=350) OR (95% CI) OR (95% CI)
Any painb
1 0.81 (0.52-1.28) 0.79 (0.55-1.14)
2 0.74 (0.46-1.20) 0.77 (0.53-1.13)
3 0.70 (0.43-1.14) 0.75 (0.51-1.11)
4 0.69 (0.42-1.12) 0.75 (0.51-1.11)
Neck painb
1 0.97 (0.69-1.36) 0.73 (0.56-0.96)
2 0.93 (0.65-1.33) 0.72 (0.55-0.96)
3 0.88 (0.61-1.26) 0.71 (0.54-0.95)
4 0.83 (0.58-1.20) 0.70 (0.52-0.93)
Shoulder painb
1 0.94 (0.66-1.34) 0.91 (0.68-1.20)
2 0.92 (0.63-1.34) 0.92 (0.69-1.23)
3 0.88 (0.60-1.29) 0.92 (0.68-1.23)
4 0.85 (0.58-1.24) 0.90 (0.67-1.22)
Low back painb
1 1.08 (0.77-1.52) 0.89 (0.68-1.17)
2 1.03 (0.71-1.47) 0.88 (0.67-1.17)
3 0.96 (0.67-1.39) 0.87 (0.65-1.15)
4 0.94 (0.65-1.36) 0.86 (0.64-1.14)
Peripheral painb
1 0.73 (0.52-1.02) 0.87 (0.67-1.14)
2 0.71 (0.50-1.03) 0.90 (0.68-1.19)
3 0.70 (0.49-1.01) 0.91 (0.69-1.21)
4 0.69 (0.48-0.99) 0.90 (0.68-1.19)
Widespread painb, c
1 0.97 (0.69-1.36) 0.80 (0.61-1.05)
2 0.91 (0.63-1.31) 0.79 (0.60-1.05)
3 0.86 (0.60-1.25) 0.79 (0.60-1.06)
4 0.82 (0.57-1.19) 0.77 (0.58-1.03)
aModel 1 was adjusted for sex, age and cohort. Model 2 was adjusted for the variables in model 1 and parental educational level, maternal smoking during pregnancy, gestational diabetes, maternal hypertension and birth weight standard deviation score. Model 3 was adjusted for the variables in model 2 and body mass index, reported physical activity level and daily smoking. Model 4 was adjusted for variables in Model 3 and self-reported depressive symptoms.
bAfter excluding individuals with neurosensory impairment, severe physical or mental disability (n=17), fractures the last year (n=13) and pregnant women (n=26), estimates were essentially the same.
28
Figure 1. Flowchart of study participants in the ESTER and AYLS cohorts.
29
Figure 2. Proportion of young adults with no, one or more pain sites in the three study groups.
30
[image:31.595.76.523.145.688.2]SUPPLEMENTAL MATERIAL
Table S1. Prevalence of musculoskeletal pain and health care seeking during the last six months in young adults born early and late preterm and at term.
Early preterm (n=184) Late preterm (n=350) Term-born (n=641)
Pain site n (%) n (%) n (%)
Any pain
No 32 (17.4) 62 (17.7) 91 (14.2)
Yes, no health provider 109 (59.2) 214 (61.1) 397 (61.9) Yes, been to health provider 43 (23.4) 74 (21.1) 153 (23.9)
Neck
No 90 (48.9) 196 (56.0) 306 (47.7)
Yes, no health provider 79 (42.9) 134 (38.3) 287 (44.8) Yes, been to health provider 15 (8.2) 20 (5.7) 48 (7.5)
Shoulder
No 73 (39.7) 142 (40.6) 236 (36.8)
Yes, no health provider 90 (48.9) 176 (50.3) 341 (53.2) Yes, been to health provider 21 (11.4) 32 (9.1) 64 (10.0)
Low back
No 78 (42.4) 164 (46.9) 276 (43.1)
Yes, no health provider 90 (48.9) 156 (44.6) 289 (45.1) Yes, been to health provider 16 (8.7) 30 (8.6) 76 (11.9)
Elbow
No 172 (93.5) 333 (95.1) 602 (93.9)
Yes, no health provider 11 (6.0) 14 (4.0) 33 (5.1) Yes, been to health provider 1 (0.5) 3 (0.9) 6 (0.9)
Wrist/hand
No 151 (82.1) 277 (79.1) 485 (75.7)
Yes, no health provider 27 (14.7) 65 (18.6) 138 (21.5) Yes, been to health provider 6 (3.3) 8 (2.3) 18 (2.8)
Knee
No 144 (78.3) 269 (76.9) 469 (73.2)
Yes, no health provider 32 (17.4) 73 (20.9) 140 (21.8) Yes, been to health provider 8 (4.3) 8 (2.3) 32 (5.0)
Ankle/foot
No 147 (79.9) 284 (81.1) 526 (82.1)
Yes, no health provider 26 (14.1) 51 (14.6) 89 (13.9) Yes, been to health provider 11 (6.0) 15 (4.3) 26 (4.1)
Widespred paina
No 103 (56.0) 213 (60.9) 352 (54.9)
Yes, no health provider 70 (38.0) 129 (36.9) 256 (39.9) Yes, been to health provider 11 (6.0) 8 (2.3) 33 (5.1)
31
Table S2. Logistic regression models showing the odds ratio (95% confidence interval) for seeking health care for pain (vs. no pain or not seeking health care for pain) during the last six months in the early and late preterm groups compared with the term-born reference group.
Outcome variable and Modela
Early preterm (n=184) Late preterm (n=350) OR (95% CI) OR (95% CI)
Any providerb
1 1.14 (0.76-1.69) 0.95 (0.69-1.32)
2 1.18 (0.77-1.79) 0.95 (0.68-1.33)
3 1.11 (0.73-1.71) 0.95 (0.68-1.34)
4 1.08 (0.70-1.66) 0.94 (0.67-1.32)
Provider for neck painb
1 1.37 (0.74-2.55) 0.88 (0.51-1.52)
2 1.58 (0.82-3.04) 0.91 (0.51-1.60)
3 1.33 (0.67-2.64) 0.92 (0.52-1.62)
4 1.23 (0.61-2.48) 0.87 (0.49-1.57)
Provider for shoulder painb
1 1.47 (0.86-2.52) 1.08 (0.68-1.71)
2 1.63 (0.92-2.89) 1.06 (0.66-1.70)
3 1.44 (0.80-2.62) 1.07 (0.66-1.74)
4 1.39 (0.76-2.54) 1.06 (0.65-1.73)
Provider for low back painb
1 0.80 (0.45-1.43) 0.77 (0.49-1.21)
2 0.82 (0.45-1.50) 0.79 (0.50-1.27)
3 0.68 (0.36-1.29) 0.75 (0.47-1.21)
4 0.61 (0.32-1.17) 0.71 (0.44-1.16)
Provider for peripheral painb
1 1.40 (0.83-2.37) 0.89 (0.56-1.43)
2 1.47 (0.84-2.56) 0.90 (0.55-1.45)
3 1.39 (0.79-2.45) 0.90 (0.55-1.46)
4 1.32 (0.74-2.34) 0.87 (0.53-1.42)
Provider for widespread painb,c
1 1.43 (0.70-2.95) 0.50 (0.23-1.11)
2 1.72 (0.81-3.64) 0.53 (0.23-1.18)
3 1.31 (0.58-2.93) 0.51 (0.23-1.15)
4 1.10 (0.48-2.55) 0.42 (0.18-0.98)
aModel 1 was adjusted for sex, age, and cohort. Model 2 was adjusted for the variables in model 1 and parental educational level, maternal smoking during pregnancy, gestational diabetes and hypertension and birth weight standard deviation score. Model 3 was adjusted for the variables in model 2 and body mass index, self-reported physical activity level and daily smoking. Model 4 was adjusted for variables in Model 3 and self-reported depressive symptoms.
bAfter excluding individuals with neurosensory impairment, severe physical or mental disability (n=17), fractures the last year (n=13) and pregnant women (n=26), estimates were essentially the same in the late preterm group, and reduced in the early preterm group.
32
Table S3. Logistic regression models showing the odds ratio (95% confidence interval) for reporting any pain, pain in four body regions and widespread pain during the last six months in a subgroup of young adults born with very low birth weight compared with the term-born reference group.
Outcome variable and Modela
VLBW (n=67) OR (95% CI)
Any painb
1 0.92 (0.44-1.89)
2 0.85 (0.37-1.97)
3 0.79 (0.34-1.85)
4 0.75 (0.32-1.76)
Neck painb
1 1.19 (0.71-2.00)
2 1.36 (0.75-2.46)
3 1.26 (0.69-2.30)
4 1.16 (0.63-2.15)
Shoulder painb
1 0.99 (0.57-1.71)
2 1.04 (0.55-1.99)
3 0.91 (0.47-1.76)
4 0.86 (0.45-1.67)
Low back painb
1 1.23 (0.73-2.08)
2 1.20 (0.65-2.21)
3 1.08 (0.58-2.01)
4 1.06 (0.57-1.98)
Peripheral painb
1 0.67 (0.40-1.14)
2 0.58 (0.31-1.06)
3 0.53 (0.29-1.00)
4 0.50 (0.26-0.94)
Widespread painb,c
1 0.99 (0.59-1.66)
2 1.04 (0.57-1.89)
3 0.95 (0.52-1.76)
4 0.89 (0.48-1.66)
aModel 1 was adjusted for sex, age and cohort. Model 2 was adjusted for the variables in model 1 and parental educational level, maternal smoking during pregnancy, gestational diabetes, maternal hypertension and birth weight standard deviation score. Model 3 was adjusted for the variables in model 2 and body mass index, reported physical activity level and daily smoking. Model 4 was adjusted for variables in Model 3 and self-reported depressive symptoms.
bAfter excluding individuals with neurosensory impairment, severe physical or mental disability (n=11), fractures the last year (n=10) and pregnant women (n=15), estimates were essentially the same.
cWidespread pain was defined as ≥3 pain sites including upper and lower body parts and axial pain.
33