Original citation:
Alsubaie, Najah, Trahearn, Nicholas, Raza, Shan-e-Ahmed, Snead, David and Rajpoot, Nasir M. (Nasir Mahmood). (2017) Stain deconvolution using statistical analysis of multi-resolution stain colour representation. PLoS One, 12 (1). e0169875.
Permanent WRAP URL:
http://wrap.warwick.ac.uk/90843
Copyright and reuse:
The Warwick Research Archive Portal (WRAP) makes this work of researchers of the University of Warwick available open access under the following conditions.
This article is made available under the Creative Commons Attribution 4.0 International license (CC BY 4.0) and may be reused according to the conditions of the license. For more details see: http://creativecommons.org/licenses/by/4.0/
A note on versions:
The version presented in WRAP is the published version, or, version of record, and may be cited as it appears here.
Stain Deconvolution Using Statistical Analysis
of Multi-Resolution Stain Colour
Representation
Najah Alsubaie1,2*, Nicholas Trahearn1, Shan E. Ahmed Raza1, David Snead3, Nasir M. Rajpoot1
1 Department of Computer Science, University of Warwick, Coventry, United Kingdom, 2 Department of
Computer Science, Princess Nourah University, Riyadh, Kingdom of Saudi Arabia, 3 Department of Histopathology, University Hospitals Coventry and Warwickshire, Coventry, United Kingdom
Abstract
Stain colour estimation is a prominent factor of the analysis pipeline in most of histology image processing algorithms. Providing a reliable and efficient stain colour deconvolution approach is fundamental for robust algorithm. In this paper, we propose a novel method for stain colour deconvolution of histology images. This approach statistically analyses the multi-resolutional representation of the image to separate the independent observations out of the correlated ones. We then estimate the stain mixing matrix using filtered uncorrelated data. We conducted an extensive set of experiments to compare the proposed method to the recent state of the art methods and demonstrate the robustness of this approach using three different datasets of scanned slides, prepared in different labs using different scanners.
Introduction
Direct analysis of stain expressions is pivotal for many tasks in the field of digital pathology. Typically, chemical stains are applied to a tissue section in order to highlight particular areas of interest. In digital pathology, these markers continue to play a key role, and automated rithms frequently use stain expressions in a similar way as part of their analysis. These algo-rithms normally require the estimation of each applied stain out of multi-stained tissue image. For instance, on a Haematoxylin and Eosin (H&E) slide the Haematoxylin staining has been used as a guide to detect the nuclei [1] and as a learning feature to perform deep learning for cell detection [2]. The estimation of each stain colour are also used by several stain normalisa-tion algorithms in order to find the contribunormalisa-tion of each individual stain to the final color vari-ation before performing stain colour normalisvari-ation [3–5]. The problem of stain colour estimation out of multi-stained images is exacerbated by the fact that the colour of a stain may vary depending on factors such as the stain manufacturer, room temperature, and the expo-sure time, which are likely to vary between different histology labs [6]. Hence, stain separation a1111111111 a1111111111 a1111111111 a1111111111 a1111111111 OPEN ACCESS
Citation: Alsubaie N, Trahearn N, Raza SEA, Snead
D, Rajpoot NM (2017) Stain Deconvolution Using Statistical Analysis of Multi-Resolution Stain Colour Representation. PLoS ONE 12(1): e0169875. doi:10.1371/journal.pone.0169875
Editor: Cesario Bianchi, Universidade de Mogi das
Cruzes, BRAZIL
Received: August 11, 2016
Accepted: December 23, 2016
Published: January 11, 2017
Copyright:©2017 Alsubaie et al. This is an open access article distributed under the terms of the
Creative Commons Attribution License, which permits unrestricted use, distribution, and reproduction in any medium, provided the original author and source are credited.
Data Availability Statement: All source codes,
images meta information and sample images are publicly available within the Supporting Information files.
Funding: Najah Alsubaie is being funded by Saudi
Ministry of Education, Princess Nourah University, Riyadh, KSA. This funder had no role in study design, data collection and analysis, decision to publish, or preparation of the manuscript.
Competing Interests: The authors have declared
(also called stain deconvolution) out of multi-stained images is an essential step in most of his-tology image analysis algorithms.
Stain deconvolution is the process of transforming a stained tissue section image from the normal RGB colour space into a series of stain channels. Each stain channel is a grayscale image, which represents the intensity of a particular stain expression across the original image. Stain deconvolution methods typically attempt to find an ideal stain matrix, a matrix that when multiplied to the RGB colour channels produces the desired stain channels. A stain matrix is composed of stain vectors, each vector representing the model colour of a particular stain from the original image. In some applications, a normalisation step is conducted to stan-dardise the stain colour appearance in all of processed images before processing each stain col-our [3,7–9].
Ruifrok and Johnston’s colour deconvolution algorithm [10] was among the first in this field. The method outlined certain key principals that more recent methods continue to use, such as the use of stain matrices and the conversion of RGB colour channels into optical den-sity space. The authors also provided sample stain matrices to separate certain popular stain pairs, such as H&E or H&DAB. It should be noted, however, that these stain matrices were optimised for a particular set of images under certain staining conditions, and generally stain matrices need to be tuned to the exact stain colours present in the histology images. As a result, we may not achieve adequate deconvolution if we apply present stain matrix to images with different staining conditions [3,11,12].
To address the need for image-specific stain matrices, a number of stain deconvolution methods have been developed to estimate a specific stain matrix for a given input image. These methods typically apply some statistical analysis to the colour channels of an image and reduce it into a series of stain vectors. An early method of automated stain matrix estimation was described by Macenkoet al.[11] as part of a method of stain normalisation. Stain vectors were estimated by taking singular value decomposition (SVD) of the image data. Gavrilovicet al.
[13] considered the problem in the Maxwellian chromaticity plane, assuming that by project-ing pixels into this space, perceptually similar colours will appear close to each other. Ideally, pixels are expected to appear in groups corresponding to each stain with some division between them. Pixel groups are modelled as a Gaussian mixture whose parameters are deter-mined using an Expectation Maximisation (EM) approach. Each stain vector is then estimated as the mean of its corresponding Gaussian distribution.
Rabinovicet al.[14] compared two stain deconvolution approaches, Non-Negative Matrix Factorisation (NNMF) and Independent Component Analysis (ICA). They showed that while NNMF performed better, neither method was sufficient to fully deconvolve the images. The study was performed on hyper-spectral images, rather than light microscopy images. Hyper-spectral imaging typically operates on a greater number of input channels, compared to the three-channel RGB images, which may limit the comparison that can be made between meth-ods for the two modalities.
Other works have taken a supervised approach to stain deconvolution such as Khanet al.
[3] and Alsubaieet al.[15]. These methods make use of a pre-trained stain classifier to identify the locations where each stain is present. Stain colours, and thus the stain vectors, are then esti-mated from these sets of classified pixels. However, for such approaches to be viable, good quality annotated training data must be available for a variety of stain types, which is often challenging to obtain.
stain colours such as H and E. Also, as we described above, using pre-estimated stain matrix using [10] is not always the best choice to represent the variability in stain colours as it assumes a fixed stain vectors for H and E images.
Trahearnet al.[12] recently proposed a method of stain deconvolution using a variant of ICA. The method is based on the assumption that stain vectors can be modelled as indepen-dent components according to the ICA model. When ICA is applied, it is expected that pixels of the same stain will be distributed approximately along the principal axis of one of the inde-pendent components and pixels of different stains will be distributed along different principle axes. However, Trahearnet al.[12] show that in some cases the raw independent components do not provide adequate deconvolution. Thus, a correction step is applied in order to adjust the estimated independent components. The set of optimal stain vectors is found by minimis-ing the mean of the distances between each pixel and its nearest vector, stoppminimis-ing when conver-gence is achieved.
In theory, ICA recovers the independent components in the mixture based on two assump-tions: a) source signals are independent, and b) they have non-Gaussain distributions [17]. Independency among sources is a strong assumption that might not always be satisfied, and the success of ICA is significantly dependent on this assumption [18]. In this paper, we pro-pose an algorithm for stain deconvolution of histology images using independent component analysis in the wavelet domain. In this approach, the condition of independency among sources is relaxed. Each colour channel of the input image is decomposed into a series of nar-row sub-band images using decimated wavelet transform. Statistical analysis is performed for each band to find the least Gaussian bands. Finally, ICA is applied to the selected sub-bands to estimate the stain matrix. Performing stain deconvolution using only the least Gauss-ian sub-bands increases independence among the separated sources.
The proposed framework also utilises textural information in stain colour deconvolution. The coefficients of the wavelet decomposition embed textural features of the image content which when acquired from the three colour channels could be used to find the stain mixing parameters through the powerful statistical blind source separation algorithm ICA.
We demonstrate the effectiveness of the proposed method in three different experiments using H&E scanned slides from three datasets: colon cancer [2], breast cancer [19] and lung cancer. Colon and lung tissue slides were scanned in the University Hospitals Coventry and Warwickshire (UHCW) while breast tissue slides were scanned at the Pathology Department of the University Medical Center Utrecht, Utrecht, The Netherlands. Faced with these varia-tions in the datasets including slide preparation and scanning procedures, the proposed method shows robust results compared to state of the art.
Materials and Methods
Ethics Statement
The colon and lung cancer tissue slides were anonymously collected from the University Hos-pitals Coventry and Warwickshire (UHCW) NHS Trust in Coventry, UK. The ethics approval for a larger digital pathology study associated with this one was obtained from the National Research Ethics Service North West (REC reference 15/NW/0843). We also have a written per-mission to use breast images derived from our previous contribution to the AMIDA2013 con-test [19].
Blind Source Separation Model
In the blind source separation model, each component of the signal mixture x =x1,x2,. . .xi,i
r>= 2 mixed by a mixing matrix M [22], x1 x2 :: xi 2 6 6 6 6 4 3 7 7 7 7 5¼
m1;1 m1;2 ::: m1;j m2;1 m2;2 ::: m2;j
::::
mi;1 mi;2 ::: mi;j
2 6 6 6 6 4 3 7 7 7 7 5 s1 s2 :: sj 2 6 6 6 6 4 3 7 7 7 7
5 ð1Þ
or simply,
x¼Ms ð2Þ
The objective is to separate the mixture such that the original source signals are recovered. One way of doing this is to find the mixing matrix M using Independent Component Analysis (ICA). ICA can recover source signals only if they are statistically independent. It separates the mixture by transforming it into a linear combination of components that are as non-Gaussian as possible. However, the assumption of independency among sources is precarious [20].
In the problem of stain colour deconvolution, sources are the original stains and the observed signals are the stain mixture. Therefore, we can show the dependency between differ-ent stain colours by comparing stain vector of each stain using two differdiffer-ent staining contexts: In the first context, only one stain colour is applied, in the second context two stain colours are applied to the tissue as shown in [21] and [13]. It has been shown that the estimated stain vec-tor for slide with only one stain colour, i.e, either H or E is different from the corresponding stain vector estimated from slides with multiple stains, for example H&E. Therefore, stain col-ours are actually not independent of each other and presence of one stain affect the others.
Sub-band Independent Component Analysis
In order to reduce independency between the source signals, a linear filtering operator is applied such that the independent subcomponents are allowed to pass through. To explain that, consider sFas the observation signals after applying a filtering operatorF, i.e.
sF¼FðsÞ ð3Þ
Since s is linear combination of independent components and M is constant matrix. Then, we can similarly express xFas follows,
xF¼FðsÞ ¼FðMsÞ ¼MFðsÞ ¼MsF ð4Þ
Thus, by applying ICA to the filtered observations xF, we can find the mixing matrix M
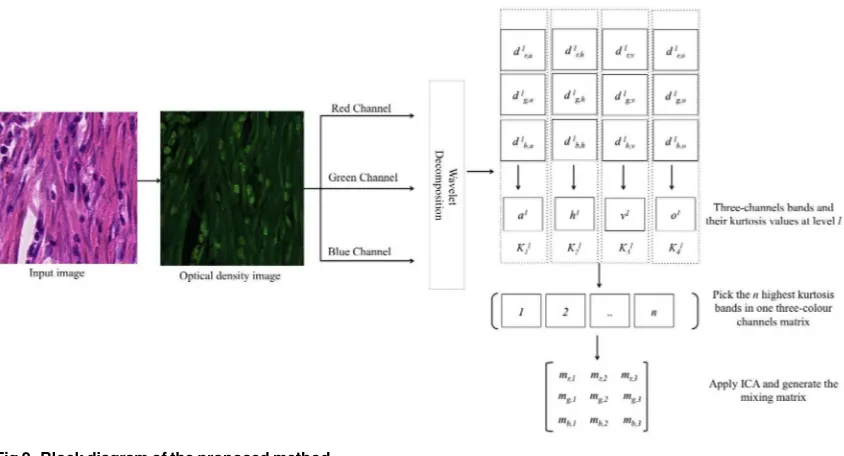
which is the same matrix used to mix the raw signals. Therefore, we can apply M to the original data inEq (2)to separate the mixture and estimate source signals, seeFig 1for an illustration. More details about sub-band ICA can be found in [18,22–24].
Stain Matrix Estimation
We propose the use of multi-resolution representation of the input image, which is generated by decimated wavelet decomposition [25,26] to find the mixing matrix. A block diagram of the proposed method is shown inFig 2. According to the Beer-Lambert law, there is an expo-nential relationship between the amount of absorbed light N and the intensity of the transmit-ted light I, as given by the following equation,
I¼I0e
MN ð5Þ
[image:6.612.203.476.78.241.2]whereI0is the intensity of the incident light. In histology images, M is the concentration of stain colour represented as a vector of RGB components. In this paper, we refer to M as the Fig 1. Blind source separation using sub-band decomposition with ICA. A filtering operator is applied to
the observed signal xito extract independent and dependent sub-bands. The unmixing matrix is then estimated using a selected set of sub-bands which maximises independency among sources.
doi:10.1371/journal.pone.0169875.g001
Fig 2. Block diagram of the proposed method.
[image:6.612.154.576.465.693.2]mixing matrix. N is the amount of the absorbed stain at each pixel of the image which we refer to as density map of each applied stain.
The input image I is converted to the Optical Density space (OD) as follows,
D¼ log I
I0
ð6Þ
where D is the histology image in the OD space. Combining Eqs(5)and(6), we can express D as follows,
D¼MN ð7Þ
The task is to find the stain density maps N =n1,. . .ni, wherei= 1, 2, 3 corresponds to the
intensity of H stain, E stain, and the background for each pixel. Even though we assume that there are two stain colours in the image, the algorithm is applicable to images with more than two stains.
Given the optical density image as a three-rows matrix D = [drdgdb]T, where each row
cor-responds to one colour channel, we decompose each colour channel into its sub-bands
dl
a;dlh;dvl;dol, wherel= 1, 2,. . .L,Lis the level of decomposition in the wavelet transform and a,h,v, andodenote approximation, horizontal, vertical and diagonal sub-bands ofdat each level of decomposition.
For each levell, four three-dimensional sub-bandsal,hl,vl,olare composed as follows:
al¼ ½dl r;a d
l g;a d
l b;a h
l¼ ½dl r;h d
l g;hd
l b;h vl ¼ ½dl
r;v d l g;v d
l b;v o
l¼ ½dl r;od
l g;o d
l b;o
ð8Þ
A normalisation step is applied to each sub-bands so that it has zero mean and unit vari-ance. This is required to ensure that all the values are in the same scale before performing the non-Gaussianity comparison. We use kurtosisKto measure Gaussianity for each sub-band in Eq (8).
For a Gaussian distribution,Kis equal to zero. Thus, we select sub-bands that maximise |K|. Each one of the selected sub-bands is reshaped into a three-rows matrix, where each row is one colour channel. Finally, selected sub-bands are concatenated to each other horizontally to form a single matrix D0of size 3×pwherepis the total number of pixels in all the selected
sub-bands. We selected 20 sub-bands from all five levels of decomposition and ordered them based on their kurtosis values. Then, we apply ICA to D0to find the mixing matrix M as follows,
M¼
mr;1 mr;2 mr;3
mg;1 mg;2 mg;3
mb;1 mb;2 mb;3
2 6 6 6 6 6 6 6 4 3 7 7 7 7 7 7 7 5
ð9Þ
wheremr,i,mg,i, andmb,iare the mixing parameters of the red, green and blue colour channels
forH,E, and background fori= 1, 2, 3, respectively.
Finally, stain colour distribution in the OD space is generated using the inverse ofEq (7). Therefore, we multiply the inverse of M with the original OD image D.
N¼M 1D
In contrast to most of the existing algorithms which rely only on colour information to per-form deconvolution, the proposed approach automatically estimates the mixing matrix inEq (2)by incorporating colour and texture of histology images. Using a filtered image rather than the OD image to find the stain matrix has several advantages: First, it only uses filtered and independent observations to reduce the contamination of signals when estimating stain matrix. Second, it takes texture information into account which is correlated with stain colours in histology images.
Results
Datasets
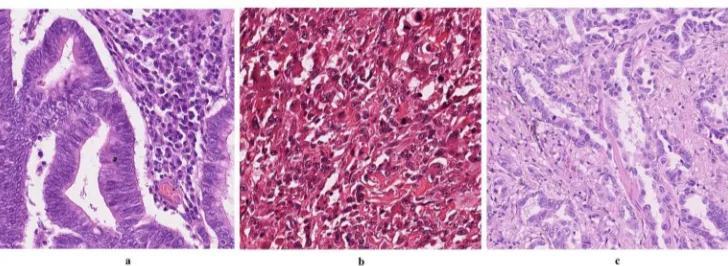
Stain chemicals bind differently to different tissue types. Therefore, it is essential to evaluate a stain deconvolution algorithm using different tissue types. We have also considered the varia-tion in stain colour consistency by collecting images that have been scanned in two different labs. For the first and third datasets, automated H&E staining machine used was Tissue-Tek Prisma by Sakura joined to the coverslipping machine, Sakura Finetek Europe B.V. KvK / Chamber of Commerce Leiden 28065449. A sample image from each dataset is shown inFig 3. In each dataset, we have selected a number of visual fields.
1. Colon Cancer Histology Images:
The first dataset consists of seven colon cancer whole-slide images from different patients stained with H&E and scanned at 20×magnification by Omnyx VL120 scanners at UHCW. For each whole-slide image, two non-overlapping images of size 500×500 pixels are extracted from the same visual field. Selected visual fields represent areas with different stain colour distributions. They also include regions containing both tumour and non-tumour tissue.
2. Breast Cancer Histology Images:
[image:8.612.204.568.518.651.2]The second dataset comprises of three breast cancer whole-slide images from different patients stained with H&E. The slides have been scanned at 40×magnification by Aperio ScanScope XT scanners at the Pathology Department of the University Medical Center Utrecht, Utrecht, The Netherlands. The dataset has been published as part of the MICCAI contest on the Assessment of Mitosis Detection Algorithms (AMIDA2013) [19]. For each whole-slide image, we selected two non-overlapping images of size 2,000×2,000 pixels.
Fig 3. Sample images from the datasets used in our experiments. Images a, b, and c are samples from
colon, breast, and lung cancer images, respectively. All of the datasets are H&E stain images. One can notice the huge variation in the colour appearance as they are applied to different tissue types and processed in different labs using two different scanners. These variations in colour appearance are really challenging for most of the stain deconvolution algorithms.
3. Lung Cancer Histology Images:
The third dataset consists of two lung cancer whole-slide images from two different patients. Slides are stained with H&E and scanned at 40×magnification by Omnyx VL120 scanner at UHCW. For each whole-slide image, two non-overlapping images of size 2,000×2,000 pixels are extracted from the same visual field.
Evaluation
In this section, we provide both quantitative and qualitative assessments of the proposed algo-rithm, in comparison to some of the recent existing methods of stain deconvolution. For the quantitative analysis, we perform three different experiments: First, we evaluate the accuracy of the estimated stain vector representing the concentration of the applied stain. Next, we eval-uate the accuracy of the estimated density map, which is related to the amount of absorbed stain colour at each pixel. Third, we assess the performance of a nuclei detection algorithm [2, 28], which uses the H channel as a learning feature. In the following sub-sections, we describe each experiment and show the associated results. All data used in this experiments and the code files are placed in the supporting document fileS1 Fileattached with this manuscript.
Evaluating the Estimated Stain Matrix. The stain matrix defines the principal colour of each applied stain. Each vector of the stain matrix represents the RGB values within the OD space for one stain colour. It is essential to find an accurate stain matrix, as it will affect the esti-mated stain colour intensity. However, we need a reference ground truth stain matrix in order to evaluate the quality of an estimated stain matrix. Thus, for each visual field, we have gener-ated the ground truth stain matrix as follows: A set of pixels are selected from all images in the visual field. Note that pixels are selected based on their biological structure rather than their stain colour. This means that, for Haematoxlyin, we only selected pixels that belong to nuclei. For Eosin, we selected pixels that belong to cytoplasm. For a given stain, we calculated its stain vector by taking the median of each colour channel across the selected pixels in OD space. The final stain matrix is generated by horizontal concatenation of all the stain vectors. We then compute the Euclidean distance between the estimated stain vector and the ground truth stain vector.
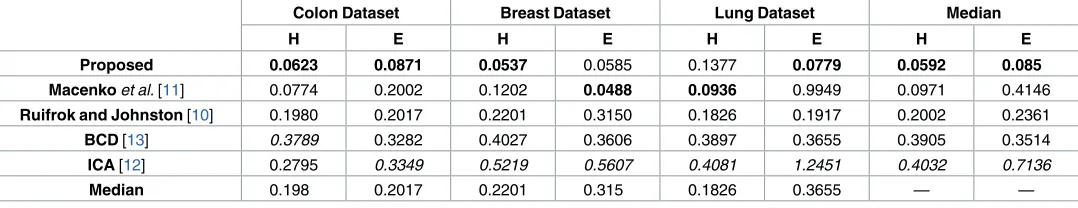
[image:9.612.37.576.597.701.2]Results shown inTable 1reveal that the proposed method outperforms Macenkoet al. algo-rithm [11] for H channel estimation by around 2–7% for colon and breast datasets. For the E channel estimation, we report an improvement by 11–92% for colon and lung datasets, respec-tively. Ruifrok and Johnston algorithm [10] produce a higher euclidean distance of the H and E estimation by 4–17% and 11–27% compared to the proposed method for colon, breast and lung datasets respectively. For the BCD [13], we noticed the tendency of dark intensity colour for all of the datasets. The estimation error for BCD is 25–35% for H and 24–30% for E larger than the error reported for the proposed method in all the three datasets. This is because the
Table 1. Euclidean Distance between the estimated stain matrix and the ground truth. The median of the Euclidean distances for each method is shown
in the last two columns. Last row shows the median of the Euclidean distances for all methods to highlight the significance of the best achieved median values.
Colon Dataset Breast Dataset Lung Dataset Median
H E H E H E H E
Proposed 0.0623 0.0871 0.0537 0.0585 0.1377 0.0779 0.0592 0.085 Macenko et al. [11] 0.0774 0.2002 0.1202 0.0488 0.0936 0.9949 0.0971 0.4146
Ruifrok and Johnston [10] 0.1980 0.2017 0.2201 0.3150 0.1826 0.1917 0.2002 0.2361
BCD [13] 0.3789 0.3282 0.4027 0.3606 0.3897 0.3655 0.3905 0.3514
ICA [12] 0.2795 0.3349 0.5219 0.5607 0.4081 1.2451 0.4032 0.7136
Median 0.198 0.2017 0.2201 0.315 0.1826 0.3655 — —
algorithm is mainly concerned about the deconvolution more than the stain colour estimation. This is clear in the separation results achieved by [13], seeFig 4.
In order to find the effect of number of sub-bands in our proposed method, we run an experiment on the datasets described above. We performed this experiment using 5, 10, 15, and 20 number of sub-bands. Results inTable 2show the Euclidean distance for the estimated H and E stain vectors and the ground truth. We found that for most of the datasets, using all the 20 sub-bands improves the accuracy of the generated stain vectors. For the first dataset, using 5 and 20 sub-bands generated closest stain vectors to the ground truth with a distance between them of 0.02. For the third dataset, a number of 10 and 20 sub-bands gives the highest accuracy with Euclidean distance of 0.06. Similarly, 20 sub-bands gives the highest accuracy for the second dataset.
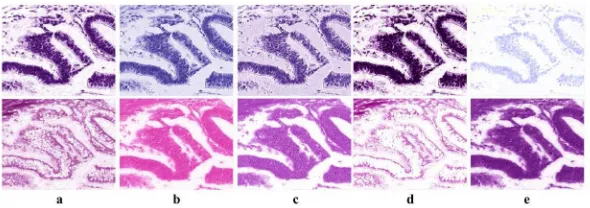
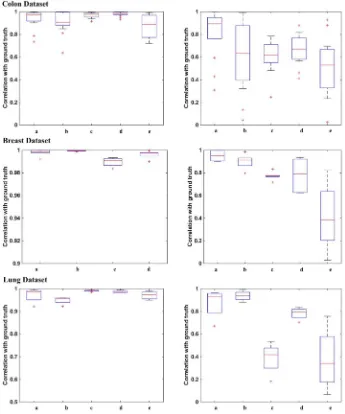
[image:10.612.203.498.77.181.2]Evaluating Density Map Estimation. A density map shows the distribution of a particu-lar stain across the section. For each image, the ground truth density map is generated using the corresponding ground truth stain matrix. The correlation coefficients between the esti-mated and ground truth density maps for each of the three datasets are shown inFig 5. Figures show that the weaker stain (Eosin) becomes more challenging to estimate for most of the algo-rithms. Although most of the algorithms are performing comparatively when it comes to esti-mating the stronger stain, Haematoxylin in this case, only the proposed algorithm and Macenkoet al.[11] are able to provide the most satisfactory results for Eosin with a median correlation of 89% and 63% respectively for colon tissues 95% and 91%, respectively for breast tissue, and 93% and 94%, respectively for the lung tissues. Correlation values for all datasets with the correspondingp-valuesare shown inFig 6. To particularly investigate the improve-ment of the estimated stains when applying ICA to the filtered image rather than the raw OD image,Fig 7shows a Bland Altman plot for the same randomly selected pixels for both Fig 4. Stain colour deconvolution results for a colon tissue image. The first and second rows show the H
and E channels, respectively for each algorithm. Column a, b, c, d, and e shows the deconvolution results for the Proposed method, Ruifrok and Johnston [10], Macenko et al. [11], BCD [13],and CA [12], respectively. There are two factors one could look at when evaluating the qualitative separation results, first: the accuracy of the separation and second:the stain colour estimation. In this sample image, we can see that the proposed method is achieving good stain separation and stain colour estimation compared to the other methods.
doi:10.1371/journal.pone.0169875.g004
Table 2. Euclidean Distance between the estimated stain matrix and the ground truth. Stain matrix is estimated using the proposed method by changing
the number of selected sub-bands.
Number of sub-bands
5 10 15 20
H E H E H E H E
Colon Dataset 0.0467 0.0938 0.1113 0.0877 0.1316 0.1051 0.0623 0.0871 Breast Dataset 0.1490 0.1519 0.1077 0.1458 0.1304 0.1415 0.0537 0.0585 Lung Dataset 0.0589 0.0980 0.0457 0.0850 0.0372 0.0925 0.1377 0.0779
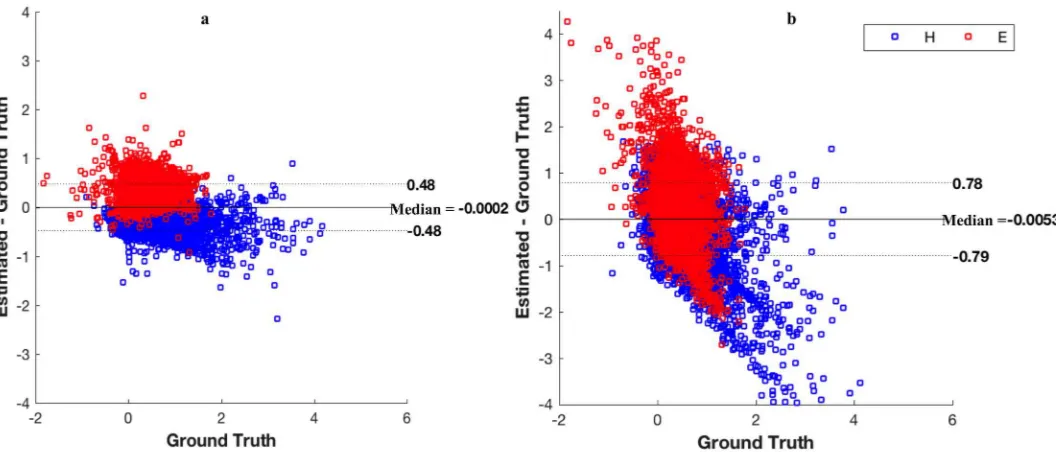
[image:10.612.37.577.618.695.2]proposed method and ICA [12] in all the three datasets. It is noticeable that in the proposed method most of the pixels are lying within the limits of agreements while in ICA [12] there is a wide spread of differences between the estimated density values and the ground truth (y-axis). This illustrates that by filtering the original OD image, correlation between the original sources can be reduced and thus sources are more independent and hence more separable.
[image:11.612.199.544.80.494.2]It is worth noting here that density map and stain matrix estimation are interrelated to each other. In fact, inaccurate estimation of the stain matrix will result in the wrong stain colour and in that case the estimated density map is actually meaningless. In other words, without having the accurate stain matrix estimated, the density map does not actually represent the stain under observation. Therefore, we need to look to both factors when we are comparing Fig 5. Correlation between the density maps and the ground truth. Indices a, b, c, d, and e of the x-axis
show the correlation results for the Proposed method, Macenko et al. [11], Ruifrok and Johnston [10], BCD [13],and ICA [12], respectively. Due to the high difference in the correlation margin between ICA and the other algorithms in the H density estimation for the second dataset, ICA has been removed in order to make the correlations of the other algorithms noticeable.
stain deconvolution algorithms. An example of this is shown inFig 4. One can notice that the estimated stain channels by [10–12] are far from the actual stain colours in the original image. The reason behind that is for [10], the stain matrix is pre-calculated and fixed for all images. In case of [13], projection on the Maxwellian chromaticity plane removes the small variations within one stain colour which results in a very rough separation between stain channels, see Fig 8for a closer view of the deconvolution results.
Fig 6. Correlation between the density maps and the ground truth with the associated p-values above each method for the H (left) and E (right) stains in all the three datasets. Indices a, b, c, d, and e of the
x-axis show the correlation results of among all datasets for the Proposed method, Macenko et al. [11], Ruifrok and Johnston [10], BCD [13],and ICA [12], respectively Notice that most of the proposed methods perform similarly in estimating H satin (left). However, the weaker stain (E) is more challenging to estimate (right). Proposed method keeps its performance in estimating Eosin stain with mean significance of p-value<0.05.
doi:10.1371/journal.pone.0169875.g006
Fig 7. Bland Altman plot for the proposed method (left) and ICA [12] (right) for H and E stains using all datasets. Same randomly selected pixels are
plotted from all three datasets by running the proposed method and ICA [12]. Median of agreement is -0.002 for the proposed method and -0.005 for [12]. Limits of agreements for the proposed method is [-0.48, 48] compared to [-0.79, 0.78] for ICA [12].
[image:12.612.44.572.441.667.2]Assessment of Tumour Nuclei Detection using the Estimated H channel. In this section we demonstrate that an accurate deconvolution for histology images could improve the perfor-mance in the further processing, such as nuclei detection. In this experiment, we evaluate the performance of the proposed stain deconvolution method using a nuclei detection algorithm proposed in [2,28]. The algorithm uses a Spatially Constrained Convolutional Neural Network (SC-CNN) to detect the centroids of nuclei in colon histopathology images. The method uses the H and Labchannels to find nuclei features. We use a sub-set of 20 images of the dataset
[image:13.612.149.574.77.308.2]and ground truth used in [2] to evaluate our method against the other published methods. For each of the evaluated algorithms, H channel is generated for all the images. Then, SC-CNN is re-trained using only the H channel for each algorithm separately. Results inTable 3show that the proposed methods significantly improves the achieved F1 score compared to other method. Ruifrok and Johnston method [10] is not included in this experiments as the stain matrix is constant in all images and hence it is not reflecting the stability in stain colour Fig 8. Estimation of Eosin channel for a sample image. Images a,b,c,d and e corresponds to the original image, Ruifrok and
Johnston [10], Macenko et al. [11], BCD [13], respectively. We can notice in Ruifrok and Johnston method [10] that the pre-estimated mixing parameters is actually not reflecting the Eosin stain colour distribution in the original image. In Macenko et al. [11] method, the colour estimation is affected by the correlation between the two stain colours. In BCD method [13], the fine variation within the H stain is merged with the E due to the projection on the chromaticity plane. In the proposed method however, the variation of the stain colour distribution in the original image is perfectly reflected and H channel is smoothly separated.
doi:10.1371/journal.pone.0169875.g008
Table 3. Results of nuclei detection algorithm in [2,28] trained and tested for different stain deconvolution algorithms. Values show the mean and
standard deviation for each of the precision, recall, and F1 score measures. Note that the evaluated algorithms are dynamically estimating stain colour based on current information. Thus, consistency of the algorithm could improve the detection accuracy. However, we did not include stain normalization in this exper-iments to avoid affecting the deconvolution results.
Precision Recall F1 score
Proposed 0.809±0.1972 0.419±0.2404 0.520±0.223
BCD [13] 0.469±0.384 0.399±0.419 0.352±0.363
Macenko et al. [11] 0.407±0.281 0.553±0.335 0.374±.0270
ICA [12] 0.370±0.351 0.416±0.262 0.288±0.240
[image:13.612.38.576.632.697.2]estimation. Therefore, the factor that we are measuring here, i.e. stain colour consistency after the deconvolution, is not applicable to that method.
Conclusions
In this paper, we presented a novel method for stain deconvolution of histology images using multi-resolution wavelet representation of the image to estimate stain mixing matrix. We pro-pose filtering the input image to allow the independent observations to pass through. We then use independent observations from the colour channels to estimate stain matrix which is not affected by the correlated signals. The estimated stain matrix is then applied to the raw image to find the individual stain colour distribution. We have shown through extensive experiments that the proposed algorithm outperforms the recent stain deconvolution algorithms. Our future direction would be customising the number of selected sub-bands to the image under process. Since images have different histology structure and the distribution of the stain col-ours are variable from one image to another, we can utilise this to allow dynamic estimation of the number of selected sub-bands and thus improve both computational and time complexity of our algorithm.
Supporting Information
S1 File. Data and code. This ZIP file contains all data and the MatLab code files for the pro-posed algorithm. Folder Data contains two folders: Folder GroundTruth contains the data used to perform the experiment and folder RGB-images contains all images used to generate data for experiments.
(ZIP)
Acknowledgments
We would like to thank Milan Gavrilovic [13] for his help in implementing their algorithm. We are also grateful to Korsuk Sirinukunwattana [2,28] for providing the code of nuclei detec-tion to be used in running the third experiment above. We would also like to thank Dr. Yee-Wah Tsang from the University Hospitals Coventry and Warwickshire for providing the anno-tated data used in [2,28] and in this work.
Author Contributions
Conceptualization: NA SR NMR.
Data curation: NA DS NMR.
Formal analysis: NA SR NMR.
Funding acquisition: NA NMR.
Investigation: NA SR NMR.
Methodology: NA.
Project administration: NA SR NMR.
Resources: DS NMR.
Software: NA.
Validation: NA SR NMR.
Visualization: NA SR NMR.
Writing – original draft: NA NT SR NMR.
Writing – review & editing: NA NT SR DS NMR.
References
1. Vink JP, Van Leeuwen MB, Van Deurzen CHM, De Haan G. Efficient nucleus detector in histopathology images. Journal of Microscopy. 249: p.124–35, 2013. doi:10.1111/jmi.12001PMID:23252774
2. Sirinukunwattana K, Raza S, Tsang YW, Snead D, Cree I, Rajpoot N. A spatially constrained deep learning framework for detection of epithelial tumor nuclei in cancer histology images. International Workshop on Patch-based Techniques in Medical Imaging (Patch-MI). p.154–162, 2015.
3. Khan AM, Rajpoot N, Treanor D, Magee D. A nonlinear mapping approach to stain normalization in digi-tal histopathology images using image-specific color deconvolution. IEEE transactions on bio-medical engineering. 61(6): p.1729–38, 2014. doi:10.1109/TBME.2014.2303294PMID:24845283
4. Magee D, Treanor D, Crellin D, Shires M, Smith K, Mohee K, et al. Colour Normalisation in Digital Histo-pathology Images. Optical Tissue Image analysis in Microscopy, HistoHisto-pathology and Endoscopy (MIC-CAI Workshop). p.100–111, 2009.
5. Li X, Plataniotis KN. A Complete Color Normalization Approach to Histopathology Images Using Color Cues Computed From Saturation-Weighted Statistics. IEEE transactions on bio-medical engineering. 62(7): p.1862–73, 2015. doi:10.1109/TBME.2015.2405791PMID:25706507
6. Yagi Y. Color standardization and optimization in whole slide imaging. Diagnostic Pathology. 2011; doi:
10.1186/1746-1596-6-S1-S15
7. Reinhard E, Ashikhmin M, Gooch B, Shirley P. Color transfer between images. IEEE Computer Graph-ics and Applications. 21. p.34–41, 2001. doi:10.1109/38.946629
8. Ehteshami Bejnordi B, Litjens G, Timofeeva N, Otte-Holler I, Homeyer A, Karssemeijer N, et al. Stain specific standardization of whole-slide histopathological images. IEEE Transactions on Medical Imag-ing. 2015.
9. Vicory J, Couture HD, Thomas NE, Borland D, Marron JS, Woosley J, et al. Appearance normalization of histology slides. Computerized Medical Imaging and Graphics. p.89–98, 2015. doi:10.1016/j. compmedimag.2015.03.005PMID:25863518
10. Ruifrok A, Johnston D. Quantification of histochemical staining by color deconvolution. Analytical and quantitative cytology and histology, the International Academy of Cytology and American Society of Cytology. 23: p.291–9, 2001.
11. Macenko M, Niethammer M, Marron JS, Borland D, Woosley JT, Schmitt C, et al. A method for normal-izing histology slides for quantitative analysis. 2009 IEEE International Symposium on Biomedical Imag-ing: From Nano to Macro. p.1107–1110, 2009.
12. Trahearn N, Snead D, Cree I, Rajpoot N. Multi-class stain separation using independent component analysis. In: Proc. SPIE 9420, Digital Pathology. 2015.
13. Gavrilovic M, Azar JC, Lindblad J, Wahlby C, Bengtsson E, Busch C, et al. Blind color decomposition of histological images. IEEE transactions on medical imaging. 32(6): p.983–94, 2013. doi:10.1109/TMI. 2013.2239655PMID:23322760
14. Rabinovich A, Agarwal S, Laris C, Price JH, Belongie SJ. Unsupervised Color Decomposition Of Histo-logically Stained Tissue Samples. Advances in Neural Information Processing Systems 16. p.667–674, 2004.
15. Alsubaie N, Trahearn N, Raza S, M Rajpoot N. A discriminative framework for stain deconvolution of histopathology Images in the Maxwellian Space. proceedings of Medical Image Understanding and Analysis, 19th Annual Conference, UK. p.132–137, 2015.
16. Kather JN, Weis CA, Marx A, Schuster AK, Schad LR, Zollner FG. New Colors for Histology: Optimized Bivariate Color Maps Increase Perceptual Contrast in Histological Images. PLoS ONE. 10(12): p.1–22, 2015. doi:10.1371/journal.pone.0145572
17. Cardoso J, won Lee T. Dependence, correlation and gaussianity in independent component analysis. Journal of Machine Learning Research. p. 1177–1203,2003.
19. Veta M, van Diest PJ, Willems SM, Wang H, Madabhushi A, Cruz-Roa A, et al. Assessment of algo-rithms for mitosis detection in breast cancer histopathology images. Medical image analysis. 20(1). p.237–48, 2015. doi:10.1016/j.media.2014.11.010PMID:25547073
20. Tanaka T, Cichocki A. Subband decomposition independent component analysis and new performance criteria. proceedings of IEEE International Conference on Acoustics, Speech, and Signal Processing (ICASSP). 5:p.541–4, 2004.
21. Celis R, Romo D, Romero E. Blind colour separation of H&E stained histological images by linearly transforming the colour space. Journal of Microscopy. 260(3): p.377–88, 2015. doi:10.1111/jmi.12304
PMID:26356123
22. Hyvarinen A, Karhunen J, Oja E. Independent component analysis. J. Wiley. 2001.
23. Cichocki A, Rutkowski T, Siwek K. Blind signal extraction of signals with specified frequency band. pro-ceedings of the 12th IEEE Workshop Neural Networks for Signal Processing. p.515–524, 2002
24. Hyva¨rinen A, Oja E. Independent component analysis: algorithms and applications. Neural Networks. 13: p.411–30, 2000. doi:10.1016/S0893-6080(00)00026-5PMID:10946390
25. Mallat SG. A theory for multiresolution signal decomposition: the wavelet representation. IEEE Transac-tions on Pattern Analysis and Machine Intelligence. 11(7): p.674–693, 1989. doi:10.1109/34.192463
26. Daubechies I. Ten Lectures on Wavelets (CBMS-NSF Regional Conference Series in Applied Mathematics).1992.
27. Zhang K, Chan LW. An adaptive method for subband decomposition ICA. Neural Computation. 18(1): p.191–223, 2006. doi:10.1162/089976606774841620
![Table 3. Results of nuclei detection algorithm in [2, 28] trained and tested for different stain deconvolution algorithms](https://thumb-us.123doks.com/thumbv2/123dok_us/9434187.450111/13.612.149.574.77.308/table-results-detection-algorithm-trained-different-deconvolution-algorithms.webp)
