Supra-threshold auditory brainstem response amplitudes in humans: Test-retest reliability, electrode montage and noise exposure
Garreth Prendergasta,*, Wenhe Tua, Hannah Guesta, Rebecca E. Millmana,b, Karolina Kluka,b, Samuel Coutha, Kevin J. Munroa,b, Christopher J. Placka,b,c
a, Manchester Centre for Audiology and Deafness, University of Manchester, Manchester Academic Health Science Centre, M13 9PL, UK.
b, NIHR Manchester Biomedical Research Centre, Central Manchester University Hospitals NHS Foundation Trust, Manchester Academic Health Science Centre, Manchester, M13 9WL, UK.
c, Department of Psychology, Lancaster University, Lancaster, LA1 4YF, UK.
Abstract
The auditory brainstem response (ABR) is a sub-cortical evoked potential in which a series of well-defined waves occur in the first ten milliseconds after the onset of an auditory stimulus. Wave V of the ABR, particularly wave V latency, has been shown to be
remarkably stable over time in individual listeners. However, little attention has been paid to the reliability of wave I which reflects auditory nerve activity. This ABR component has attracted interest recently, as wave I amplitude has been identified as a possible non-invasive measure of noise-induced cochlear synaptopathy. The current study aimed to determine whether ABR wave I amplitude has sufficient test-retest reliability to detect impaired auditory nerve function in an otherwise hearing listener. Thirty normal-hearing females were tested, divided into equal groups of low- and high-noise exposure. The stimulus was an 80 dB nHL click. ABR recordings were made from the ipsilateral
1
2
3
4 5 6
7
8
9
10
11
12
13
14
15
16
17
18
19
20
21
22
23
24
25
26
mastoid and from the ear canal (using a tiptrode). Although there was some variability
between listeners, wave I amplitude had high test-retest reliability, with an intraclass correlation coefficient (ICC) comparable to that for wave V amplitude. There were slight gains in reliability for wave I amplitude when recording from the ear canal (ICC of 0.88) compared to the mastoid (ICC of 0.85). The summating potential (SP) and ratio of SP to wave I were also quantified and found to be much less reliable than measures of wave I and V amplitude. Finally, we found no significant differences in the amplitude of any wave components between low- and high-noise exposure groups. We conclude that, if the other sources of between-subject variability can be controlled, wave I amplitude is sufficiently reliable to accurately characterize individual differences in auditory nerve function.
Keywords
Auditory brainstem response; test-retest reliability; cochlear synaptopathy; summating potential; electrode montage
Highlights
ABR wave I and V amplitudes have excellent test-retest reliability in humans SP amplitude and SP/AP ratio have poor test-retest reliability
Canal tiptrodes result in only slightly increased reliability re. mastoid electrodes
No significant differences in amplitudes between low- and high-noise exposed females
28
29
30
31
32
33
34
35
36
37
38
39
40
41
42
43
44
45
46
47
1. Introduction
The auditory brainstem response (ABR) is a well-established diagnostic tool widely used in the clinic to assess auditory function (see Hall, 1992, for an overview). The ABR is evoked by transient stimuli, typically clicks or tone bursts, and consists of a series of waves, with wave I reflecting auditory nerve function, and wave V resulting from generators in the rostral brainstem. The threshold and latency of wave V are the most common clinical metrics of the response. However, wave I has also proved valuable, particularly in
research studies, as a more direct measure of peripheral auditory function (Schaette and McAlpine, 2011; Santos et al., 2017).
Wave I amplitude has attracted considerable interest recently, following the demonstration of noise-induced cochlear synaptopathy in the mouse model by Kujawa and Liberman (2009). In the base of the cochlea, up to 50% of synapses between inner hair cells and auditory nerve fibers were destroyed after a 2-hour exposure to 100 dB SPL noise (8-16 kHz). Post-exposure measures of absolute auditory sensitivity were unaffected but histological analyses confirmed the dramatic loss of cochlear synapses. Post-exposure ABR measures showed unaffected responses close to threshold. However, at medium-to-high sound intensities there was a permanent reduction in the amplitude of wave I of the ABR (by 60% at 32 kHz and ~30% at 12 kHz), reflecting decreased auditory nerve activity.
These results suggest that wave I of the ABR might have potential as a non-invasive measure of cochlear synaptopathy in human listeners. However, the evidence for noise-induced synaptopathy in humans, based on ABR results, is somewhat inconsistent. Recent work from our laboratory has found no evidence that greater lifetime noise exposure, which we assume to be a proxy for greater synaptopathy, is associated with a
55
56
57
58
59
60
61
62
63
64
65
66
67
68
69
70
71
72
73
74
75
76
77
78
79
reduction in ABR amplitude for normal hearing listeners (Prendergast et al., 2017) or listeners with tinnitus (Guest et al., 2017). An absence of a relation between noise
exposure and ABR wave I amplitude has also recently been reported by a number of other laboratories using different normal-hearing cohorts (Spankovich et al., 2017; Grinn et al., 2017; Fullbright et al., 2017). Liberman et al. (2016) also reported no significant reduction in wave I amplitude with increasing noise exposure but did find a significantly increased ratio between the summating potential (SP; reflecting hair cell function) and action
potential (AP; equivalent to wave I of the ABR, reflecting auditory nerve function). Bramhall et al. (2017) reported that some groups of firearm users exhibited reduced ABR wave I amplitudes consistent with cochlear synaptopathy and Grose et al. (2017) found a reduced wave I/V ratio in noise-exposed listeners relative to controls. There remain many
unanswered questions regarding how these studies can best be reconciled and the extent to which high-frequency hearing loss, gender, and homogeneity of noise exposure can account for the differing evidence for this phenomenon in humans. One additional concern, despite the clear changes in ABR wave I in the animal model of synaptopathy, is whether the ABR is the best tool for identifying these neural changes in the human listener.
If the early waves of the ABR are to have utility as a diagnostic measure in individual listeners, they must be reliable, with low measurement error. As ABR wave I amplitude tends to be lower than wave V amplitude, the response may be more difficult to measure reliably (Mehraei et al., 2016). However, there is little available evidence that addresses this issue directly. Much work on the test-retest reliability of the ABR focuses on the latency of wave V because of its clinical relevance. Edwards et al. (1982) provided an overview of ABR amplitude and latency reliability across a six month period, using 72 dB nHL (72 dB above the normal adult hearing threshold) monaural clicks in 10 listeners. No significant differences emerged between sessions for any wave amplitudes or latencies, or
81
82
83
84
85
86
87
88
89
90
91
92
93
94
95
96
97
98
99
100
101
102
103
104
105
for wave I/V ratios. Using a mean-squared-difference approach, it was found that the participant contributed most variability to the measured responses, followed by ear,
session (different days), and run (different acquisition on the same day); however, this was only estimated using wave latency. Lauter and Loomis (1986; 1988) tested seven listeners in eight separate weekly sessions and all waves (I-V) were evaluated. The data show high repeatability across the different testing sessions for both amplitude and latency. Rather than a formal assessment of reliability, the approach used the coefficient of variation (CoV; standard deviation divided by the mean) as a marker of “stability” and used ANOVAs to determine that between-subject variability was significantly greater than within-subject variability. Munjal at al. (2016) evaluated the long-term test-retest reliability of the ABR in 50 normal hearing listeners at 3, 6 and 12 month intervals. Only latencies and inter-peak latencies were studied, which demonstrated good reliability overall, although there were differences in the absolute latency of wave I across the different test intervals.
The studies discussed above all used either linear correlations or ANOVAs to estimate the reliability of ABR responses across multiple sessions. These statistical tools are not formal methods of quantifying reliability, unless the ANOVA is set up in an appropriate manner (Zaki et al., 2012; Kim, 2013). A more appropriate method is to use the intra-class
correlation coefficient (ICC; Shrout and Fleiss, 1979), which estimates the proportion of the total variance that can be attributed to between-subject variability. Recently, Bidelman et al. (2017) used the ICC to study the test-retest reliability of sub-cortical and cortical auditory evoked potentials. Wave V of the ABR was evaluated, in response to an 80 dB nHL click stimulus, and the amplitude and latency ICCs were 0.65 and 0.76 respectively, reflecting good test-retest reliability.
The primary motivation for the current study was to determine the test-retest reliability of
107
108
109
110
111
112
113
114
115
116
117
118
119
120
121
122
123
124
125
126
127
128
129
130
131
ABR wave I, to evaluate its suitability for measuring auditory nerve function in individual human listeners. There were also a number of secondary questions which the present study was able to address in parallel to the main research question. By using two different EEG montages, a scalp-mounted mastoid electrode and a canal tiptrode (a gold-wrapped foam insert which records the electrical potential from the ear canal), we were able to determine the extent to which reliability is improved by recording from closer to the neural generator of wave I. A canal tiptrode is known to produce a larger wave I response than a scalp-mounted mastoid electrode (Bauch and Olsen, 1990), and it was therefore predicted that the canal tiptrode would produce a more reliable response by virtue of an enhanced signal-to-noise ratio. Furthermore, by using a tiptrode (which emphasizes the SP) we were able to measure the reliability of the SP/AP ratio (utilized by Liberman et al., 2016), and thus evaluate the potential clinical utility of this measure for the detection of synaptopathy.
Finally, the study recruited groups of low- and high-noise exposed female listeners to determine whether changes in the ABR or SP/AP are associated with noise exposure in a single-sex cohort in which audiometric function is tightly controlled. It was predicted that high-noise exposed listeners would yield smaller wave I amplitudes, and larger SP/AP ratios, than low-noise exposed controls.
2. Methods
2.1. Participants and test sessions
133
134
135
136
137
138
139
140
141
142
143
144
145
146
147
148
149
150
151
152
153
154
155
156
157
Thirty female participants were tested, all with clinically normal audiometric thresholds (see section 2.3 and Fig. 1). Participants were recruited into two equal-sized groups based on noise exposure histories (see section 2.2). The mean age of participants in the
low-exposure group was 23.87 years (range, 19-31) and in the high-low-exposure group was 24.87 years (range, 20-34). The study was approved by the University of Manchester Research Ethics Committee (project number 16206) and informed, written consent was obtained from all participants.
Testing was conducted over three sessions. Noise exposure estimates and pure tone audiometry were performed in the first session to establish eligibility. The second session (Test 1, T1) consisted of the ABR and distortion product otoacoustic emmission (DPOAE) recordings. The third and final session (Test 2, T2) was a replication of session 2 and was completed on a different day to that of session 2. There were no criteria to constrain how many days elapsed between T1 and T2, provided it was at least 12 hours. Each test session took approximately 1 hour. The average number of days between test sessions was 3.5 (s.d. = 3.3; range = 1-12) for the low-noise exposure group and 3.3 (s.d. = 2.7; range = 1-8) for the high-noise exposure group.
2.2. Noise exposure
Lifetime noise exposure was estimated using a structured interview developed to assess the effectiveness of the UK noise at work regulations (Lutman et al., 2008). The specific implementation used is described fully in Guest et al. (2017). In summary, participants are asked to consider any high-noise (above ~ 80 dBA) environments/activities to which they have exposed themselves over the course of their lifetime. The duration and frequency of
159
160
161
162
163
164
165
166
167
168
169
170
171
172
173
174
175
176
177
178
179
180
181
182
183
exposure is estimated from discussion with the participant and entered into the following formula:
U = 10(L-A-90)/10 x Y x W x D x H / 2080,
where U is cumulative noise exposure, L is estimated noise exposure level in dBA, A is attenuation of hearing protection in dB, Y is years of exposure, W is weeks of exposure per year, D is days of exposure per week, H is hours of exposure per day, and 2080 corresponds to the number of hours in a working year. One noise exposure unit is
equivalent to exposure for 1 year to a working daily level of 90 dBA. For our purposes, we used the raw units of noise exposure (linearly related to total energy of exposure above 80 dBA) and these were log transformed to produce a normal distribution. Each such
logarithmic unit is a factor of 10 in terms of lifetime exposure energy. The cut-off between the low- and high-noise exposure groups was a transformed score of 1.
2.3. Pure tone audiometry
Pure tone audiometry was performed in each ear separately at octave frequencies between 0.25 and 8 kHz in accordance with the British Society of Audiology (2011) recommended procedure. Air-conduction thresholds were measured in a
sound-attenuating booth using a Kamplex KC50 audiometer coupled to TDH-39P supra-aural headphones. The audiometric criterion for inclusion in the study was audiometric thresholds < 25 dB HL in both ears at all standard audiometric frequencies.
High-frequency audiometric thresholds were also acquired at 12 and 16 kHz using Sennheiser HDA 300 headphones.
185
186
187
188
189
190
191
192
193
194
195
196
197
198
199
200
201
202
203
204
205
206
207
208
209
2.4 DPOAEs
DPOAEs were acquired from both ears using the Otodynamics ILO v6 clinical OAE software interfaced with a laptop. The ILO probe microphone was calibrated daily using a 1-cc cavity. The frequency ratio of the two primary tones, f2/f1, was 1.22. Responses were recorded for f2 frequencies of 1, 1.5, 2, 3, 4, 6, and 8 kHz. The level of both tones was 70 dB SPL. The cubic distortion product (2f1-f2) amplitude was used as a measure of the DPOAE. Data collection was terminated after 240 low-noise sweeps had been obtained at each frequency. A signal-to-noise ratio of 3 dB was required for the DPOAE to be identified as present. 4% of the DPOAEs were not present (1.4% from the low-noise exposure group and 2.4% from the high-noise exposure group), and these values were excluded from the average and the calculation of confidence intervals.
2.5 ABRs
2.5.1 Recording procedure
Data were recorded using an ICS Chartr EP 200 (Otometrics) and insert earphones
supplied with the system. For both montages the positive electrode was placed at Cz. Two different reference electrodes were used; one coupled to the gold-wrapped insert eartip (canal tiptrode) and one standard electrode mounted on the ipsilateral mastoid. An
electrode placed on the contralateral mastoid served as the common ground. All electrode impedances were below 5 kΩ and data were sampled at 30 kHz. All recordings were performed by the same researcher to obtain consistent electrode placement, and canal tiptrodes were inserted by the same researcher such that the bottom edge of the foam insert was flush with the start of the ear canal.
211
212
213
214
215
216
217
218
219
220
221
222
223
224
225
226
227
228
229
230
231
232
233
234
235
Clicks were 100 μs in duration and presented in alternating polarity at 80 dB nHL (115.5 dB peSPL) at a rate of 11/s. Stimuli were presented to the right ear, without the left ear plugged. Signals were amplified with a gain of 50,000 and band-pass filtered between 0.1 and 1.5 kHz (with low- and high-pass roll-offs of 12 dB/octave and 6 dB/octave,
respectively). Data were collected over a 20-ms epoch and averaged for a minimum of 6000 repetitions. In sessions 2 and 3 (T1 and T2), two such recordings were made within a one-hour period (with the electrodes remaining attached between recordings). The grand average waveform, taken over both acquisitions, was used to characterize the response on each day. Participants lay in a comfortable position and were asked to remain still during the recordings. Data were acquired in a sound-treated, but not sound-proofed, room.
2.5.2 Response identification
Three waves were identified in each recording: the SP, wave I and wave V. The average waveform for each listener was subjected to an automated peak- and trough-picking procedure based on extracting the phase reversals from the first derivative of the time series (Prendergast et al., 2017). Time windows were constructed around waves I and V and the largest identified peak within the window was selected. The center of the window was determined by the peak in the grand average ABR waveform using all 30 participants and both montages, which were at 1.70 and 5.60 ms for waves I and V, respectively. The edges of the window were set by using standard deviations of ABR latency reported in response to a 70 dB nHL 100 μs click (Issa and Ross, 1995). Standard deviations were 0.17 ms for wave I and 0.21 ms for wave V. The bounds of the windows for our analyses were ± 3 standard deviations around the peak central values described above. The SP
237
238
239
240
241
242
243
244
245
246
247
248
249
250
251
252
253
254
255
256
257
258
259
260
261
peak was identified as a peak which occurred 0.5-1.5 ms after stimulus onset. If no peak was present in this time window, it was defined as the point at which the first differential of the waveform within this window was lowest, i.e. when the rate-of-change was closest to a phase reversal. Waves I and V were calculated as peak-to-trough, with the trough
constrained to fall within 2/2.5 ms of the identified peak for waves I and V respectively. If multiple troughs were present, the one which gave the largest peak-to-trough amplitude was used. The SP was defined as being peak-baseline rather than peak to trough. The baseline was calculated as the lowest value in the first 1 ms of the waveform (Liberman et al., 2016). To be consistent with Liberman et al. (2016), the AP values used to compute the SP/AP ratio were peak-baseline values rather than the peak-trough values more
commonly used to characterize wave I. This made little difference to the consistency of the SP/AP ratio across the test sessions. To make this distinction clear the manuscript will use the terms wave I (peak-to-trough) and AP (peak-to-baseline) to differentiate the two
measures. These analyses were performed in Python (version 2.7). S1 of Supplementary Materials provides a schematic of how each wave amplitude was calculated.
The peaks were visually inspected to ensure that they appeared to select waves I, V and the SP. It was confirmed that the automated procedure was performing appropriately and it was not necessary to redefine any of the peaks.
2.6. Statistical metrics
ANOVAs were used to determine if there were differences in wave amplitudes as a function of noise exposure. The CoV was used as a descriptive statistic of overall variability for the different groups, montages and the waves. For test-retest reliability, Spearman correlation coefficients were used as a descriptive statistic, but the ICC was
263
264
265
266
267
268
269
270
271
272
273
274
275
276
277
278
279
280
281
282
283
284
285
286
287
used to formally quantify the reliability of the measures across the test sessions. The ICC estimates the proportion of total variance that is subject rather than between-measurements. The ICC uses pooled scaling and standard deviations for the full dataset rather than for each group independently, and is more robust than Pearson correlation coefficients for estimating the correlation in small sample sizes. Furthermore, the assumptions of linearity implicit in a Pearson correlation coefficients can lead to high correlationsin cases where the ICC is in fact poor (McGraw and Wong, 1996). There are a number of different formulations for the ICC. Here ICC1 (as defined by Shrout and Fleiss, 1979) was used when both observations were from the same montage. ICC1 is sensitive to differences in means between the observations and is a measure of absolute
agreement. ICC3 was used when comparing observations between montages, which is insensitive to mean differences and the different observations are treated as fixed effects. In all cases, individual responses were treated as single measures rather than considering the reliability of average responses. All statistical analyses were performed in R (R Core Team, 2015).
3. Results
3.1. Noise exposure
The mean log-transformed noise-exposure score for the low-noise exposure group was -0.98 (std=1.05; min=-3.00; max=0.52) and for the high-noise exposure group was 1.55 (std=0.42; min=1.08; max=2.64). The high-noise exposure group had a mean lifetime exposure energy roughly 340 times that of the low-noise exposure group. The difference in exposure between the two groups was due to a combination of both level and duration. The loudest activities reported by the high-noise group were on average 12.5 dB more
289
290
291
292
293
294
295
296
297
298
299
300
301
302
303
304
305
306
307
308
309
310
311
312
313
intense than those of the low-noise group. The high noise group also reported average exposure durations for a single activity which were 2.5 times longer than those of the low-noise group. The high-low-noise group also typically reported more numerous exposure activities, and so the average total lifetime exposure was three times greater than for the low-noise group. The mean exposure for the low-noise group is equivalent, in terms of total energy, to that for an individual who goes to a nightclub or live music event for 1.5 hours, once per year, for five years. The mean high-noise exposure is equivalent to going to the same event for three hours, three times per week, every week of the year, for five years. These exposure values are comparable to those reported by Guest et al. (2017) and there is clear separation between the groups. The high-noise exposure group for the current study was less exposed than the highest-exposed participants reported by
Prendergast et al. (2017). Prendergast et al. (2017) tested a large cohort and inspection of these data indicate that when recruiting largely from a University population, a log
exposure value of 1.5 is high for people aged 18-25, with only 12% of people within this group reporting a log exposure score in excess of 1.5.
3.2. Pure tone audiometry
Fig. 1 shows pure tone audiometric thresholds for the test ear (right ear) of the two groups. The groups appear to be well matched and a mixed design ANOVA with within-subject factors of Ear (two levels; left, right) and Frequency (eight levels; 0.25, 5, 1, 2, 4, 8, 12, and 16 kHz) and a between-subjects factor of Group (two levels; low- and high-noise exposure) confirmed that there is no main effect of Group (F[1,28] = 1.15; p>0.05) nor Ear (F[1,28] = 0.22; p>0.05), but there is a significant main effect of Frequency (F[2,58] = 14.37; p<0.01). Bonferroni-corrected pairwise comparisons indicate that hearing
thresholds at 16 kHz are higher than all other frequencies except 0.25 kHz. Thresholds for
315
316
317
318
319
320
321
322
323
324
325
326
327
328
329
330
331
332
333
334
335
336
337
338
339
0.25 kHz are higher than those at 0.5, 1, 2 and 4 kHz. A significant three-way interaction between Ear x Frequency x Group was found (F[4,122] = 2.68; p<0.05). The high-noise group shows higher thresholds at 16 kHz compared to the low-noise exposure group in the left ear but not the right ear. Since ABRs were acquired from the right ear, the groups were well matched in terms of audiometric thresholds.
3.3. DPOAEs
Fig. 2 shows average DPOAE amplitudes for the two groups at each frequency in the test ear (right ear). DPOAEs were collected twice, in the same sessions as the ABR data (T1 and T2). A mixed design ANOVA was used with three within-subject factors of Ear (two levels; left and right), Frequency (seven levels; 1, 1.5, 2, 3, 4, 6, and 8 kHz) and Test-retest (two levels; T1 and T2), and a between-subject factor of Group (two levels; low- and high-noise exposure). There is no significant main effect of Group (F[1,12] = 0.23; p>0.05), Ear (F[1,12] = 0.24; p>0.05), nor Test-retest (F[1,12] = 0.18; p>0.05). A significant main effect of Frequency was found (F[2,28] = 11.12; p<0.01). Bonferroni-corrected pairwise
comparisons indicate that DPOAE amplitudes at 8 kHz are significantly lower than those at 1.5, 2, 4, and 6 kHz. No significant interactions were found (all p>0.05).
The attenuation of the response at 8 kHz, equivalent between exposure groups, is most likely related to the difficulties of obtaining reliable DPOAEs at this frequency rather than attributable to a deficit in OHC function. Responses at this frequency are affected by standing waves in the ear canal (Richmond et al., 2011) and the reflectance magnitude tends to be greatest at 8 kHz (Keefe et al., 1993). These factors in conjunction are thought to be responsible for the DPOAE amplitude at 8 kHz often being described as “poor” (Richmond et al., 2011; Gorga et al, 1993, 1997).
341
342
343
344
345
346
347
348
349
350
351
352
353
354
355
356
357
358
359
360
361
362
363
364
365
3.4. ABRs
3.4.1. Effects of session, montage, and group
Fig 3. shows the grand average ABR waveforms across sessions for the two electrode montages and the two groups of listeners (low- and high-noise exposure). The waveforms appear similar for the two groups. S2 of Supplementary Materials shows the individual waveforms of all 15 listeners in each group, for both electrode montages. Fig. 4 shows the average wave I and wave V amplitudes for the two groups for each montage and session, together with the I/V amplitude ratios. There is little difference between the groups or sessions. As expected, use of the canal tiptrode montage resulted in larger wave I amplitudes and smaller wave V amplitudes than the mastoid electrode. Equivalent information for wave I and V latency is reported in S3 of Supplementary Materials.
Fig. 5 shows average SP values for the two groups in each of the sessions and for both montages, and also SP/AP ratios. The SP values are about 50% larger for the canal tiptrode than the mastoid electrode. However, the SP/AP ratios are comparable in size across the two recording montages, with the difference in the montage means ~ 0.02.
Mixed design ANOVAs were used to characterize the response amplitudes for each wave of the response, and the ratio measures, separately. Within-subject factors of Test-retest (two levels; T1 and T2) and Montage (two levels; mastoid electrode, canal tiptrode), and a between-subject factor of Group (two levels; low- and high-noise exposure) were included.
For wave I, there is no main effect of Test-retest (F[1,28] = 4.16, p>0.05) nor Group
367
368
369
370
371
372
373
374
375
376
377
378
379
380
381
382
383
384
385
386
387
388
389
390
391
(F[1,28] = 0.14, p>0.05). There is a main effect of Montage (F[1,28] = 209.60, p<0.001) and Bonferroni-corrected post-hoc tests confirm that wave I amplitudes are greater for the canal tiptrode than the mastoid electrode. There are no significant interactions between factors.
For wave V, there is no main effect of Test-retest (F[1,28] = 0.70, p>0.05) nor Group (F[1,28] = 0.33, p>0.05). There is a main effect of Montage (F[1,28] = 120.68, p<0.001) and Bonferroni-corrected post-hoc tests confirm that wave V amplitudes are greater for the mastoid electrode than the canal tiptrode. There are no significant interactions between factors. The wave I/V ratios show no significant interactions and no main effect of Test-retest (F[1,28] = 0.09, p>0.05) nor Group (F[1,28] = 1.58, p>0.05). As expected, there is a significant main effect of Montage (F[1,28] = 282.52, p<0.001) with Bonferroni-corrected post-hoc tests indicating the canal tiptrode I/V ratios to be significantly greater than the mastoid electrode ratios.
For the SP amplitudes, again there is no main effect of Test-retest (F[1,28] = 0.02, p>0.05) nor Group (F[1,28] = 0.48, p>0.05). There is a main effect of Montage (F[1,28] = 55.36, p<0.001) and Bonferroni-corrected post-hoc tests confirm that SP amplitudes are greater for the canal tiptrode than the mastoid electrode. There are no significant interactions between factors. For the SP/AP ratios there are no significant interactions and no significant main effects of Test-retest (F[1,28] = 0.73, p>0.05), Montage (F[1,28] = 1.42, p>0.05), nor Group (F[1,28] = 2.88, p>0.05).
3.4.2. Reliability
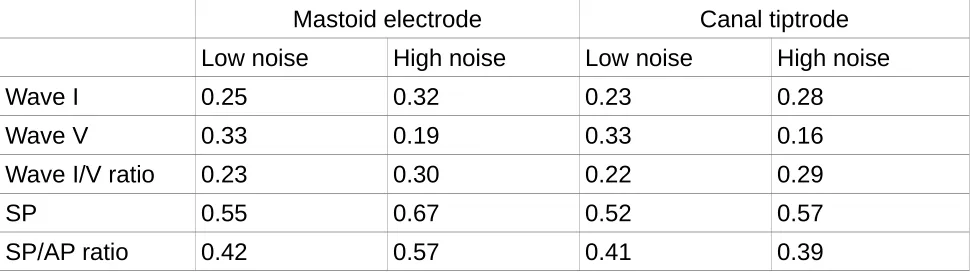
Table 1. CoV values for the two groups of listeners and the two montages for the
393
394
395
396
397
398
399
400
401
402
403
404
405
406
407
408
409
410
411
412
413
414
415
416
417
waves and wave ratios of interest. The value reported is the mean CoV for each of the two sessions calculated independently.
Mastoid electrode Canal tiptrode
Low noise High noise Low noise High noise
Wave I 0.25 0.32 0.23 0.28
Wave V 0.33 0.19 0.33 0.16
Wave I/V ratio 0.23 0.30 0.22 0.29
SP 0.55 0.67 0.52 0.57
[image:17.595.57.542.140.277.2]SP/AP ratio 0.42 0.57 0.41 0.39
Table 1 shows the CoV for the different wave amplitudes and ratios for the two groups and the two sessions. A lower CoV represents less relative dispersion of the data about the mean. The lowest coefficients are seen for wave V for the high noise exposure group. Overall, CoVs for wave I are similar to those for wave V (all <0.35), and much less than those for the SP. The coefficients for the canal tiptrode are slightly smaller than for the mastoid electrode, by 0.02 and 0.04 for the low- and high-noise exposure groups, respectively. For wave V the high-noise exposure group shows less variability than the low-noise exposure group in both montages. The CoVs for the ratio measures and the SP amplitude are comparable across montages, with the means for each montage differing by no more than 0.1 across all three measures (wave I/V ratio, SP, and SP/AP ratio). The high-noise exposure group shows larger wave I/V ratio variability and greater SP and SP/AP ratio variability.
Fig. 6 shows wave I and wave V amplitudes for both montages in scatter plots, with session T2 plotted against session T1. The Spearman correlation coefficient is used as a descriptive summary statistic of this relation. The low- and high-noise exposure groups are
419
420
421
422
423
424
425
426
427
428
429
430
431
432
433
434
435
436
437
438
plotted in different symbols for consistency, but as there are no statistically significant differences between the groups (see section 3.4.1), all correlations and ICCs were computed across all participants. For wave I, the linear correlation between sessions is comparable across the two montages (panels A and B), with a difference of just 0.02. For wave V, the correlation coefficients are 0.04 larger for the mastoid electrode (panel C) than for the canal tiptrode (panel D). The correlation between sessions is as strong for wave I as for wave V. The bottom panel of Fig. 6 shows the wave I/V ratio for session T2 plotted against that of session T1. The correlations for the I/V ratio are larger for the canal tiptrode (panel F) than the mastoid electrode (panel E), and similar to those for the individual waves shown in the upper two panels of Fig. 6.
Fig. 7 shows scatter plots for the SP amplitudes and SP/AP ratios. The correlations between sessions are much weaker for the SP than for the main ABR waves. The
correlation coefficients are larger for the SP in the canal tiptrode montage (panel B) than for the mastoid electrode (panel A). The bottom panel of Fig. 7 shows the SP/AP ratios for session T2 plotted against those for session T1. The correlations for the SP/AP ratio are slightly larger in the canal tiptrode montage (panel D), though both recording locations show much smaller coefficients than the wave I/V ratio.
Table 2. ICC values for five ABR amplitude measures, both between sessions (for both electrode montages) and between montages. Lower and upper 95% confidence intervals are shown in parentheses.
Mastoid electrode Canal tiptrode Between montage Wave I 0.85 (0.71/0.92) 0.88 (0.76/0.94) 0.88 (0.80/0.94) Wave V 0.80 (0.63/0.90) 0.87 (0.75/0.94) 0.90 (0.82/0.95)
440
441
442
443
444
445
446
447
448
449
450
451
452
453
454
455
456
457
458
459
460
461
462
Wave I/V ratio 0.84 (0.70/0.92) 0.89 (0.79/0.95) 0.85 (0.74/0.92) SP 0.18 (-0.18/0.50) 0.40 (0.056/0.66) 0.47 (0.25/0.67) SP/AP ratio 0.32 (-0.039/0.60) 0.46 (0.13/0.70) 0.31 (0.083/0.54)
ICC values are shown in Table 2, together with 95% confidence intervals. The ICCs are largest for waves I, V, and the I/V ratio, and largest for the canal tiptrode montage. These ICC values would generally be described as reflecting excellent repeatability (>0.75; Cicchetti, 1994), both within and between montages. The reliability of wave I across the two test sessions is comparable to that for wave V, with all ICC values greater than 0.80. Wave I amplitudes are larger for the canal tiptrode montage, but it does not appear that this is concordant with a substantial increase in reliability over the mastoid electrode montage. ICC values for wave I and V latency are reported in S4 of Supplementary Materials.
The SP and SP/AP ratio measures show much lower reliability. The SP for the mastoid electrode has poor reliability, and although this is improved by using the SP/AP ratio, it still remains lower than the reliability reported for the other waves. The SP values from the canal tiptrodes are more reliable and these are also improved by using a ratio measure, although, as indicated by the confidence intervals, there is no statistically significant difference between the reliability of the two montages for any of the measured waves or ratios. However, it is clear that any measure utilising the SP is much less reliable than one using waves I and V. The strongest ICC value of the four measures involving the SP (restricted to reliability estimates within a montage) is 0.46. Comparing this ICC value with the weakest ICC from the three measures using waves I and V (0.80) demonstrates that the reliability of measures utilising the SP are significantly poorer than those using waves I and V (z = 2.21; p<0.05).
464
465
466
467
468
469
470
471
472
473
474
475
476
477
478
479
480
481
482
483
484
485
486
4. Discussion
4.1 Reliability of ABR measures
The primary aim of the current study was to quantify the test-retest reliability of ABR measures, to evaluate whether the ABR is a suitable technique for measuring auditory nerve function in individual human listeners. Although it has been reported that the ABR is stable over long time periods in an individual, much of this evidence relates to wave V. The data presented here indicate that wave I test-retest reliability, and therefore measurement error, is comparable to that of the larger amplitude wave V. Therefore, although wave V is often characterised as robust and reliable, and wave I as small and variable (Mehraei et al., 2016), it is clear that wave I has high within-subject reliability in normal-hearing listeners, at least for the stimulus intensity used here. If the other sources of between-subject variability (for example, head size, tissue resistance) can be controlled, wave I amplitude is sufficiently reliable to accurately characterize individual differences in auditory nerve function.
Neither the SP nor SP/AP ratio were reliable. Even when using the canal tiptrode montage, the best-case ICC was 0.46. In the current study these measures clearly have poor test-retest reliability, but this may be because of the small SP amplitudes evoked by an 80 dB nHL (115.5 peSPL) click. The click used by Liberman et al. (2016) to evoke the SP had a level of 94.5 dB nHL(130 peSPL), and produced much larger SP amplitudes. However, it is not clear that raising presentation levels to enhance the SP is advisable. Even an 80 dB nHL stimulus is intolerably loud for some listeners (Gu et al., 2012). A stimulus
presentation level greater than 90 dB nHL (over 120 dB peSPL when presented through ER3A inserts) could risk exceeding recommended daily exposure limits after a few
488
489
490
491
492
493
494
495
496
497
498
499
500
501
502
503
504
505
506
507
508
509
510
511
512
thousand presentations. Moreover, even such exposure limits may be too permissive, since impulse noise is more damaging than continuous-type noise of equivalent energy (Starck et al., 2003). It may also be the case that the SP is inherently unreliable, even if higher stimulus presentation levels are used. Either way, the clinical utility of the SP measure may be limited.
The SP/AP ratio in the current study used an arbitrary baseline to compute the amplitude of both the SP and the AP components, as described by Liberman et al. (2016). It has been reported previously that peak-baseline measures of wave I amplitude (the AP) are less reliable than peak-trough estimates of amplitude (Stelmack et al., 2003). Therefore, measures such as the SP/AP ratio could benefit from using peak-trough estimates of the AP. However, in the current study this made little difference to the reliability of the SP/AP ratio, which suggests that the variability of the SP was the limiting factor.
4.2. Effects of electrode montage
One concern when trying to measure small, supra-threshold changes in the auditory nerve function of normal-hearing listeners is that scalp-mounted mastoid electrodes are simply not sensitive enough to reliably detect the subtle changes in evoked responses. The results presented in this study indicate that moving the recording site closer to the generator of wave I (the auditory nerve), by placing a tiptrode in the ear canal, produced only a small increase in reliability for waves I and V, although the benefit was greater for the SP. The amplitude of wave I increased and that of wave V decreased when using a
514
515
516
517
518
519
520
521
522
523
524
525
526
527
528
529
530
531
532
533
534
535
536
537
538
canal tiptrode relative to a mastoid electrode, as seen in other studies (e.g. Bauch and Olsen, 1990). However, reliability of the wave amplitude did not appear to be directly linked to the absolute amplitude of the wave. Wave V was slightly more reliable in the canal tiptrode montage compared to the mastoid electrode montage, despite having lower amplitudes on average. Given that the use of canal tiptrodes increases the financial burden on ABR practitioners and can reduce participant comfort, it is not clear that such equipment is necessary or advisable for the recording of ABR waves I or V.
4.3. Relation of ABR measures to noise exposure
The final aim of the study was to investigate supra-threshold changes in the ABR in relation to noise exposure. The results presented here, for a group of young females in which low- and high-noise exposed listeners were well-matched for audiometric thresholds and age, indicate no changes in wave I amplitude as a function of noise exposure. There is no evidence for noise-induced cochlear synaptopathy. This is consistent with other recent studies in our laboratory which have found no association between noise exposure and wave I amplitude in young listeners with normal audiograms (Prendergast et al., 2017; Guest et al., 2017). The range of noise exposures in the present study allowed for good separation between the groups, although compared with Prendergast et al. (2017) there were fewer listeners with very high exposures, and more listeners with very low exposures. It should be noted that an absence of any evidence for cochlear synaptopathy is not the same as evidence for absence of the disorder. It remains unclear how sensitive the ABR is to a loss of low-SR fibers, even in animals (Bourien et al., 2014). Shaheen et al, (2015) suggested that the frequency-following response is a more sensitive identifier of cochlear synaptopathy than the ABR. It may yet prove that in humans, a click-evoked response is too crude a measure with which to elucidate subtle supra-threshold, sub-clinical deficits.
540
541
542
543
544
545
546
547
548
549
550
551
552
553
554
555
556
557
558
559
560
561
562
563
564
Liberman et al. (2016) also reported no significant difference in wave I amplitude between low- and high-noise exposed groups of listeners, although they did find a large difference between the groups in the SP/AP ratio. Liberman et al. reported mean SP amplitudes of approximately 0.14 and 0.21 μV, and SP/AP ratios of 0.26 and 0.46, for the low- and high-noise exposure groups, respectively. For the canal tiptrode montage in the present study, the SP amplitudes were 0.07 and 0.08 μV, and the SP/AP ratios were 0.22 and 0.26, for the low- and high-noise exposure groups, respectively. Although the present data show a trend in the direction reported by Liberman et al., the effect did not reach significance. The click intensity used in the current study was 14.5 dB lower than that used by Liberman et al., and therefore it may be that substantial differences between noise-exposure groups are only observed for more intense presentation levels than used here. Alternatively, there were substantial high-frequency audiometric differences between the groups in the
Liberman et al. study, in contrast to the present study in which the groups were closely matched at high frequencies. Hence the populations tested in the two studies may not be directly comparable. One possibility is that high-frequency audiometric loss is a marker for cochlear synaptopathy. For example, only noise exposures that produce high-frequency threshold elevations may have the capacity to cause a substantial loss of cochlear synapses. Another is that SP/AP ratios may be directly influenced by high-frequency sensitivity, in the absence of synaptopathy. It may also be crucial to consider age more carefully, for example, whether the age at which intense noise exposures are experienced is critical, or whether the effects of noise-induced synaptopathy are more easily observed as an accelerated decline in hearing with advancing age.
5. Conclusions
566
567
568
569
570
571
572
573
574
575
576
577
578
579
580
581
582
583
584
585
586
587
588
589
590
For young female listeners with normal hearing, ABR wave I and wave V
amplitudes, and the I/V amplitude ratio, all show excellent test-retest reliability, with over 80% of the variability in measurement accounted for by between-subject differences in ABR response.
The SP amplitude and SP/AP ratio show poor levels of reliability for the 80 dB nHL
click intensity used here.
Use of a canal tiptrode may result in slightly improved reliability, although a mastoid
electrode is still highly reliable for waves I and V.
No significant differences were found in any ABR measure between low- and
high-noise exposure groups.
Acknowledgments
This work was supported by the Medical Research Council, UK (MR/L003589/1). Author H.G. was supported by an Action on Hearing Loss studentship funded by the Marston Family Foundation. Author S.C. was supported by the Colt Foundation. We thank the Associate Editor and two anonymous reviewers for constructive comments on earlier drafts of this manuscript.
Figure Captions
Fig. 1. Pure tone air conduction audiometric thresholds. Thresholds are shown for the test ear, with 95% confidence intervals, for the two groups of listeners. N = 15 in each group.
Fig. 2. Distortion product otoacoustic emissions. DPOAEs from a single session (T1) for
592
593
594
595
596
597
598
599
600
601
602
603
604
605
606
607
608
609
610
611
612
613
614
615
616
the test ear are shown, with 95% confidence intervals, for the two groups of listeners.
Fig. 3. Grand average ABR waveforms in response to a 80 dB nHL click. Waveforms are shown for each group of listeners and for the mastoid electrode and canal tiptrode. 95% confidence intervals are indicated by the shaded areas.
Fig. 4. Mean peak-to-trough amplitudes for wave I and wave V, and mean wave I/V ratios. Each test session is plotted individually for the two montages and the two groups. Error bars show 95% confidence intervals.
Fig. 5. Mean peak-to-baseline amplitudes for the SP and the SP/AP ratio. Each session is plotted individually for the two montages and the two groups. Error bars show 95%
confidence intervals.
Fig. 6. Test-retest reliability of waves I and V, and I/V ratio. Amplitudes and ratios for the second test session (T2) are plotted against those for the first test session (T1). The data for the mastoid electrode and canal tiptrode are plotted in the left- and right-hand column respectively. Spearman correlation coefficients are reported as a summary statistic. Low-noise exposed listeners are shown in open green circles and high-Low-noise exposed listeners in filled grey circles. The diagonal line represents the ideal relation across both test
sessions.
Fig. 7. Test-retest reliability of the SP and SP/AP ratio. Amplitudes and ratios for the second test session (T2) are plotted against those for the first test session (T1). The data for the mastoid electrode and canal tiptrode are plotted in the left- and right-hand column respectively. Spearman correlation coefficients are reported as a summary statistic.
Low-618
619
620
621
622
623
624
625
626
627
628
629
630
631
632
633
634
635
636
637
638
639
640
641
642
noise exposed listeners are shown in open green circles and high-noise exposed listeners in filled grey circles. The diagonal lines represent the ideal relation (perfect reproducibility) between test sessions.
644
645
646
References
Bauch, C.D., Olsen, W.O., 1990. Comparison of ABR amplitudes with TIPtrode and mastoid electrodes. Ear Hear. 11, 463-467.
Bidelman, G.M., Pousson, M., Dugas, C., Fehrenbach, A., 2017. Test–Retest reliability of dual-recorded brainstem versus cortical auditory-evoked potentials to speech. J. Am. Acad. Audiol. In press.
Bourien, J., Tang, Y., Batrel, C., Huet, A., Lenoir, M., Ladrech, S., Desmadryl, G., Nouvian, R., Puel, J.L., Wang, J., 2014. Contribution of auditory nerve fibers to compound action potential of the auditory nerve. J. Neurophysiol. 112, 1025-1039.
Bramhall, N.F., Konrad-Martin, D., McMillan, G.P., Griest, S.E., 2017. Auditory brainstem response altered in humans with noise exposure despite normal hair cell function. Ear Hear. 38, e1-e12.
British Society of Audiology, 2011. Pure-tone air-conduction and bone-conduction
threshold audiometry with and without masking. Recommended procedure (British Society of Audiology, Reading, UK), 32.
Cicchetti, D.V., 1994. Guidelines, criteria, and rules of thumb for evaluating normed and standardized assessment instruments in psychology. Psychological Assessment. 6, 284-290.
Edwards, R.M., Buchwald, J.S., Tanguay, P.E., Schwafel, J.A., 1982. Sources of variability
648
649
650
651
652
653
654
655
656
657
658
659
660
661
662
663
664
665
666
667
668
669
670
671
672
in auditory brain stem evoked potential measures over time. Electroencephalogr. Clin. Neurophysiol. 53, 125-132.
Fullbright, A.N.C., Le Prell, C.G., Griffiths, S.K., Lobarinas, E., 2017. Effects of recreational noise on threshold and suprathreshold measures of auditory function. Semin. Hear. 38, 298-318.
Gorga, M.P., Neely, S.T., Bergman, B., Beauchaine, K.L., Kaminski, J.R., Peters, J., Jesteadt, W., 1993. Otoacoustic emissions from nornal-hearing and
hearing-impaired subjects: distortion product responses. J. Acoust. Soc. Am. 93, 2050-2060.
Gorga, M.P., Neely, S.T., Ohlrich, B., Hoover, B., Redner, J, Peters, J., 1997. From
laboratory to clinic: a large scale study of distortion product otoacoustic emissions in ears with nornal hearing and ears with hearing loss. Ear Hear. 18, 440-455.
Grinn, S.K., Wiseman, K.B., Baker, J.A., Le Prell, C.G., 2017. Hidden hearing loss? No effect of common recreational noise exposure on cochlear nerve response amplitude in humans. Font. Neurosci. 11: 465.
Grose, J.H., Buss, E., Hall III, J.W., 2017. Loud music exposure and cochlear
synaptopathy in young adults: Isolated auditory brainstem response effects but no perceptual consequences. Tends in Hearing. 21, 1-18.
Gu, J.W., Herrmann, B.S., Levine, R.A., Melcher, J.R., 2012. Brainstem auditory evoked potentials suggest a role for the ventral cochlear nucleus in tinnitus. J. Assoc. Res. Otolaryngol. 13, 819-833.
674
675
676
677
678
679
680
681
682
683
684
685
686
687
688
689
690
691
692
693
694
695
696
697
698
Guest, H., Munro, K.J., Prendergast, G., Howe, S., Plack, C.J., 2017. Tinnitus with a normal audiogram: Relation to noise exposure but no evidence for cochlear synaptopathy. Hear. Res. 344, 265-274.
Hall, J. W. (1992). Handbook of auditory evoked responses. Boston: Allyn and Bacon.
Issa, A., Ross, H.F., 1995. An improved procedure for assessing ABR latency in young subjects based on a new normative data set. Int. J. Pediatr. Otorhinolaryngol. 32, 35-47.
Keefe, D.H., Bulen, J.C., Arehart, K.H., Burns, E.M., 1993. Ear-canal impedance and reflection coefficient in human infants and adults. J. Acoust. Soc. Am. 94, 2617-2638.
Kim, H.-Y. (2013). Statistical notes for clinical researchers: Evaluation of measurement error 1: using intraclass correlation coefficients. Restorative Dentistry &
Endodontics, 38, 98–102.
Kujawa, S.G., Liberman, M.C., 2009. Adding insult to injury: cochlear nerve degeneration after "temporary" noise-induced hearing loss. J. Neurosci. 29, 14077-14085.
Lauter, J.L., Loomis, R.L., 1986. Individual differences in auditory electric responses: Comparisons of between-subject and within-subject variability I. Absolute latencies of brainstem vertex-positive peaks. Scand. Audiol. 15, 167-172.
Lauter, J.L., Loomis, R.L., 1986. Individual differences in auditory electric responses:
700
701
702
703
704
705
706
707
708
709
710
711
712
713
714
715
716
717
718
719
720
721
722
723
724
Comparisons of between-subject and within-subject variability II. Amplitude of brainstem vertex-positive peaks. Scand. Audiol. 17, 87-92.
Liberman, M.C., Epstein, M.J., Cleveland, S.S., Wang, H., Maison, S.F., 2016. Toward a differential diagnosis of hidden hearing loss in humans. PLoS ONE, 19, e0162726.
Lutman, M.E., Davis, A.C., Ferguson, M.A., 2008. Epidemiological evidence for the effectiveness of the noise at work regulations. Health and Safety Executive. Research Report RR669.
Mcgraw, K., Wong, S.P., 1996. Forming inferences about some intraclass correlation coefficients. Psychological Methods. 1. 30-46.
Mehraei, G., Hickox, A.E., Bharadwaj, H.M., Goldberg, H., Verhulst, S., Liberman, M.C., Shinn-Cunningham, B.G., 2016. Auditory Brainstem Response Latency in Noise as a Marker of Cochlear Synaptopathy. J. Neurosci. 36, 3755–3764.
Munjal, S., Panda, N., Pathak, A., 2016). Long Term Test-Retest Reliability of Auditory Brainstem Response (ABR) and Middle Latency Response (MLR). Glob. J. Oto. 1, 555559.
Prendergast, G., Guest, H., Munro, K.J., Kluk, K., Leger, A., Hall, D.A., Heinz, M.G., Plack, C.J., 2017. Effects of noise exposure on young adults with normal audiograms I: Electrophysiology. Hear. Res. 344, 68-81.
R Core Team . R Foundation for Statistical Computing; Vienna, Austria: 2015. R: a
726
727
728
729
730
731
732
733
734
735
736
737
738
739
740
741
742
743
744
745
746
747
748
749
750
Language and Environment for Statistical Computing.
Richmond, S.A., Kopun, J.G., Neely, S.T., Tan, H., Gorga, M.P., 2011. Distribution of standing-wave errors in real-ear sound-level measurements. J. Acoust. Soc. Am. 129, 3134-3140.
Santos, M., Marques, C., Nobrega Pinto, A., Fernandes, R., Coutinho, M.B., Almeida E Sousa, C., 2017. Autism spectrum disorders and the amplitude of auditory brainstem response wave I. Autism Research. 10, 1300-1305.
Schaette, R., McAlpine, D., 2011. Tinnitus with a normal audiogram: physiological
evidence for hidden hearing loss and computational model. J. Neurosci. 31, 13452-13457.
Shaheen, L.A., Valero, M.D., Liberman, M.C., 2015. Towards a diagnosis of cochlear neuropathy with envelope following responses. J. Assoc. Res. Otolaryngol. 16, 727-745.
Shrout, P.E., Fleiss, J.L., 1979. Intraclass correlations: uses in assessing rater reliability. Psychol. Bull. 86, 420-428.
Spankovich, C., Griffiths, S.K., Lobarinas, E., Morgenstein, K.E., de la Calle, S., Ledon, V., Guerico, D., Le Prell, C.G., 2017. Temporary threshold shift after impulse-noise during video game play: laboratory data. Int. J. Audiol. S53-65.
Starck, J., Toppila, E., Pyykko, I., 2003. Impulse noise and risk criteria. Noise and Health
752
753
754
755
756
757
758
759
760
761
762
763
764
765
766
767
768
769
770
771
772
773
774
775
776
5, 63-73.
Stelmack, R.M., Knott, V., Beauchamp, C.M., 2003. Intelligence and neural transmission time: a brain stem auditory evoked potentials analysis. Personality and Individual Differences. 34, 97-107.
Zaki, R., Bulgiba, A., Nordin, N., & Azina Ismail, N., 2013. A systematic review of statistical methods used to test for reliability of medical instruments measuring continuous variables. Iranian Journal of Basic Medical Sciences, 16, 803–807.
778
779
780
781
782
783
784
785