RF Surface Resistance Study of Non-Evaporable Getter Coatings
Oleg B. Malyshev1,2,*, Lewis Gurran1,2,3, Philippe Goudket1,2, Kiril Marinov1,2, Stuart Wilde1,4, Reza Valizadeh1,2 and Graeme Burt2,3
1
ASTeC, STFC Daresbury Laboratory, Daresbury, Warrington, WA4 4AD Cheshire, UK
*e-mail address: oleg.malyshev@stfc.ac.uk
2
Cockcroft Institute, Daresbury, Warrington, WA4 4AD Cheshire, UK
3
Engineering, Lancaster University, Cockcroft Institute, Lancaster, UK
4
Loughborough University, Loughborough, UK
Abstract
In many particle accelerators the beam parameters could be affected by the beam pipe wakefield
impedance. It is vital to understand how the wakefield impedance might vary due to various
coatings on the surface of the vacuum chamber, and this can be derived from surface resistance
measurements. The bulk conductivity of two types of NEG films (dense and columnar) is
determined. This is achieved by measuring the surface resistance of NEG-coated samples using
an RF test cavity and fitting the experimental data to a standard theoretical model. The
conductivity values obtained are then used to compare resistive wall wakefield effects in beam
pipes coated with either of the two types of film.
Keywords: surface resistance, wakefield impedance, NEG coating, PVD
1.
INTRODUCTION
A beam vacuum chamber interacts with the beam in many ways: among these is wakefield
generation. In general, the wakefield impedance of a chamber depends on the material used, its
surface characteristics and the chamber geometry [1,2]
A Non-Evaporable Getter (NEG) coating invented in the 1990s at CERN [3,4] provides
the best vacuum solution for many accelerators such as LHC [5], Soleil [6] and MAX-IV [7] or
key components in others such as undulator vacuum chambers in ESRF [8], DLS [9], ELETTRA
[10] and many others. However, its impact upon wakefield generation in the beam vacuum
chamber needs to be understood.
The aims of this work were:
Verification of the surface resistance (RS) measurement method with known materials
such as Cu, Al and Nb.
A comparison of the surface resistance of a series of NEG films with columnar or dense
structures, deposited on Cu or Si substrates at a range of thicknesses.
Then, if possible, calculating bulk conductivity values for these two types of coatings.
Finally, using these results to calculate the wakefield impedance. This could later be used
to determine the impact of the wakefield effects on a beam.
2.
Method
In this work, a RF cavity where the sample constitutes one of the walls is used to measure the
surface resistance of the electrically conductive samples via measurement of the cavity quality
factor Q0.
The cavity geometry developed for these measurements, shown in Fig. 1, consists of two
parts which are the body of the cavity and a planar sample, separated by an air gap. This presents
the advantage of not requiring any contact between the sample and the cavity which makes
changing the sample much simpler and removes an uncertainty with respect to the RF contact
between two parts. However, in order to keep the RF power within the cavity the cavity body has
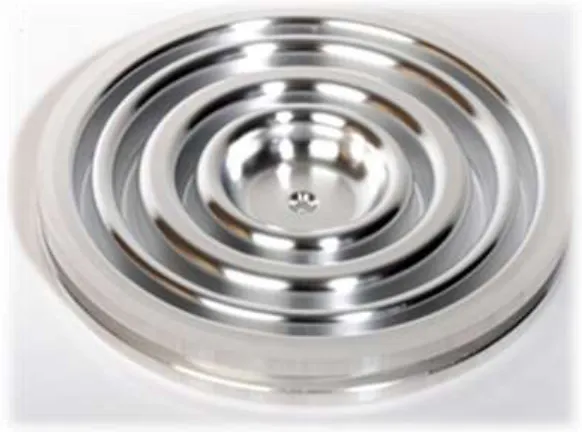
FIG. 1. A schematic of the triple choke RF cavity above a sample.
The field pattern in the cavity has been modelled via electromagnetic simulations using CST
Microwave Studio [11]. The use of a double-choked pillbox-type cavity, for surface resistance
measurements was described in [12]. A new three-choked cavity designed for improved leakage
mitigation was used for this work and can be seen in Fig. 2. The cavity was manufactured from
aluminium by Niowave Inc. (NIOWAVE Inc., 1012 N Walnut St, Lansing, MI 48906). This 7.8
GHz cavity allows the testing of 100-mm diameter samples separated from the cavity body by
1-3 mm.
[image:3.612.160.451.452.668.2]2.1.
Calculation of surface resistance from first principles
When an alternating magnetic field is applied to a conducting surface a surface current is
induced which falls off exponentially over the characteristic ‘skin depth’ of the conducting
material [13]. This current will absorb a time-averaged power from the AC field as
2
1
; 2 S
P
R H dS (1)where H is the applied magnetic field strength and RS is the surface resistance. For a perfectly smooth, normally conducting material RS can be given as
0;
S
f
R
(2)
where f is the AC frequency and σ is the bulk conductivity of the conductor. Eq. (2) is derived
with the assumption that the displacement current term in Ampere’s law is negligible compared
to the conduction current term. This is valid at relatively low frequencies and in good conductors.
The leading-order relative error associated with Eq. (2) is 0/(2) , where = 2 f and 0 is the vacuum permittivity. Thus, this error is negligible in copper at 7.8 GHz, but in a lower
conductivity material e.g. ~ 104 S/m and at higher frequencies f ~ 10 THz the relative deviation is 0/(2) ~ 3%. For a RF cavity the unloaded quality factor, Q0, is defined as follows:
0 0 ; U Q P
(3)
where U is the stored energy in the cavity volume and 0 = 2 f0is the resonant frequency of the cavity. This Q-factor is independent of field amplitude. Where radiative losses from the chokes
are small, it can be easily measured experimentally with a method described later. The
time-averaged stored energy can also be calculated from the magnetic field strength as
2 0
. 2
U
H dV (4)The material-dependent part of Q0 and RS can be separated from the field-dependent part by defining a geometry factor, G:
Since the cavity is made from two separate parts (the choked test cavity and the planar sample)
which could be made of different materials the power loss can be split into two terms, one for
each part: 2 2 1 1 2 2 sam cav S S sample cavity
P
R H dS
R H dS (6)Assuming that the sample and test cavity each have a uniform surface resistance, RSsam and RScav respectively, this allows the Q0 factor to be expressed as
2 0 0
0 sam 2 cav 2 .
S S
sample cavity
dV Q
R dS R dS
H H H (7)The ‘sample ratio’, ps, and the ‘cavity ratio’ pc, are introduced to simplify the equations. They are the fraction of the total integral of |𝑯|2 that is integrated over the sample and test cavity surfaces,
respectively:
2
2 2 ; 1 .
sample
s c s
sample cavity
dS
p p p
dS dS
HH H (8)
Eq. (7) can therefore be simplified and rearranged for RSsam as: 1
0
cav
sam S c
S
s
G Q R p
R
p
(9)
The magnetic field distribution in the cavity was calculated using CST Microwave Studio. For
our cavity, G is calculated to be 235 . Additionally, the software calculates the field ratios ps and pc, for a case using perfect electric conductor (PEC) boundary conditions, to be pc = 0.625 and ps = 0.375.
Hence, for known test cavity surface resistances RScav (from the study carried out in [12]) and measured Q0, the surface resistance of the sample can be calculated.
2.2.
Calculation of surface resistance from first principles
The Q0 represents the Ohmic heating in the cavity walls. However, the cavity requires an RF coupler in order to feed power in and out of the cavity. The coupler will also have its own quality
0 , E E U Q P
(10)
where PE is the power that travels back up the coupler when connected to a perfectly matched load. Any RF leakage through the chokes would add an additional non-Ohmic loss to the cavity
which would appear as a radiation resistance in parallel with the cavity shunt impedance, and has
an associated quality factor, QG. This gives the cavity and coupler a combined, or loaded, quality factor, QL of
0
1 1 1 1
.
L E G
Q Q Q Q (11)
The loaded quality factor is inversely proportional to the half-power bandwidth Δf of the cavity
resonance such that
0 . L f Q f
(12)
Hence, the loaded Q-factor can easily be measured with a Vector Network Analyser (VNA, here
an Agilent E5072) by measuring the resonant frequency (where the reflected power is at a
minimum) and half-power points (where, with the cavity in the detuned open position, the
imaginary component of the reflected voltage ratio S11 is at a local maximum or minimum. In order to measure the Ohmic Q0 we must consider the minimum reflected power. With a forward power travelling into the cavity, initially when the cavity is empty almost all power is
reflected back along the input cable from the coupler-cavity boundary. However, as the cavity
field starts to build up, some of the power in the cavity is coupled to the input coupler creating a
backwards wave which is 180 out of phase with the reflected wave. This cancels out some of
the reflected wave, hence the coupling parameter is defined as
1 1
1 1 1 1
0
;
E E
L E G
Q Q
Q Q Q Q
(13)
and can be measured using the reflection coefficient S11: the minimum value, S11min , at the
resonant frequency and the maximum value, S11max, just off band. When the probe is overcoupled,
as for our measurements,
max min 11 11 max min 11 11 S S S S
Therefore Eq. (11) can be rewritten as
1 1 1
0
1
L G
Q
Q Q . (15)QG and Q0 cannot be separated by measurement of QL – in the equivalent circuit model of the cavity, they both contribute to the resistance. Q0 can only be calculated with eq. (15) when QG>>
Q0 or if QG is defined by other means as described in Section 3.1.
2.3.
Calculation of cavity surface resistance
The quality factor Q0 can be determined for any combination of cavity and sample materials using Eq. (15). This can then be inserted into Eq. (9) where the sample surface resistance is a
function of unknown cavity surface resistance. While the conductivity of pure metals is normally
well known, the surface resistance is also affected by surface contaminants, impurities and
surface roughness. As a result, the surface resistance of the cavity and a sample plate of the same
material can be different. Therefore for N studied samples there are N+1 unknown values of
surface resistance in a system of N equations; this system of equations can’t be solved. However,
by using a second cavity with a different RS one can have 2N equations for N+2 unknown surface resistances; this system of equations can have a solution. In these measurements two identical
cavities were used, one made of aluminium and the other of niobium. Different samples, made of
aluminium, niobium and 304L stainless steel (SS) as well as three copper samples (bulk plate
and two PVD-deposited films to give a range of surface roughness) were used. This gave us 12
different combinations and hence 12 independent Q0 measurements. The 12 Q0 measurements were inserted into Eq. (9) giving a system of 12 linear equations with eight unknowns, the
surface resistances of each cavity and sample plate.
In practice, measurement errors in Q0 mean that no single solution satisfies every equation. A best fit was then made to the data giving values for each of the surface resistances, including that
of the cavity. The measurements were also repeated multiple times to improve the confidence in
2.4.
Analytical models
In this section, the equations modelling the surface resistance of the structures under
investigation are discussed. The expressions for the surface impedance of a planar metallic film
deposited on a substrate (dielectric or metallic) are straightforward to derive by following the
standard approach employed in calculating the transmission and reflection coefficients in layered
media [14]. These equations are also known from transmission line theory [15]. An alternative
derivation relying on equivalent circuits can be found in [16].
The analysis begins by considering a NEG film of thickness d1 deposited on a copper substrate much thicker than the skin depth in copper at the operating frequency f = /2 = 7.8
GHz. A layer of lossless magneto-dielectric of thickness d2 (e.g. an oxide layer) is sandwiched between the NEG film and the copper substrate. By applying transmission line theory it can be
shown that the surface impedance of this multi-layer structure is given by
1 23
1 23
1 1
1
1 23 1 23 1 1
exp 2 ; exp 2
S
Z Z Z Z ik d
Z Z
Z Z Z Z ik d
(16)
where the NEG film is described by its characteristic surface impedance Z1 0 2 1
1i ,wavenumber k1 0 1 2 1
i
and bulk conductivity 1. The quantity Z23 is the effective surface impedance of the structure underneath the NEG layer, consisting of themagneto-dielectric layer of thickness d2 on top of the copper substrate. Z23 is given by
2 3
2 3
2
23 2
2 3 2 3 2
2
2 exp 2
; exp 2
Z Z Z Z ik d
Z Z
Z Z Z Z ik d
(17)
where Z2 0
0
is the wave impedance of the oxide layer, () and () are itspermittivity and permeability, respectively, at the operating frequency,k2 c is the oxide
layer wavenumber and Z3 0 2 3
1i is the characteristic surface impedance of copper (3 = 5.9 × 10⁷ S/m is the bulk conductivity of copper).As in Eq. (2) the expressions for the wavenumber and the characteristic impedance of
NEG and copper in Eqs. (16) and (17) rely on the assumption that the displacement current in
Ampere’s law is negligible in comparison with the conduction current in the NEG layer. Hence,
It can be easily shown that the following two conditions are simultaneously met:
2
2 1
k d and Z3 Z2, or, equivalently,
2
c d
and
Z3 Z0, whereZ0 is the characteristic impedance of free space. Indeed, assuming that d2 ~ 1 m the above requirements reduce to 6.1 10 3 and 8.6 1 05. Therefore, Eq. (17)
can be replaced with its Taylor series expansion and only the leading-order correction term is
kept as follows:
0 2
23 3 ( ) .
Z Z i d (18)
It shows that the contribution of a thin, lossless magneto-dielectric layer to the surface
impedance of a metallic substrate is purely reactive and it does not depend on the permittivity of
the dielectric layer, but only on its permeability. However, if such a lossless
magneto-dielectric layer is sandwiched between two metals the surface resistance of the structure depends
on the properties of the buffer layer such as thickness and magnetic permeability. The results
presented in Fig. 3 have been obtained with NEG conductivity value of 𝜎1 = 106 S/m as reported in Ref. [17]. Fig. 3 shows the surface resistance of such a sandwich structure. As can be seen,
increasing either the thickness or the magnetic permeability of the buffer layer increases the
surface resistance of the structure. Interestingly, if the permeability of the layer is negative ( <
0) the surface resistance of the three-layer sandwich metal/buffer/metal (MBM) structure is
actually lower than that of the of a metal-metal (MM) structure, in the absence of any layer. Note
that lowering of the surface resistance of a MM structure by introducing a buffer layer with <
0 is still possible, even in the presence of appreciable losses
Re Im
in the buffer layer.The effect of losses in the buffer layer is to reduce the range of film thickness values over which
FIG. 3. Surface resistance of a NEG-oxide layer-copper structure vs. the NEG film thickness for several different permeability values of the oxide layer.
Whilst no negative permeability materials exist in nature, metamaterials research (see e.g.
[ 18 ] and the references therein) has already demonstrated man-made materials exhibiting
negative permeability in various frequency bands. This was first achieved at frequencies of the
order of few GHz, but later studies demonstrated negative permeability in both the THz and the
optical ranges of frequencies [19].
It should be noted that the possibility of using metamaterial coatings for resistive
wakefield impedance reduction in a beam pipe has been reported earlier [20]. However, the
physics behind the idea described in [20] is quite different from what has been discussed here.
More details will be given elsewhere.
In the structures produced for this study the oxide layer is a few nanometres thick, hence
for the purpose of the following analysis the dielectric layer can be excluded from the
considerations therefore Z23 = Z3. Substituting this into Eq. (16) and taking the real part yields:
2
1 1 1 1 1 1
1 2
1 1 1 1 1 1
1 exp 4 2 sin 2 exp 2 ; 1 exp 4 2 cos 2 exp 2
S
d d d
R R
d d d
where RS = Re(ZS) is the surface resistance of the structure under investigation, 1 = Re(k1) is the inverse skin depth in the NEG film and
R1R3
R1R3
is the surface resistancemismatch with R1 = Re(Z1) and R3 = Re(Z3).
This formalism can now be applied to a NEG film deposited on a silicon substrate, which
is in turn backed-up by free space. The surface impedance of this structure is given by Eqs. (16)
and (17). In the latter case k2 Si c, Z2 0
0 Si
and d2 = 600 m are the wavenumber, the wave impedance and the thickness of the silicon substrate, respectively; Si = 11.65 is the permittivity of silicon [21] and Z3 = Z0. It can be shown that 2 0 23 2 02
Z Z Z d Z for all values of
d2 and, hence, Z1 Z23 since Si Z0 Z1. Eq. (16) can be rewritten as follows:
1 1 1 23 1 1
1
1 1 1 23 1 1
1 exp 2 1 exp 2 . 1 exp 2 1 exp 2
S
Z ik d Z ik d
Z Z
Z ik d Z ik d
(20)
It is easy to see that the terms proportional to Z1 in Eq. (20) are small in magnitude compared to those proportional to Z23 , and hence, the former terms can be neglected altogether provided that the NEG layer is sufficiently thick, i.e. d1 >> d0 where
1
0 23 1 4 nm
d Z . The value of d0 is calculated at 𝜎1 = 106 S/m, d2 = 600 m and Si = 11.65. In the latter case Eq. (20) can be simplified to
1 1
1
1 1 1 exp 2
. 1 exp 2
S ik d Z Z ik d
(21)
Note that under these assumptions (Si Z0 Z1 and d1 >> d0) the surface impedance of the structure does not depend on the thickness and the permittivity of the dielectric substrate.
Finally, taking the real part of Eq. (21) yields
1 1
1 1
1 1
1
1 1 1 1 1 1
1 exp 4 2sin 2 exp 2
.
1 exp 4 2 cos 2 exp 2
S
d d d
R R
d d d
FIG. 4 Comparison between the predictions of Eq. (19) (“Exact”, 𝜎1 = 106 S/m, d2 = 600 m, Si = 11.65) and Eq.
(22) (“Approximate”, 𝜎1=106 S/m).
The surface resistance RS = Re(ZS) of a NEG-Si structure has been calculated using both “Exact” Eq. (19) and “Approximate” Eq. (22) (see Fig. 4). The difference between the two
models becomes insignificant for NEG films of thickness d1 50 nm. In the region of NEG film thickness values relevant to our experiment the difference between the two models is less than a
percent and this is considerably smaller than the experimental error.
Eqs. (19) and (22) form the basis for our subsequent analysis.
3. MEASUREMENT RESULTS AND DISCUSSION
3.1.
Materials used for accelerator vacuum chambers
The materials most commonly used for accelerator vacuum chambers are copper, aluminium and
stainless steel. A verification of the method described above has been performed by comparing
calculated and measured values of RS where RS has been calculated from the bulk conductivity of these materials taken from the literature [22,23] and the measured surface roughness using the
following formula from Ref. [24]:
2
2
1 arctan 0.7 ;
2
s Q
R R
where is the magnetic permeability, is the bulk electric conductivity and RQ is the r.m.s. surface roughness. The results obtained with the three-choked cavity assuming QG >> Q0 are found to be in good agreement with calculated ones, see Table I. The values for the bulk metals
[image:13.612.77.534.193.329.2]agree within 11%.
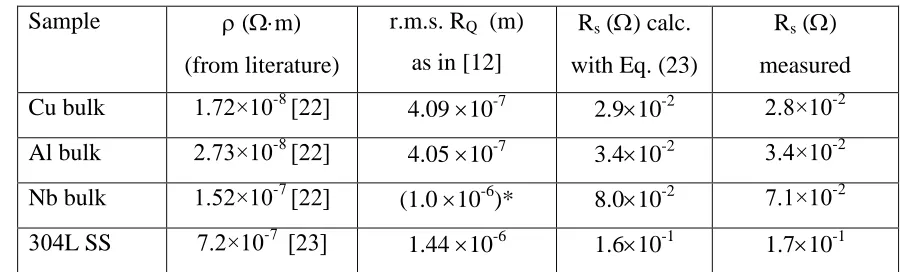
Table I. Calculated values of RS at frequency f = 7.8 GHz.
Sample (m)
(from literature)
r.m.s. RQ (m) as in [12]
Rs () calc. with Eq. (23)
Rs () measured
Cu bulk 1.72×10⁻⁸ [22] 4.09 10-7 2.910-2 2.8×10⁻² Al bulk 2.73×10⁻⁸ [22] 4.05 10-7 3.410-2 3.4×10⁻² Nb bulk 1.52×10⁻⁷ [22] (1.0 10-6)* 8.010-2 7.1×10⁻² 304L SS 7.2×10⁻⁷ [23]
1.44 10-6 1.610-1 1.710-1 * this figure is based on the manufacturer’s specification of roughness rather than direct
measurement.
3.2 NEG coating on copper and silicon
The benefit of using NEG coating on accelerator vacuum chambers is its improvement of the
vacuum environment: it creates a barrier to gas diffusion from/through the vacuum chamber
walls and, after activation by heating above a certain temperature for 24 hours, it provides evenly
distributed pumping speed for H2, CO, CO2 and H2O [25,26,27,28]. Different deposition parameters will vary the structure and morphology of NEG films deposited from the same ‘target’
(initial source of film material). Two types of Ti-Zr-Hf-V NEG film were deposited for this
study: dense and columnar [29,30]. The columnar film has better pumping properties while the
dense film provides a better diffusion barrier, and hence lower photon- and electron-stimulated
desorption.
In this study both types of NEG film were deposited on polycrystalline copper and silicon
Si(100) substrates. The substrate size was 100 mm 100 mm 2 mm. Each substrate was
prepared by cleaning in ultrasonic baths of acetone, then isopropanol and finally rinsed in
de-ionised water. Deposition chamber base pressure was approximately 10-8 mbar. All samples were deposited using an alloy target of Ti-Zr-Hf-V with equal atomic percent at an average magnetron
throughout the deposition to ensure 95% thickness uniformity (as measured during a calibration
of the system). Dense films were deposited using High Power Impulse Magnetron Sputtering
(HiPIMS) with power supply settings of 2 kHz repetition rate and a pulse width of 50 μs.
Columnar films were deposited using a DC power supply with no substrate heating or bias. The
[image:14.612.165.449.211.347.2]deposition parameters are summarised in Table II.
Table II. NEG coating deposition parameters.
Sample Dense Columnar
Method HiPIMS DC
Power 300 W 300 W
P(Kr) 5.3 mbar 40 mbar
Substrate temperature 200 C RT
Substrate bias -50 V 0 V
Both types of NEG film were deposited on copper and silicon substrates, and in each case with
four different thicknesses, i.e. 16 samples were deposited in total. The thickness of the films was
controlled by the duration of deposition, td = 1, 2, 6, 18 hours, and later determined accurately using a focused ion beam (FIB) cross-sectioning. High resolution planar and X-sectional views
of scanning electron microscope (SEM) micrographs of dense and columnar NEG films are
shown in Fig. 5. The X-sectional thickness measurement is taken at a 45 tilt angle which means
the scaled value should be divided by 2. The results are presented in Table III.
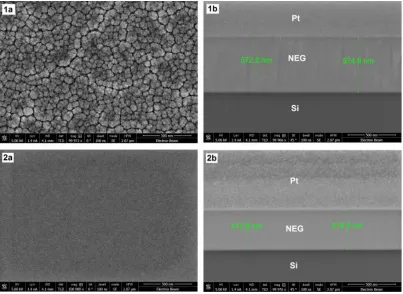
FIG. 5. The high resolution (a) planar and (b) FIB prepared X-section SEM images of columnar (1a and 1b) and dense (2a and 2b) NEG films.
FIG. 6. The surface resistance RS of dense and columnar NEG coatings on copper and silicon substrates as a
function of film thickness calculated (a) from the cavity quality factor Q0 at 7.8 GHz. and (b) the corresponding fit
3.3 RS measurements of NEG coating on copper and silicon
The results of Q0 measurements at 7.8 GHz and RS calculated with Eq. (9) are shown in Table III and Fig. 6. The measurements were performed at room temperature in air using a VNA operated
in single-probe mode. The measurements were all performed within a short space of time to
minimise the effect of temperature and humidity fluctuations. The coupler consisted of a straight
probe made of RG402 semi-rigid coaxial cable. The input probe was inserted through the central
hole of the cavity (see Fig. 2). The cables were calibrated up to the SMA connectors in the
probes. The input probe insertion depth was varied until the cavity was slightly overcoupled but
very close to critical coupling (𝑆11𝑚𝑖𝑛 < 40 dB). A set of viton spacers (2.55-mm thick, the same
gap as simulated) was used to separate the test cavity and the sample each time.
One can see that both dense and columnar NEG coatings with thickness d1 < 1 m negligibly affect the copper substrates’ surface resistance of RS = 2.810
-2
, however the
surface resistance increases with larger thicknesses: for d1 > 1 m for dense and d1 > 4 m for columnar NEG film.
The uncoated silicon sample did not produce a measureable resonance with the test cavity,
because the RF field was transmitted through the silicon and dissipated. The NEG films on
silicon did allow measurements, albeit with caveats as discussed later. The calculated surface
resistance of the thin film with thickness d1 < 1 m is approximately in the 12 range. For the columnar film on Si the measured surface resistance does not measurably change with NEG film
thickness over the tested range suggesting that the skin depth was significantly greater than the
film thickness. For dense film however the surface resistance decreases with NEG thickness,
becoming identical to NEG on copper for d1 > 14 m which means that this thickness of dense NEG film is sufficiently large relative to the skin depth to fully absorb the RF power. The results indicate that none of the columnar films produced for this study had a thickness greater than their skin depths.
3.4 Measurement errors
Q0 was found to be higher for thicker NEG films and the resulting RSsam is shown for each film in Table III.
Table III. RS measurements at 7.8 GHz.
Sample td (h)
NEG thickness (m)
Q0 RSsam ()
RSsam ()
Cu 0 0 5400 2.810-2 810-3
NEG on Cu Columnar
film
1 0.93 5400 3.010-2 810-3
2 1.80 5400 3.010-2 810-3
6 6.03 5219 3.410-2 810-3
18 24.47 2053 0.22 1.410-2
Dense film 1 0.76 5401 3.010-2 810-3
2 1.45 5220 3.410-2 810-3
6 4.77 3284 0.11 1.010-2
18 14.47 1899 0.24 1.610-2
NEG on Si Columnar
film
1 0.69 316 1.90 910-2
2 1.46 319 1.88 910-2
6 5.30 304 1.97 910-2
18 24.92 313 1.92 910-2
Dense film 1 0.50 475 1.23 610-2
2 1.02 610 0.94 510-2
6 4.16 1419 0.36 2.110-2
18 18.56 1939 0.24 1.510-2
The calculations performed with Eq. (9) so far assume that the losses on the sample are
all Ohmic; however this may not necessarily be the case for the films deposited on silicon. If a
film is not thick enough to be effectively opaque to RF (i.e. many skin depths thick) it will still
carry alternating induced currents at the interface with its substrate. A sufficiently thick metallic
substrate will simply dissipate all power not dissipated by the film. In the case of a thin NEG
Thus the RS calculated with Eq. (9) for a thin NEG film deposited on a silicon substrate is a lower boundary of the true value of RS for these samples.
An upper bound of RF leakage through the chokes QG was found by simulating the
structure in CST with a tapered absorber placed around the cavity boundary to simulate a
matched radiation boundary, where QG was found to equal 6×10⁷. In this simulation the cavity walls were set as having the conductivity of aluminium, however for highly conducting walls QG is expected to only very weakly depend on the actual conductance value. This is likely an
overestimate as alignment and manufacturing errors will decrease the choke performance hence
an estimate was also made using the measurements. The lower bound can be found by combining
Eqs. (9), (11) and (15) to derive a formula for QG:
1 1
. 1
sam cav
S s S c
G L
R p R p
Q Q G
(24)
RSsam was calculated with Eq. (23) using literature data for the bulk conductivity of the metals and the r.m.s. surface roughness (see Table 1). These calculated values of RSsam were inserted into Eq. (24) along with the cavity parameters G, pc and ps calculated in CST MWS, and RScav calculated as in Section 2.3 to be 4.76×10⁻² and 9.15×10⁻² for the aluminium and niobium cavities, respectively. While both cavities have the same geometry in principle, the chokes’
performance is very sensitive to manufacturing tolerances hence we need to calculate it for both
cavities separately. Over several different combinations of materials, the r.m.s. QG found was 92,000 for the aluminium cavity and 89,000 for the niobium cavity. This would introduce an
additional systematic error into the measurements: up to + 5/–0 % for Q0 and up to +0/–12 % for
RS.
Unaccounted-for possible sources of error are:
The assumption that the metal remains in the normal skin-depth regime.
The roughness-modified formula for RS is only an empirical approximation.
The metal samples used might have been slightly different in composition and structure to
those measured in the literature. Therefore, their bulk resistivity might be slightly different
from that quoted.
Surface oxidation, dirt and/or fractures beneath the surface of the samples could all also have
had an effect on RS which is not currently quantifiable.
Calibration to the end of the RF probe was not possible in our setup.
3.5 Fitting the analytical model to the experimental data
The RSsam calculated from experimental measurement has been plotted alongside the analytical predictions with use of Eqs. (19) and (22): for the four NEG coatings at various deposition
thicknesses, see Fig. 6. The bulk conductivity of the NEG coatings can then be estimated from
the fit. It can be noticed that good agreement has been achieved for all NEG on copper. However,
the fit for dense NEG on silicon is poor for d1 1 m and there is no correlation between theoretical and measured values for the columnar NEG on silicon; this can be explained by the
film thickness being thinner than the skin depth. In this case the surface current flows on both
sides of the NEG coating and the currents induce RF radiation in the silicon dielectric substrate,
therefore Eq. (11) should be re-written as follows:
0
1 1 1 1 1
,
L E G ol
Q Q Q Q Q (25)
where Qol represents other losses which are in this case the losses through the columnar NEG film and are no longer negligible. Therefore, the RS calculations with use of Eq. (9) for the NEG film on silicon could be invalid, at least for dense NEG with d1 1 m and for the columnar NEG with d1 25 m. Thus the comparison of the measurements and the analytical model demonstrates that when this measurement method returns RS> 1 the result should not be considered to be reliable.
The bulk conductivity was obtained from a best fit to the experimental data for both types
of NEG coating with Eqs. (19) and (22):
𝜎𝑑 = 1.4×10⁴𝑆/𝑚 for the columnar NEG coating,
𝜎𝑑 = 8×10⁵𝑆/𝑚 for the dense NEG coating.
It is worth mentioning that the calculated value of bulk conductivity for the dense NEG
coatings is exactly the same as that of bulk Ti-Zr-Hf-V alloy as measured on the 3-mm-diameter
rod which was used as a target for vacuum chamber deposition in ASTeC [31].
To compare the surface resistance of dense and columnar films as a function of NEG film
thickness is divided into five zones, as shown in Fig. 7:
(I) NEG coating’s impact on the substrate surface resistance is negligible: RS(NEG)
(II) RS of dense NEG coating steadily increases to its maximum, the columnar NEG impact on RS is still negligible: RS(dense) > RS(columnar) RS(Cu);
(III) RS of columnar NEG coating steadily increases and reaches a maximum value for dense NEG: RS(Cu) < RS(columnar) < RS(dense);
(IV) RS of columnar NEG coating steadily increases to its maximum: RS(Cu) < RS(dense) <
RS(columnar);
(V) RS of both dense and columnar NEG do not increase further with thickness.
Due to its lower conductivity the columnar NEG coating provides negligible impact on the
substrate surface resistance for larger thicknesses than the dense NEG coating; however, the
latter provides the lower RS for thicker coating (a coating thick enough to be radioopaque). It is important to note here that the structure of NEG coating can vary with deposition conditions and
parameters between the two extremes studied in this study, i.e. in general the bulk conductivity
[image:20.612.128.485.396.638.2]will be between measured values: 1.4×10⁴𝜎𝑑 8×10⁵𝑆/𝑚; therefore, the RS of such a film will start increasing in zone (II) and its maximum will be between those measured here.
4.
SURFACE AND WAKEFIELD IMPEDANCE
4.1 Resistive wall wakefield effects
In this section the resistive wall wakefield effects in vacuum vessels coated with either dense or
columnar NEG film are studied and the performance of the two vessels is compared. A Gaussian
electron bunch traveling down the axis of a copper pipe of circular cross-section and radius 5
mm is considered. The thickness of the NEG layer coating the pipe is d. The standard approach
[1,2] to calculating the longitudinal wakefield impedance of these structures ZW() has been employed. It has been assumed that the bunch spectrum frequencies are within the validity of the
classical free-electron conductivity model (a.k.a. Drude model) and well below the onset of
interband transitions that lead to a complex dependence of conductivity on frequency (see e.g.
[32]). The longitudinal wakefield impedance is in turn used to calculate the energy loss and the
correlated energy spread induced in the bunch. The bunch length values range from a few
femtoseconds (relevant to a modern free electron laser) up to a few picoseconds. Figure 8 shows
the result. Intuitively one would expect the vessel coated with higher-conductivity material
(dense NEG) to outperform that coated with the lower-conductivity material (columnar NEG).
However, as Fig. 8 shows, this is not always the case. At very short bunch lengths the two types
of coatings perform at comparable levels and this is related to the fact that the resistive wall
wakefield generated by a very short bunch approaches a limit that does not depend on the
conductivity of the vessel but only on its radius [1]. In the low-frequency regime (bunch lengths
exceeding 0.5 ps) (Fig. 8a and 8b) the extent to which the higher-conductivity film outperforms
the lower-conductivity one becomes less pronounced. Surprisingly, in this regime the energy loss
caused by the lower-conductivity, columnar NEG film is lower than that caused by the
higher-conductivity dense film. This result can be explained by Fig. 8c. As can be seen at frequencies
below ~1.2 THz the wakefield impedance of the columnar film (responsible for the energy
losses) is lower than that of the dense film. For bunches of spectral width significantly less than
~1.2 THz the contribution of the sharp resonant peak displayed by the columnar NEG film is
insignificant. The energy of such bunches is absorbed in both the coatings and in the copper
substrate. In other words the longer bunch wakefield “sees” the high-conductivity copper and
this yields a lower value of the energy loss compared to a dense film. In the latter the field is
FIG. 8. Ratios between (a) the energy losses and (b) the energy spreads induced by resistive wakefields in a circular copper pipe of radius 5 mm coated with columnar (“Col”) and dense (“Den”) NEG layers of thickness d. (c)
Real part of the longitudinal wakefield impedance of three copper pipes of radius 5 mm coated by: a layer of dense NEG (“Dense”), a layer of columnar NEG (“Columnar”) (d=5 µm) and an uncoated pipe (“Bulk copper”). The
conductivity values for dense NEG, columnar NEG and copper are 𝜎Den = 8×10⁵𝑆/𝑚, 𝜎Col = 1.4×10⁴𝑆/𝑚 and 𝜎Cu =
5.9×10⁷𝑆/𝑚. It is assumed that the Drude relaxation time of both dense and columnar NEG is equal to zero and its value for copper is τ =27 fs. The inset shows shows the behavior of the real parts of the longitudinal impedances of
At frequencies below ~100 GHz the value of the impedance of the columnar film is very close
to that of an uncoated copper vessel of the same radius. In this frequency range the 0.5 µm
columnar film is effectively transparent and the electromagnetic energy is absorbed entirely in
the copper vessel.
The intermediate range of frequencies (and bunch lengths) corresponds to a situation
where the bunch length is still far from the ultra-short bunch limit (where there is no dependence
on the conductivity) but the bunch spectrum is sufficiently wide that the contribution of the sharp
peak of the real part of the impedance of columnar NEG (see Fig. 8c) becomes dominant in the
expression for the energy loss (see e.g. [2]). In this regime energy is absorbed predominantly in
the coatings and the higher-conductivity material outperforms the lower-conductivity one.
4.2 Calculation of R
Sat various frequencies
The obtained bulk conductivity of the columnar and dense NEG coatings can be used with the
analytical model for calculating the surface resistance of NEG coatings on various substrate
materials and at various frequencies.
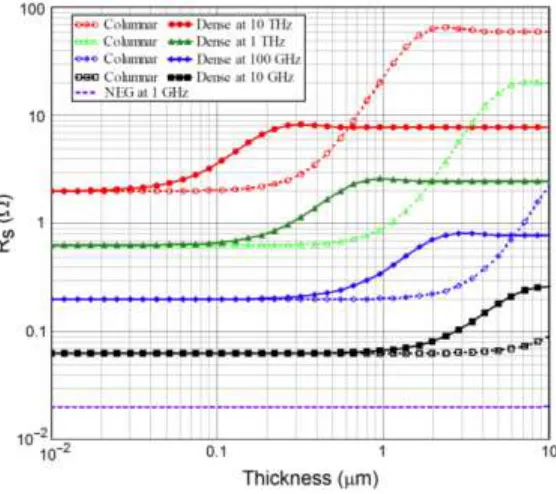
Surface resistance of NEG coatings on copper, aluminium and 304L stainless steel were
calculated as a function of film thickness for dense and columnar film at the following
frequencies: 1, 10 and 100 GHz, 1 and 10 THz. The results are shown in Figs. 9-11.
The frequency dependence of the results can be explained by the frequency dependence
of the skin depth and the material properties and thickness of the various layers. At higher
frequencies, the skin depth is shorter, and the relative effect of the first layer on the overall
surface resistance is greater. Let’s consider using a typical 1-m thick NEG coating. Its impact
on the copper and aluminium substrate surface resistance (see Figs. 9-10) will be the following:
negligible at f = 1-10 GHz,
negligible with the columnar NEG but increased with the dense NEG at f = 100 GHz,
at f = 1 THz it will reach its maximum with the dense NEG which is higher than for the
columnar NEG,
at f = 10 THz the surface resistance of the dense NEG is lower than that of the columnar
For films on stainless steel the difference between the dense and columnar NEG coating is
[image:24.612.168.445.154.398.2]insignificant at f = 1-103 GHz and only at f = 10 THz is the surface resistance of the columnar NEG significantly higher than of the dense NEG.
FIG. 9. The surface resistance RS as a function of NEG film thickness on copper at various frequencies.
[image:24.612.168.446.440.687.2]FIG. 11. The surface resistance RS as a function of NEG film thickness on 304L stainless steel at various
frequencies.
5. Conclusions
1. The three-choked cavity is a valuable and reliable tool for measurement of the surface
resistance of metal surfaces and obtaining the bulk conductance of thin films.
2. The surface resistance of two types of NEG coating (dense and columnar) was investigated at
7.8 GHz. The bulk conductivity was obtained with the analytical model: 𝜎𝑑 = 1.4×10⁴ 𝑆/𝑚 for the columnar NEG coating and 𝜎𝑑 = 8×10⁵𝑆/𝑚 for the dense NEG coating.
3. The standard analytical models for the surface resistance of multilayer structures and the
obtained experimental results for the films deposited on copper substrates are in good
agreement.
4. Based on the NEG conductivity values obtained at 7.8 GHz (and with the assumption that the
classical Drude model is still valid) the beam energy loss and the energy spread induced by
resistive wall wakefield effects on the beam have been investigated and compared in vessels
coated with either of the two types of film.
5. It was demonstrated that the surface resistance of copper at GHz frequencies increases
classical Drude conductivity model is still valid (implying frequency-independent
conductivity) the theoretical model indicates that the increase could be significant at THz
frequencies.
Acknowledgements
This work was conducted under the aegis of the Science & Technology Facility Council (STFC).
The authors would also like to acknowledge the support provided by ASML (Veldhoven,
Netherlands).
References:
[1] B. Zotter and S. Kheifets, Impedances and Wakes in High-Energy Particle Accelerators, World Scientific (1990).
[2] A. Chao, Physics of Collective Beam Instabilities in High-Energy Accelerators, Willey&Sons (1993). [3] C. Benvenuti, Proc. EPAC1998, Stockholm, Sweden, p. 200 (1998).
[4] C. Benvenuti, P. Chiggiato, F. Cicoira and V. Ruzinov, Vacuum 50, 57 (1998).
[5] V. Bencini, G. Bregliozzi, V. Baglin, et al. Proc. IPAC2015, Richmond, VA, USA, p. 3100 (2015). [6] C. Herbeaux , N. Béchu and J-M. Filhol. Proc. EPAC08, Genoa, Italy, p. 3696.
[7] S. Calatroni, P. Chiggiato, P. Costa Pinto, et al. Proc. IPAC2013, Shanghai, China, p. 3385 (2013). [8] R. Kersevan. Proc. EPAC-2000, Vienna, Austria, p. 2291 (2000).
[9] J.D. Herbert, O.B. Malyshev, K.J. Middleman and R.J. Reid. Vacuum 73, 219 (2004).
[10] F. Mazzolini, J. Miertusova, F. Pradal, L. Rumiz. Proc. EPAC2002, Paris, France, p. 2577 (2002). [11] CST AG, Bad Nauheimer Str. 19 Darmstadt, 64289 Germany.
[12] P. Goudket, L, Gurran, G. Burt, et al. Proc. IPAC2015, Richmond, VA, USA, p. 3235 (2015). [13] H. Padamsee, J. Knobloch and T. Hayes, RF Superconductivity for Accelerators, Wiley, 1998. [14] Jin Au Kong, Electromagnetic wave theory, Willey &Sons (1990).
[15] Chien-Jang Wu, Yao-Li Chen and Tzong-Jer Yang, J Supercond Nov Magn 23, 545 (2010). [16] http://www.gb.nrao.edu/electronics/edir/edir302.pdf.
[17] E. Koukovini-Platia, G. Rumolo and C. Zannini, Proc. IPAC, Dresden, Germany, 2384 (2014). [18] V. Shalaev, Nature Photon. 1, 41 (2007).
[19] H. K. Yuan et al, Opt Express 15, 1076 (2007).
[20] A. Danisi, C. Zannini, A. Masi, R. Losito and B. Salvant, Proc. IPAC, Dresden, Germany, 1695 (2014).
[21] J. Krupka, J. Breeze, A. Centeno, N. Alford, T. Claussen, and L. Jensen, IEEE Transactions on Microwave Theory and Techniques 54 (2006).
[22] W. M. Haynes (ed) CRC Handbook of Chemistry and Physics, 94th Edition. CRC Press. Boca Roton, Florida, 2013; Sections 4 and 12.
[23] Stainless Steel - Grade 304 (UNS S30400). AZO Materials at
http://www.azom.com/article.aspx?ArticleID=965 17/11/15.
[24] E. O. Hammerstadt and F. Bekkadal, "A Microstrip Handbook", ELAB Report STF 44 A74169, Univ. of Trondheim, Norway, 1975, pages 98-110.
[25] С. Benvenuti, A. Escudeiro Santana, and V. Ruzinov, Vacuum 60, 279 (2001). [26] P. Chiggiato and R. Kersevan, Vacuum 60, 67 (2001).
[28] O. B. Malyshev. Vacuum Systems for the ILC Damping Rings. EuroTeV report-2006-094 & Cockcroft-06-84. [Nov 2006. http://www.eurotev.org/.
[29] O. B. Malyshev, R. Valizadeh, R. M. A. Jones and A. Hannah, Vacuum 86, 2035 (2012). [30] O.B. Malyshev, R. Valizadeh and A. Hannah. Vacuum 100, 26 (2014).
[31] O.B. Malyshev, R. Valizadeh, B.T. Hogan and A. Hannah. J. Vac. Sci. Technol. A 32, 061601 (2014).