Next Generation Analytics for Open
Pervasive Display Networks
Mateusz Andrzej Mikusz
School of Computing and Communications Lancaster University
This dissertation is submitted for the degree of Doctor of Philosophy
Declaration
This thesis has been written by myself and has not been submitted in support of an application for another degree at this or any other university. Excerpts of this dissertation have been
published in the following conference manuscripts and academic publications on which I
was a leading or contributing author (in reverse chronological order): [Mik+18a;Mik+18b; Mik+18c;Mik+18d;MCD17;Elh+17;Mik+16;Mik+15;MCD15;Cli+14].
The research conducted in the context of this thesis was partially funded through the Future
and Emerging Technologies (FET) programme within the 7th Framework Programme for Research of the European Commission, under FET grant number: 612933 (RECALL), by the
UK EPSRC under grant numbers EP/N023234/1 (PETRAS) and EP/N028228/1 (PACTMAN),
and by a Google Faculty Research Award.
Some portions of this thesis have been developed in collaboration with colleagues from
Lancaster University and other institutions. The e-Campus display network was subject to
prior research described in [FDE12;Cli+13;Dav+14]. In particular, the Yarely signage player was designed and developed by Clinch et al. [Cli+13]. The original system architecture and design of Tacita was first introduced by Davies et al. [Dav+14] and reported in detail in [Cli13]. The Tacita mobile client described in Section3.4.1.3(p.69) was implemented by Peter Shaw. The following personalisable applications introduced in Table6.5(p.144) were implemented by Peter Shaw and Ludwig Trotter: Bus Departures, World Clock, News, Live TV, Twitter News Feed, and Pictures. The walk-by evaluations of the Bluetooth Low Energy
beacon performance described in Section6.3.2.1(p.134) were conducted with the help of Peter Shaw, Ludwig Trotter and Petteri Nurmi. The prototype mobile application to capture beacon detection latencies described in Section6.3.2.2(p.135) was implemented by Peter Shaw. The map provider and mapping schema of public displays (Section3.4.1.2, p.69) was designed in collaboration with Nigel Davies, Peter Shaw, Ivan Elhart and Marc Langheinrich. In the context of Tacita, my contributions were focussed on designing the revised overall
system architecture and associated application programming interfaces spanning across the
mobile phone client, trusted content providers, display gateway and display nodes. The Wi-Fi fingerprinting approach to tracking individuals as part of the infrastructure-based tracking
approach (Sections3.4.2, p.73; and6.4, p.149) was provided by LiveLabs [Jay+16].
Acknowledgements
First and foremost, I would like to express my deepest gratitude to my supervisor Professor Nigel Davies. His continuous guidance and mentoring throughout my Ph.D., abilities of
always having a clear vision of the research and often seeing the unobvious were of enormous
help and truly inspiring. The endless coffee and late-night paper writing sessions were highly appreciated! I also owe my deepest thanks for the opportunities that were given beyond the
scope of ‘just’ conducting my Ph.D.: collaborations with other research institutions, spending
time abroad and contributing to a wide range of projects. This ultimately allowed me to gain an enormous amount of experience and to develop and foster my future career. I would like
thank Professor Rajesh Krishna Balan and Professor Youngki Lee who very kindly hosted
me as a visiting researcher at LiveLabs at Singapore Management University, and invited me for a subsequent visit that allowed me to continue working on our collaborative projects.
I am extending my gratitude to my previous supervisors Professor Albrecht Schmidt and
Professor Florian Alt for introducing me to Lancaster, and giving me the cherished opportunity to conduct a semester abroad in the context of my undergraduate studies that eventually led to
my Ph.D.
One of my main reasons for conducting my Ph.D. at Lancaster (despite the good weather,
of course) was the amazing and unique work environment at the School of Computing and
Communications and the Data Science Institute. Special thanks is given to Professor Adrian Friday and Dr. Sarah Clinch who (especially early on) provided me with assistance to get a
head start on e-Campus. Just like any other system, a display network would be worthless
without an active user base. I am grateful to all e-Campus users with a special mention of the Internal Communications team who helped us turn the initially small deployment into the
dedicated signage network of the University. Of course, one of the major pillars of an amazing
work environment are the colleagues with whom I have shared an office space. Therefore, special thanks to all current and previous members of ‘Team D23’ including Mike Harding
who always provided help and guidance to everyone, Peter Shaw and Sarah Clinch with whom
I shared endless hours debugging e-Campus components and worked hard to bring e-Campus forward, and Ludwig Trotter for helping to recruit lots of Tacita users.
Throughout my Ph.D., I have worked on a number of national and international projects
and collaborated with many other researchers. In particular, I would like to extend my thank-fulness to all project members of PD-NET, RECALL, PETRAS and PACTMAN. Working on
iv
collaborations. Special thanks to Professor Marc Langheinrich and Dr. Ivan Elhart for the
efforts of making Tacita work across different deployment sites.
The completion of my studies would have been impossible without permanent support and
encouragement of my close family. I would like to thank Katharina for her tireless support,
motivation and also her patience during countless late-night working hours. I would also like to express my deepest gratitude to my parents Bogumila and Tomasz, my brother Marcin and
Abstract
Next Generation Analytics for Open Pervasive Display Networks
Mateusz Andrzej Mikusz
Dipl.-Inf. (University of Stuttgart, 2013)
Submitted for the degree of Doctor of Philosophy.
October 2018
Public displays and digital signs are becoming increasingly widely deployed as many
spaces move towards becoming highly interactive and augmented environments. Market trends suggest further significant increases in the number of digital signs and both researchers and
commercial entities are working on designing and developing novel uses for this technology.
Given the level of investment, it is increasingly important to be able to understand the effectiveness of public displays. Current state-of-the-art analytics technology is limited in
the extent to which it addresses the challenges that arise from display deployments becoming
open(increasing numbers of stakeholders),networked(viewer engagement across devices and
locations) andpervasive(high density of displays and sensing technology leading to potential
privacy threats for viewers).
In this thesis, we provide the first exploration into achieving next generation display
analytics in the context of open pervasive display networks. In particular, we investigated three
areas of challenge: analytics data capture,reportingandautomated use of analytics data. Drawing on the increasing number of stakeholders, we conducted an extensive review of related
work to identify data that can be captured by individual stakeholders of a display network, and
highlighted the opportunities for gaining insights by combining datasets owned by different stakeholders. Additionally, we identified the importance ofviewer-centric analyticsthat use
traditional display-oriented analytics data combined with viewer mobility patterns to produce
entirely new sets of analytics reports. We explored a range of approaches to generating viewer-centric analytics including the use of mobility models as a way to create ‘synthetic analytics’ –
an approach that provides highly detailed analytics whilst preserving viewer privacy.
vi
the effectiveness of displays, the visibility of content across the display network, and the
visibility of content to viewers. We further identified additional reports specific to those display networks that support the delivery of personalised content to viewers. Additionally,
we highlighted the similarities between digital signage and Web analytics and introduced
novel forms of digital signage analytics reports created by leveraging existing Web analytics engines.
Whilst the majority of analytics systems focus solely on the capture and reporting of analytics insights, we additionally explored the automated use of analytics data. One of
the challenges in open pervasive display networks is accommodating potentially competing
content scheduling constraints and requirements that originate from the large number of stakeholders – in addition to contextual changes that may originate from analytics insights.
To address these challenges, we designed and developed the first lottery scheduling approach
for digital signage providing a means to accommodate potentially conflicting scheduling constraints, and supporting context- and event-based scheduling based on analytics data fed
back into the digital sign.
In order to evaluate the set of systems and approaches presented in this thesis, we conducted large-scale, long-term trials allowing us to show both the technical feasibility of the systems
developed and provide insights into the accuracy and performance of different analytics
capture technologies. Our work provides a set of tools and techniques for next generation digital signage analytics and lays the foundation for more general people-centric analytics that
go beyond the domain of digital signs and enable unique analytical insights and understanding
Table of Contents
List of Figures xiii
List of Tables xvii
Nomenclature xx
1 Introduction 1
1.1 The Emergence of Pervasive Display Networks . . . 1
1.2 The Need for New Forms of Signage Analytics . . . 3
1.3 Research Context . . . 6
1.4 Contributions . . . 8
1.5 Scope and Limitations . . . 11
1.6 Thesis Structure . . . 12
2 Background 13 2.1 Overview . . . 13
2.2 Audience Models and Metrics . . . 14
2.3 Data Capture . . . 17
2.3.1 Systems . . . 17
2.3.2 Audience Numbers and Demographics . . . 19
2.3.3 Audience Engagement and Movement . . . 22
2.3.3.1 Proximity-Aware Systems . . . 22
2.3.3.2 Capture of In-Door Viewer Movement Patterns . . . 24
2.3.3.3 Large-Scaled Viewer Navigation and Movement Patterns . 26 2.3.4 Interaction Events . . . 28
2.3.4.1 Touch . . . 28
2.3.4.2 Gesture . . . 29
2.3.4.3 Gaze . . . 31
2.3.4.4 Mobile Phone . . . 32
2.3.4.5 Comparing Interaction Modalities . . . 33
2.4 Reporting . . . 34
2.4.1 Statistical Reports about Systems and Content . . . 34
Table of Contents viii
2.4.2.1 Funnel and Flow Diagrams . . . 35
2.4.2.2 Heatmaps . . . 36
2.4.3 Analytics Reporting in Related Areas . . . 36
2.4.3.1 Web Analytics . . . 37
2.4.3.2 Retail . . . 38
2.5 Automated Use of Analytics Data . . . 40
2.5.1 Targeted Advertising . . . 40
2.5.2 Content Scheduling and Content Creation . . . 42
2.6 Analysis . . . 43
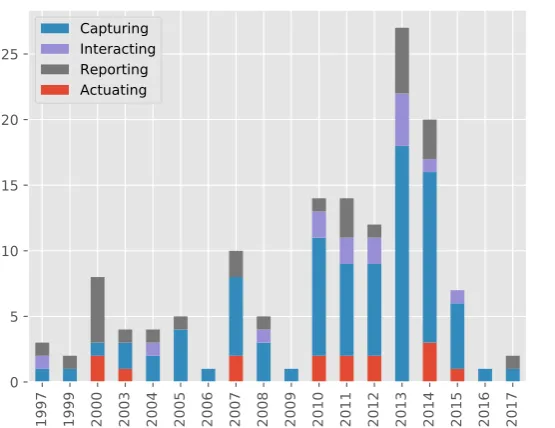
2.6.1 Evolution and Coverage . . . 43
2.6.2 Suitability for Pervasive Display Networks . . . 45
2.7 Summary . . . 47
3 Analytics Data Capture and Generation 48 3.1 Overview . . . 48
3.2 Framework for Multi-Stakeholder Analytics Data Sharing . . . 49
3.2.1 Stakeholders of Open Display Networks . . . 50
3.2.2 Stakeholder Data Collection Analysis . . . 51
3.2.2.1 Display Owners . . . 52
3.2.2.2 Space Owners . . . 52
3.2.2.3 Content Providers . . . 53
3.2.2.4 Viewers . . . 53
3.2.3 Categorisation of Data Collection . . . 53
3.2.4 Opportunities from Analytics Synthesis . . . 56
3.2.4.1 Creation of Novel Insights . . . 56
3.2.4.2 Additional Benefits . . . 58
3.2.4.3 Attitudes Toward Data Sharing . . . 59
3.3 Capturing Traditional Signage Analytics Data . . . 59
3.3.1 Overview . . . 59
3.3.2 Client-side Data Collection . . . 60
3.3.2.1 Data Modelling . . . 60
3.3.2.2 Display Client Libraries . . . 61
3.3.3 Server-side System Architecture . . . 62
3.3.3.1 Data Capture and Import . . . 62
3.3.3.2 Pre-processing and Data Integration . . . 63
3.3.3.3 Injection Modules and Export . . . 63
3.3.4 Implementation . . . 64
3.3.4.1 Client Libraries . . . 64
3.3.4.2 User Interface . . . 65
3.3.4.3 Server-side System . . . 65
Table of Contents ix
3.4 Capturing Viewer Mobility Data . . . 65
3.4.1 Viewer-based Tracking . . . 66
3.4.1.1 Back-end Systems Architecture Design . . . 67
3.4.1.2 Mapping of the Public Display Network . . . 69
3.4.1.3 Mobile Applications . . . 69
3.4.1.4 Opportunities for Data Collection . . . 71
3.4.1.5 Implementation . . . 72
3.4.1.6 Evaluation . . . 72
3.4.2 Infrastructure-based Tracking . . . 73
3.4.2.1 System Design and Architecture . . . 73
3.4.2.2 Opportunities for Data Collection . . . 75
3.4.2.3 Considerations . . . 75
3.4.2.4 Implementation . . . 76
3.4.2.5 Evaluation . . . 76
3.4.3 Synthetic Analytics . . . 76
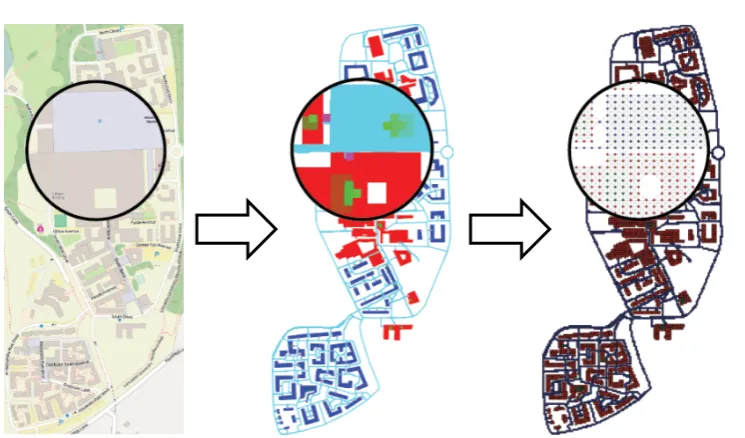
3.4.3.1 Spatial Map and Probability Model . . . 77
3.4.3.2 Mobility Simulation . . . 78
3.4.3.3 Modelling Synthetic Viewer Mobility Traces . . . 79
3.4.3.4 Combination with Real-world Datasets . . . 80
3.4.3.5 Implementation . . . 81
3.5 Summary . . . 81
4 Reporting 82 4.1 Overview . . . 82
4.2 Analytics Based on Viewer Data . . . 83
4.2.1 Datasets and Methodology . . . 83
4.2.1.1 Synthetic Analytics . . . 84
4.2.1.2 Tacita . . . 84
4.2.1.3 Comparing the Applicability of Synthetic Analytics and Tacita . . . 85
4.2.2 Effectiveness of Displays . . . 85
4.2.2.1 Reports Based on Synthetic Analytics . . . 86
4.2.2.2 Reports Based on Tacita . . . 87
4.2.2.3 Stakeholder Analysis . . . 89
4.2.3 Network Visibility of Content . . . 90
4.2.3.1 Reports Based on Synthetic Analytics . . . 90
4.2.3.2 Reports Based on Tacita . . . 92
4.2.3.3 Stakeholder Analysis . . . 95
4.2.4 Viewer-centric Analytics . . . 95
4.2.4.1 Reports Based on Synthetic Analytics . . . 96
Table of Contents x
4.2.4.3 Stakeholder Analysis . . . 98
4.2.5 Display Personalisation Retention Analytics . . . 98
4.2.5.1 Usage and Interactions . . . 99
4.2.5.2 Retention Rates . . . 100
4.2.5.3 Stakeholder Analysis . . . 101
4.2.5.4 Limitations . . . 102
4.3 Using Web Analytics Engines for Display Analytics Reporting . . . 102
4.3.1 Overview of Web Analytics Terminology . . . 102
4.3.2 Mapping from Signage to Web Analytics Terminology . . . 104
4.3.3 Example Reports and Visualisations . . . 106
4.3.3.1 Display-oriented Performance Reports . . . 106
4.3.3.2 Specific Reports for Content and Service Providers . . . . 107
4.4 Summary . . . 109
5 Automated Use of Pervasive Display Analytics 111 5.1 Overview . . . 111
5.2 The Need for Dynamic Content Scheduling . . . 111
5.2.1 Existing Content Scheduling Approaches . . . 112
5.2.2 Scheduling in Operating Systems . . . 112
5.3 Lottery Scheduling for Digital Signage . . . 114
5.3.1 Applicability of Lottery Scheduling to the Public Display Domain . . 114
5.4 Lottery Scheduling System Architecture . . . 117
5.4.1 System Architecture Overview . . . 117
5.4.2 Scheduling Manager . . . 118
5.4.3 Context and Constraints Parser . . . 119
5.4.4 Context Store . . . 119
5.4.5 Filtering . . . 119
5.4.6 Lottery Ticket Allocation . . . 120
5.4.7 Configuration . . . 121
5.4.8 Analytics . . . 121
5.5 Implementation . . . 121
5.6 Evaluation . . . 122
5.7 Summary . . . 122
6 Trials 124 6.1 Overview . . . 124
6.2 Pheme: Display-oriented Data Collection . . . 125
6.2.1 Integration into e-Campus . . . 125
6.2.2 Mapping and Injection Module Integration . . . 126
6.2.3 Reported and Captured Analytics Data . . . 127
Table of Contents xi
6.3 Tacita: Client-based Tracking . . . 130
6.3.1 Methodology and Datasets . . . 130
6.3.1.1 Integration in the Context of e-Campus . . . 130
6.3.1.2 Trial Context and Collected Datasets . . . 132
6.3.2 Viewer Detection Accuracy and Performance . . . 134
6.3.2.1 Beacon Detection Accuracy and Performance . . . 134
6.3.2.2 Prototype System for Beacon Detection . . . 135
6.3.2.3 Beacon Entry and Exit Detections – Controlled Lab-based Experiment . . . 138
6.3.2.4 Beacon Entry and Exit Detections – Controlled Walk-by Experiments . . . 139
6.3.3 System Component Latencies . . . 141
6.3.3.1 Accuracy for Analytics Data Capture . . . 143
6.3.4 Usage Pattern Analysis . . . 144
6.3.4.1 Trusted Content Provider Usage . . . 144
6.3.4.2 Spatial Request Patterns . . . 146
6.3.4.3 User Retention and Usage Duration . . . 147
6.4 Infrastructure-based Tracking . . . 149
6.4.1 Methodology and Datasets . . . 150
6.4.1.1 Integration in the Context of LiveLabs . . . 150
6.4.1.2 Trial Context and Collected Datasets . . . 154
6.4.2 Impact of Trigger Zone Sizes . . . 156
6.4.3 Impact of Display Location Characteristics . . . 158
6.5 Comparison of Viewer Mobility Tracking Approaches . . . 160
6.5.1 Display Owners . . . 161
6.5.2 Space Owners . . . 161
6.5.3 Content Providers . . . 162
6.5.4 Viewers . . . 163
6.6 Lottery Scheduling . . . 164
6.6.1 Benchmarking . . . 164
6.6.1.1 Apparatus . . . 164
6.6.1.2 Results . . . 165
6.6.2 Accuracy in a Real-World Deployment . . . 167
6.6.2.1 Apparatus . . . 167
6.6.2.2 Results . . . 167
6.7 Summary . . . 169
7 Analysis, Conclusions and Future Work 171 7.1 Overview . . . 171
7.2 Analysis . . . 173
Table of Contents xii
7.2.2 Benefits to Other Research Communities . . . 177
7.3 Contributions . . . 178
7.3.1 C1: Analytics Data Collection . . . 178
7.3.2 C2: Reporting . . . 179
7.3.3 C3: Automated Use of Analytics Data . . . 180
7.3.4 C4: Systems Evaluation and Large-scale Trials . . . 180
7.4 Future Work . . . 181
7.4.1 The Physical Cookie . . . 181
7.4.2 Synthetic Analytics . . . 182
7.4.3 Scheduling for the Individual . . . 183
List of Figures
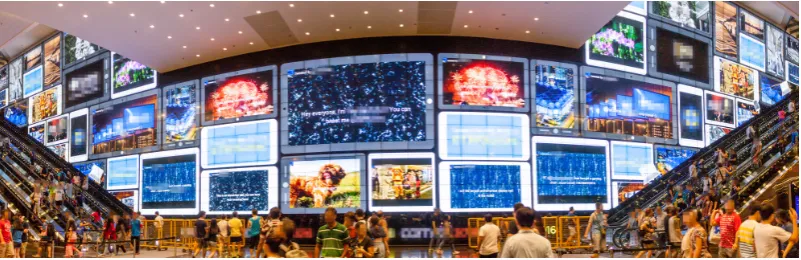
1.1 World’s largest high-definition display wall at the Suntec Singapore
conven-tion centre. . . 1
1.2 Typical display deployments at Lancaster University. . . 7
1.3 Map and overview of e-Campus displays at Lancaster University . . . 8
2.1 Overview of interaction zones by Vogel and Balakrishnan (redrawn from [VB04]). . . 14
2.2 Screenshot of SPINETIX Cockpit [Cor]. . . 18
2.3 Trends in related digital signage analytics work. . . 44
3.1 Fundamentals of the generation and collection of viewer-centric analytics in digital signage. . . 48
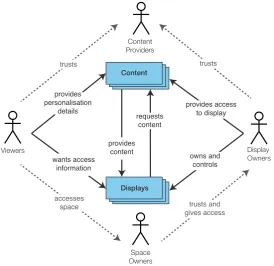
3.2 Stakeholders in open display networks. . . 51
3.3 Data collection and sharing matrix. . . 55
3.4 Focus on the collection of traditional,display-oriented sign analyticsdata fundamental to the creation of viewer-centric analytics. . . 59
3.5 Pheme high level architecture diagram. . . 62
3.6 Pheme user interface. . . 64
3.7 Tacita trust relationship diagram. . . 66
3.8 Tacita system architecture and data flow diagram (based on [Dav+14] and adapted in [Mik+18d]). . . 67
3.9 Tacita mobile application for Apple iOS (initially published in [Mik+18d]). . 71
3.10 System architecture for infrastructure-based tracking. . . 74
3.11 The basis for synthetic analytics are regular maps (left), which are annotated in a subsequent process (middle) and automatically transformed into a graph-based structure (right). . . 77
List of Figures xiv
4.2 Mean ratio of unique visitors to total number of visits for each class of
mobility model (ordered by the ratio for theOff-Campus Student) for each display deployment. Low ratios indicate displays that have a greater set of
reoccurring visitors whilst high values represent displays with a greater set of
unique visitors (initially published in [Mik+16]). . . 87
4.3 Heatmap of proportionally popular displays on which personalised content was requested (initially published in [Mik+18d]). . . 88
4.4 Cumulative distribution function of frequencies of content views for the three synthetic analytics mobility models (initially published in [Mik+16]). . . 91
4.5 Number of total requests per Tacita application per day (initially published in [Mik+18d]). . . 92
4.6 Number of unique users per Tacita application per day (initially published in [Mik+18d]). . . 93
4.7 Total number of unique users per Tacita application (initially published in [Mik+18d]). . . 94
4.8 Growth of Tacita users throughout the deployment (blue) and unique number of users per day (red) (initially published in [Mik+18d]). . . 99
4.9 Cumulative distribution function of frequency of revisiting the configuration pages of individual Trusted Content Providers (initially published in [Mik+18d]). 99 4.10 Tacita user retention reports with aper-daygranularity (initially published in [Mik+18d]). . . 100
4.11 Tacita user retention reports with aper-weekgranularity (initially published in [Mik+18d]). . . 100
4.12 Pheme real-time reports produced through Google Analytics. . . 107
4.13 Pheme event reports produced through Google Analytics. . . 108
4.14 Pheme content reports produced through Google Analytics. . . 108
4.15 Detailed report of displays showing a particular piece of content produced through Google Analytics. . . 109
5.1 Snapshot of an allocation of lottery tickets for 13 distinct content items using recency-, duration-, random- and ratio-based lottery ticket allocation modules each representing different stakeholder requirements. . . 116
5.2 Lottery Scheduler system architecture (initially published in [MCD15]). . . . 118
5.3 Ticket allocation component of the Lottery Scheduler (initially published in [MCD15]). . . 120
List of Figures xv
6.3 Interaction and request flow of Tacita requests across the Display Gateway
and Yarely. . . 131
6.4 Tacita users at Lancaster University over the study period (initially published in [Mik+18d]). . . 133
6.5 Overview of the content delivery process in pervasive display systems together with critical events affecting the proximity detection performance. Beacon entry (1) and exit detection deltas (3) depend on the underlying proximity detection technology, whereas system latency (2) depends on network and system performance (initially published in [Mik+18d]). . . 134
6.6 Floor plan of the controlled walk-by experiments to capture beacon entry and exit detection latencies (initially published in [Mik+18d]). . . 137
6.7 System response latencies in seconds for the chain of Tacita system components.141 6.8 The total number of daily requests issued to Trusted Content Providers across all client applications (top left); originating from the iOS-based Tacita Mobile Client (top right); originating from iLancaster (bottom left); and the number of daily failed requests (bottom right) (initially published in [Mik+18d]). . . . 143
6.9 Number of daily requests for each available Trusted Content Provider (initially published in [Mik+18d]). . . 145
6.10 Numbers of requests of Trusted Content Providers per display location (green: low number of requests; red: high number of requests) across all applications (initially published in [Mik+18d]). . . 146
6.11 Dwell times of viewers in front of displays (green: low dwell times; red: high dwell times). The dwell times have been normalised based on the dis-plays with the highest and lowest dwell times respectively (initially published in [Mik+18d]). . . 146
6.12 Retention weeks by term (initially published in [Mik+18d]). . . 148
6.13 Retention days (initially published in [Mik+18d]). . . 148
6.14 Flow diagram for infrastructure-based personalisation. . . 150
6.15 Flow diagram for infrastructure-based personalisation (display interfaces). . . 153
6.16 Floor plans showing the main floor of the convention space for each of the five experimental settings visualising the display location and its orientation (green circle), differently sized trigger zones (small, medium and large), and the paths of the walk-by experiments. Dots represent an approximation of the granularity of location points provided by the Wi-Fi location system (the floor plans provide an approximation only and have not been drawn to scale). . . . 155
6.17 Box plots of accuracy and content exposure measures across all display locations for each trigger zone size. . . 157
List of Figures xvi
6.19 Density plots showing the delay of content turning on after/before the viewer
enters the viewable area of the display for each trigger zone size across all display locations. . . 160 6.20 Lottery scheduler lab-based benchmarks with 0-10,000 content items with
low and high numbers of lottery tickets (initially published in [MCD15]). . . 165 6.21 Lottery scheduler lab-based benchmarks with 0-50 content items with low
and high numbers of lottery tickets (initially published in [MCD15]). . . 165 6.22 Accuracy of the lottery scheduler using a ratio allocator and sample e-Channel
content (initially published in [MCD15]). . . 168
List of Tables
3.1 Overview of analytics data that can be captured by stakeholders within open
display networks, as grouped by category. . . 54 3.2 Example extensions to UMP to supportProximityandInteractionevent types. 60
4.1 Ranking of public displays at Lancaster University based on synthetic analytics. 86 4.2 Ranking of public displays at Lancaster University based on display
personal-isation requests from Tacita throughout the lifetime of the service (initially published in [Mik+18d]). . . 88 4.3 Aggregated count of unique and total content views per day per viewer for
each mobility model (initially published in [Mik+16]). . . 96 4.4 User-centric statistics for the use of Tacita. . . 97 4.5 Attributes provided to describe Page View and Event hit types in Google
Analytics based on the Universal Measurement Protocol (UMP) [Goo18h]. . . 103 4.6 Mapping of individual attributes from digital signage analytics to Web
analyt-ics’ attributes (based on UMP [Goo18h]). . . 105 4.7 Mapping of reports from Web analytics to digital signage analytics’ metrics
(partially described in [Mik+15]). . . 105
6.1 Number of reported content requests to Pheme over the 365 days by content type. . . 129 6.2 Median, mean and standard deviation for enter region (beacon detected) and
exit region (beacon lost) events (seconds). . . 138 6.3 Median, Mean, and standard deviation for beacon entry detection from
en-tering and leaving the viewable area of the display respectively (initially
published in [Mik+18d]). . . 139 6.4 Median, mean and standard deviation (seconds) of the latencies between
Tacita system components (initially published in [Mik+18d]). . . 141 6.5 Details of application adoption showing the percentage of total users who
issued at least one content request to the Trusted Content Provider and the
availability of the Trusted Content Provider during the study period (initially
List of Tables xviii
6.6 Content accuracy and content exposure measures across all display locations
for each trigger zone size. . . 157 6.7 Content accuracy and content exposure measures for each display location
List of Listings
1 Pheme library example code snippet to enable analytics tracking for
Nomenclature
Acronyms / Abbreviations
ACM Association for Computing Machinery
AIM Anonymous Impression Metrics
API Application Programming Interface
AVA Anonymous Video Analytics
BLE Bluetooth Low Energy
CDS Content Descriptor Set
IoT Internet of Things
QR Quick Response (Code)
REST Representational State Transfer
RFID Radio-frequency Identification
RTLS Real-time Location Tracking
TID Tracking Identifier
UMP Universal Measurement Protocol
URL Uniform Resource Locator
UUID Universally Unique Identifier
Chapter 1
Introduction
1.1
The Emergence of Pervasive Display Networks
Market reports predict a dramatic increase in the number of digital signs and public displays
deployed in urban spaces [Mar17] with a total of “38 million connected digital screens in use worldwide” [Mar17]. By 2021, the number of deployed digital signs is expected to have more than doubled to a total of around 87 million digital signs [Dig17;Mar17]. In line with the increase in the number of deployed digital signs, the market worth for public displays is expected to grow to up to $23 billion indicating the increasing importance of digital
signs [Glo17] – despite the high popularity of mobile phones as a way to access information. In addition to the growth in the number of deployments, we also observe a growth in the size of individual digital signs. For example, large display walls such as the high-definition display
wall at Suntec Singapore (see Figure1.1) are likely to lead to a world in which digital signage will become omnipresent to passers-by and integrated into their daily life [Mik+18a].
Digital signs and public displays are increasingly often also offering a high level of
inter-activity to the viewer. Early work in this space conducted by Vogel and Balakrishnan provided
insights into interaction models that digital signs could support in future: digital signs auto-matically adapt the displayed content based on the spatial location of the viewer in relation to
[image:21.595.110.511.590.720.2]the digital sign [VB04]. Such interaction models have been further developed to, for example,
1.1 The Emergence of Pervasive Display Networks 2
additionally consider viewer identity to enable the delivery of personalised content [Gre+11]. Novel interaction techniques for public displays are constantly developed and include gaze, gesture, forms of remote control and direct touch input [She+14] – highlighting the trend towards highly interactive public displays. Interactive public displays can be often found
situated in railway stations, airports and shopping malls in the form of kiosks allowing the passers-by to search for a specific piece of information.
Besides the increase in the scale and size of digital signs and the development of novel interaction modalities, researchers envision new directions in which digital signage will
develop – changing the nature and characteristics of pervasive display deployments. Davies
et al. [Dav+12] introduced the vision ofopen display networksas the “new communications medium for the 21st century” [Dav+12] in which a large number of distinct stakeholders contribute content, infrastructure and devices to a large, common displays network. Davies
et al. envision future display deployments that feature similar characteristics as modern mobile phone ecosystems in which open platforms such as application stores exist that allow
third-parties including developers, content creators, manufacturers and users to contribute equally
to the market [Dav+12]. Such systems will need to feature open application programming interfaces that can be used by third-party developers to create applications without detailed
knowledge about the specifics of certain display deployments and write applications that can be
supported across large display deployments as part of an open network. Currently, commercial signage networks are closed and cannot be easily accessed by external developers and
third-parties. Moving toward an open display network would substantially increase the potential set
of stakeholders and contributors. It is argued that an open application platform for displays will lead to a comparable dramatic increase in the number of applications and content that
has become available to mobile phones through the application store models [Dav+12]. The
networkedcharacteristic of future display deployments is particularly relevant to describe the
potential scale and dimensions of display deployments especially with the current expectations
of display deployments to grow to close to hundred million devices [Dig17;Mar17;Dav+12] – an open displays platform and application store for public displays would immediately provide access to a large number of displays to third-party developers, content creators and
display owners [Cli+14]. Davies et al. point out that “openness does not stop at developers: public display systems should also be open to content from users” [Dav+12]. With displays becoming ubiquitously integrated into the daily life of users – both in public and private
spaces – the contribution of users to the display network and content displayed will become important to ensure displays are useful to the user and provide a clear benefit through display
personalisation [Dav+14].
To illustrate the future use of public displays in the context of such future networks, Davies, Clinch, and Alt [DCA14] have developed a number of scenarios. The following scenario is an example of the use of ‘open displays’ in the context of a small independent retail shop.
1.2 The Need for New Forms of Signage Analytics 3
strawberries are currently very popular and sell well at the competition, but has
to advertise his strawberries in the local community. He quickly creates a short advertisement and submits it to the “local shopper incentive” scheme in which
viewers who see the advert can retrieve a discount voucher for the local fruit shop.
The discount voucher is also used to track the number of purchases retrieved from the advert and the shop owner has to pay a fee based on the number of new
customers who used the discount. [DCA14]
The scenario above highlights the contrast to large commercial advertisement networks that
typically feature more complex infrastructure and accessibility models – making it challenging for the local shop owner to quickly access display resources. It is further envisioned that
future display networks will aim to influence viewer behaviour by showing more appropriate
and personalised content for the viewer, as described in the following scenario:
Jack is participating in a local walk-to-school programme that aims to increase
the fitness of elementary school children. To encourage participation, the a game has been deployed on the local public display network. On his walk to school,
Jack walks by a number of displays that provide him with a cartoon character and
update on his fitness progress. By walking by a display, Jack also collects points on his mobile phone that can be exchanged for a cartoon book. [Dav+12]
The scenario above illustrates the opportunities of providing personalised content to passers-by and supporting future forms of user interaction and engagement modalities [Dav+12]. Display networks provide a platform to schedule content for individuals regardless of the
dis-plays’ schedules but with respect to the (constantly changing) context of the display [DCA14]. The interactions between the passers-by and the display application enables the stakeholders
of the display network to run novel forms of campaigns that ultimately lead to a behavioural
change of the viewer [DCA14]. Providing personalised and contextualised content to viewers across multiple display deployments and locations is also seen as one way to overcome
“dis-play blindness” [Mül+09] – a common issue in public display deployments where viewers stop paying attention to displays in over-saturated environments [Dav+14].
In summary, we are moving to a world with a rapidly increasing number of displays, larger
screens and complex eco-systems that increase the number of stakeholders and the range of
available content.
1.2
The Need for New Forms of Signage Analytics
The growing number of public displays and digital signs along with the emerging changes in the characteristics of display deployments (e.g. growth in individual display sizes and open
networks accessed by a different stakeholders) lead to new requirements for digital signage
1.2 The Need for New Forms of Signage Analytics 4
viewers’ behaviour. Moreover, understanding the effectiveness of public displays and novel
applications becomes important to all stakeholders involved including developers, content creators and display owners. We can draw on examples from the history of Web analytics,
an application domain that we consider highly related to digital signage analytics due to its
focus on user interaction and tracking (in some cases across sites and domains). The insights gained by analytics have revolutionised the Web and enabled administrators to clearly identify
potential for improvement of the user experience. The analytics space in the Web is well defined: in 2007, the Web Analytics Association issued the latest version of the Web Analytics
Definition as a specification for relevant metrics and aggregations [BBW07]. The standard consists of 26 metrics, of which seven feature the fundamental definition of ‘page visits’ and ‘visitor counts’ used as part of the computation of 13 metrics that describe the type of the
visit (e.g. referrers, visit duration, landing and exit pages), four characterising the content
(e.g. bounce rates or single page visits), and two event and conversion measures to capture user interaction within a single website [BBW07]. Historically, the collection of data relevant for the computation of the described Web analytics reports was performed server-side by
parsing and analysing server access logs. In order to enable the capture of single page user interactions and events (e.g. scrolling behaviour, button clicks and cross-device analytics),
Web analytics have moved toward the collecting of data in the client device. For example,
Google Analytics exclusively features client-side data and user tracking captured through the user’s Web browser, and provides developers with the ability to track users’ on-page behaviour
including customised events such as mouse clicks and scrolling behaviour [Goo18c]. This is an example of the shift of capturing analytics data on the client in contrast to the access logs on the server side, i.e. a form ofuser-centric analytics.
In the digital signage domain the use of novel forms of analytics has not been well studied.
New forms of analytics frameworks will become necessary to support large-scale, open networks of digital signage and to allow stakeholders to better understand the effectiveness
and success of their displays and applications. Currently, state-of-the-art signage analytics
systems focus on the capture and analysis of system-relevant performance measures (e.g. system failures on the signage player [Esp17]), and simple audience analytics such as the number of people walking by a display (e.g. Fraunhofer IIS [Fraa]). Some signage analytics systems provide administrators and content creators with reports on viewer demographics
including age groups and gender [Int18]. All of these insights, however, are captured for isolated digital signage displays or in some cases aggregated across a closed commercial signage network [See]. The access to the captured insights in the form of analytics reports is typically limited to a small set of stakeholders such as the commercial display network
owners [OnS17].
We believe that it will become crucial for future digital signage analytics to perform a
similar shift as that occur in the Web domain from display-oriented analytics to a
viewer-centric analytics approach. To emphasise the need for viewer-viewer-centric analytics and illustrate the opportunities that will emerge from such a shift in the context of open display networks,
1.2 The Need for New Forms of Signage Analytics 5
A large number of digital signage displays are located in the entrance area of
a railway station that is one of the main transportation hubs for the city. The displays are used to show a mix of digital departure times, advertisements and
way-finding content for passers-by. Andreas is a commuter and enters the railway
station and proceeds to the platform from which his commuter train will depart. Andreas happens to walk by a public display just at the very time it is showing
an advertisement for a specific soda drink. While Andreas is passing by the display, he notices the advert and glances at it due to the prominent location of the
display in the entrance area. Even though Andreas was initially heading toward
the platform, because of seeing the advertisement Andreas decides to walk to the closest shop instead and purchase the advertised drink. Upon purchasing the
drink, Andreas leaves the shop and continues to the platform to eventually board
the commuter train. On his way to the platform, Andreas walks by a number of subsequent displays that start showing relevant advertisement and content based
on Andreas’ recent visit to the shop and his purchasing activity.
We envision that future signage analytics systems will be able to answer the question of potentialcause and effectfrom the point at which Andreas entered the railway station and
noticed the advert, to the point at which Andreas purchased the product, and the subsequent
utilisation of analytics insights to improve Andreas’ experience throughout the digital signage network. In order to understand these potential causalities, however, comprehensive analytics
are required to be captured, evaluated and subsequently fed back into the sign – providing the
opportunity to reliably measure the success and effectiveness of content on public displays and for improving the viewer experience. We divided this problem space into three areas
of challenge: 1. analytics data capture, 2. reporting, and 3. automated use of analytics data.
To highlight the challenges and opportunities in each of the three areas, we provide a set of challenges for each of the three areas by drawing on the scenario above.
Analytics Data Capture Specific to the scenario, a number of distinct events need to be captured: the content displayed on the digital sign (i.e. which advert was playing
when Andreas glanced at the display), the navigation and movement traces of people to
understand who is present in the space and how viewers have navigated across displays and locations, glances of passers-by at displays (i.e. Andreas’ glance at the display), and
their purchasing activities (i.e. Andreas purchasing the advertised product). Such events
are typically captured by distinct stakeholders of an open display network (display owners, content providers, retail owners, and Andreas himself) and by heterogeneous
systems. For example, Andreas’ movements could be captured by an indoor location
system, glances at the display through video analytics mounted adjacent to the display, and his purchasing activities through an appropriate shop analytics system.
Reporting In order to understand the potential causalities of viewers (i.e. Andreas viewing
1.3 Research Context 6
captured events need to be linked together and associated to the individual. However, in
the context of open display networks each of these example events are ‘owned’ by a distinct set of stakeholders and captured through systems that are likely disconnected.
In order to create insightful analytics reports that highlight the potential causalities,
such analytics events form need to be shared across stakeholders, linked and associated with an individual. Additionally, the created analytics reports are equally relevant to
all involved stakeholders revealing the effectiveness and impact of digital signs on individuals.
Automated Use of Analytics Data We consider the use of analytics crucial for
improv-ing viewer experience with digital signs and the displayed content. It imposes opportu-nities to use analytics insights and dynamically and automatically adjust the content
on digital signs to reflect the insights captured by, for example, providing relevant
content to the individual based on a shop purchase or the individual’s preferences. In the context of open display networks, however, a number of requirements (from
all stakeholders involved) may compete over screen real estate – making it necessary to develop appropriate systems and interfaces that support resolving such competing
requests.
In all cases, overarching analytics are required to understand that the same person caused these events, and appropriate systems and interfaces to support the feed back into the digital
sign.
1.3
Research Context
The work described in this thesis has been carried out in the context of e-Campus, the world’s largest digital signage research test-bed established in 2004 and located at the main campus of
Lancaster University in North West England [FDE12]. The e-Campus displays deployment consists of over 70 displays and a user base composed of 13,115 students, 4,515 members of staff and a number of visitors. Displays are situated at key locations across the university
campus including outdoor information displays along the main university pathway (e.g. Figure
1.2a) student accommodation colleges, departmental and office buildings (e.g. Figure1.2b), student learning areas such as the library and university-provided learning zones.
The e-Campus displays typically show a mix of static content (including
university-wide and departmental news), videos, and websites specifically developed to support public display content. Users can manage displays and content through two Web-based systems:
e-Channels [FDE12] and the Mercury App Store [Cli+14]. Both systems were designed to serve the needs of both display owners and content providers. E-Channels can be used to “create content channels – logical containers – for sharing on each other’s displays” [FDE12]. Content providers can place content items (e.g. images, videos and references to Web sites)
1.3 Research Context 7
(a)Outdoor display located at the university’s bus sta-tion showing real-time travel informasta-tion.
(b)Indoor display located inside a departmental build-ing showbuild-ing a mix of university-related news.
Figure 1.2:Typical display deployments at Lancaster University.
channels that are populated by content providers. For example, displays located in student
study zone would be subscribed to multiple channels including university-wide press news and student-facing channels. While in some cases display owners and content providers are
represented by the same entity, certain users of the system only create content such as the
University press office – similar to application stores for mobile devices. The Mercury App Store introduced the application store model in which content (both static content, videos and
Web sites) is modelled as applications to the public display domain. Content providers and
application developers can create new applications and offer these through the application store, while display owners can browse the application store and purchase content and dynamic
applications for their displays. Similar to e-Channels, display owners can further use Mercury
to manage their displays, purchase applications and add these to their displays.
The display nodes at Lancaster run Yarely, an open-source digital signage player developed
as part of multiple research projects at Lancaster [Cli+13;MCD15]. Yarely retrieves display schedules from both e-Channels and Mercury through the XML-based “Content Descriptor Set” (CDS) [Cli+13], a file consisting of content descriptions, URLs to the actual static or dynamic content, and scheduling constraints such as date and time availabilities of channels
and individual content items. In order to determine which content item to show on the display at any given point of time, Yarely uses a lottery-based scheduling component that considers
the options and restrictions specified within the CDS [MCD15]. Both the signage player and back-end components are instrumented with Pheme to capture user interactions and system performance measures – helping content creators, display owners and administrators
understand how the signage network performs, which content has been showing and how
users have interacted with the displays on campus [Mik+15].
Supporting novel forms of interactions is a unique characteristic of the e-Campus
test-bed. In 2017, the entire test-bed was extended to support personalised content through Tacita, a privacy-aware display personalisation architecture [Dav+14]. Over 45 displays have been equipped with Bluetooth Low Energy beacons to detect viewer proximity and
1.4 Contributions 8
Figure 1.3:Map and overview of e-Campus displays at Lancaster University (grey: standard e-Campus displays; red: personalisation-enabled e-Campus displays).
iOS- and Android-based smartphone devices through which they can express their preferred
content and preferences. A variety of back-end systems have been developed and deployed
to capture viewer display proximity and send dynamic messages to displays to change the content displayed to a preferred piece of content if a user is in proximity to a display.
A number of components of the e-Campus test-bed have been extended and developed in
the context of this work, including the lottery-based scheduling component [MCD15], Pheme analytics framework [Mik+15], and the new Tacita architecture to support display personali-sation [Mik+18d]. These components are therefore described in more detail throughout this thesis.
1.4
Contributions
In this thesis, we aim to provide early insights into achieving next generation digital signage analytics whilst preserving the viewers’ privacy. We present an exploration into each of the
three areas of challenge (analytics data collection,reportingandautomated use of analytics
data) providing a series of frameworks, components and techniques addressing each of the
three areas.
In particular, this thesis makes the following contributions:
C1: Data collection. New techniques for the collection of data relating to individuals’
interactions with networks of displays (i.e. across multiple displays and devices),
in-cluding privacy-preserving approaches. In particular:
1. a framework for categorising analytics data and identifying potential opportunities
for measuring the effectiveness of pervasive display deployments and the
1.4 Contributions 9
2. an analytics backend system and a set of client libraries to enable us to collect
and process display- and application-specific analytics events, e.g. analytics that originate from public display content players and interactive display applications.
3. new insights into the creation of viewer-centric analytics by capturing viewer mobility traces through techniques deployed on the client side,
4. the design and development of a system that supports the capture and processing
of viewer mobility data captured on the infrastructure side, and,
5. a novel approach to creating user-centric analytics data and providing entirely new
forms of analytics insights in a privacy-preserving way by combining real-world
analytics data with synthetic traces of viewer mobility.
C2: Reporting. Novel forms of viewer-centric reports and insights into the opportunities that emerge from leveraging existing Web analytics engines. In particular:
1. the identification and creation of novel viewer-centric analytics reports founded on the combination of traditional display-oriented analytics data and viewer mobility
traces captured through viewer-side tracking (C1.3) and generated using mobility models (C1.4),
2. a new set of example reports for novel signage networks that support the delivery
of personalised content to viewers, and
3. the identification of similarities between the Web and digital signage analytics and
the development and implementation of a mapping of events that span across both
domains – allowing us to leverage existing Web analytics engines for the creation of display-oriented analytics reports.
C3: Automated Use of Analytics Data. Novel systems that support the automated use
of analytics data on the digital sign to drive content scheduling decisions. In particular:
1. highlighting the need for novel content scheduling systems for digital signs that
are able to respond to potentially conflicting content scheduling constraints and requirements in the context of analytics-driven open pervasive display networks,
and,
2. the design and development of the first lottery scheduling system for digital signs designed to address the challenge of resolving potentially conflicting scheduling
constraints and requirements and, additionally, be able to respond to dynamic
content contextual changes from analytics systems.
C4: Evaluation and Trials. We conducted a number of large-scale and long running trials showing the technical feasibility of systems that have been built and deployed in
the context of this thesis. Concretely, we showed the feasibility of:
1.4 Contributions 10
2. the viewer-based collection of display sightings of viewers over a period of six
months as part of an in-the-wild deployment of Tacita in the context of Lancaster University,
3. the infrastructure-based collection of display sightings of viewers in the context of a large convention centre equipped with Wi-Fi location tracking capabilities, and
4. the lottery scheduling approach as part of its integration into over 60 e-Campus
displays, covering a duration of over two years and 80 million content schedules.
Findings and outcomes of this dissertation have been published in the following
peer-reviewed journals, magazines and academic conferences (in reversed chronological order):
1. Mateusz Mikusz, Peter Shaw, Nigel Davies, Sarah Clinch, Ludwig Trotter, Ivan Elhart, Marc Langheinrich, and Adrian Friday. “Experiences of Mobile Personalisation of
Pervasive Displays”. In: ACM Transactions on Computer-Human Interaction – TOCHI
(in preparation)(2018)
2. Mateusz Mikusz, Kenny Tsu Wei Choo, Rajesh Krishna Balan, Nigel Davies, and Youngki Lee. “New Challenges in Saturated Displays Environments”. In: IEEE
Pervasive Computing(2018)
3. Mateusz Mikusz, Steven Houben, Nigel Davies, Klaus Moessner, and Marc
Langhein-rich. “Raising awareness of IoT sensor deployments”. In: Living in the Internet of
Things: Cybersecurity of the IoT - 2018. Mar. 2018, pp. 1–8. DOI:10.1049/cp.2018.
0009. URL:https://ieeexplore.ieee.org/document/8379696
4. Mateusz Mikusz, Sarah Clinch, Peter Shaw, Nigel Davies, and Petteri Nurmi. “Using
Pervasive Displays to Aid Student Recall -Reflections on a Campus-Wide Trial”. In:
Proceedings of the 7th ACM International Symposium on Pervasive Displays. PerDis
’18. Munich, Germany: ACM, 2018, 6:1–6:8. ISBN: 978-1-4503-5765-4. DOI: 10. 1145/3205873.3205882. URL:http://doi.acm.org/10.1145/3205873.3205882
5. Mateusz Mikusz, Sarah Clinch, and Nigel Davies. “Design Considerations for Multi-stakeholder Display Analytics”. In: Proceedings of the 6th ACM International
Sym-posium on Pervasive Displays. PerDis ’17. Lugano, Switzerland: ACM, 2017, 18:1–
18:10. ISBN: 978-1-4503-5045-7. DOI: 10 . 1145 / 3078810 . 3078830. URL: http : //doi.acm.org/10.1145/3078810.3078830
6. Ivan Elhart, Mateusz Mikusz, Cristian Gomez Mora, Marc Langheinrich, and Nigel Davies. “Audience Monitor: An Open Source Tool for Tracking Audience Mobility in
Front of Pervasive Displays”. In: Proceedings of the 6th ACM International Symposium
on Pervasive Displays. PerDis ’17. Lugano, Switzerland: ACM, 2017, 10:1–10:8.ISBN:
1.5 Scope and Limitations 11
7. Mateusz Mikusz, Anastasios Noulas, Nigel Davies, Sarah Clinch, and Adrian Friday.
“Next Generation Physical Analytics for Digital Signage”. In: Proceedings of the 3rd
International on Workshop on Physical Analytics. WPA ’16. Singapore, Singapore:
ACM, 2016, pp. 19–24.ISBN: 978-1-4503-4328-2.DOI:10.1145/2935651.2935658.
URL:http://doi.acm.org/10.1145/2935651.2935658
8. Mateusz Mikusz, Sarah Clinch, Rachel Jones, Michael Harding, Christopher Winstanley, and Nigel Davies. “Repurposing Web Analytics to Support the IoT”. in: Computer
48.9 (Sept. 2015), pp. 42–49. ISSN: 0018-9162. DOI: 10.1109/MC.2015.260. URL: http://doi.org/10.1109/MC.2015.260
9. Mateusz Mikusz, Sarah Clinch, and Nigel Davies. “Are You Feeling Lucky?:
Lottery-based Scheduling for Public Displays”. In: Proceedings of the 4th International
Symposium on Pervasive Displays. PerDis ’15. Saarbruecken, Germany: ACM, 2015,
pp. 123–129. ISBN: 978-1-4503-3608-6. DOI: 10 . 1145 / 2757710 . 2757721. URL: http://doi.acm.org/10.1145/2757710.2757721
10. Sarah Clinch, Mateusz Mikusz, Miriam Greis, Nigel Davies, and Adrian Friday.
“Mer-cury: An Application Store for Open Display Networks”. In:Proceedings of the 2014
ACM International Joint Conference on Pervasive and Ubiquitous Computing.
Ubi-Comp ’14. Seattle, Washington: ACM, 2014, pp. 511–522. ISBN: 978-1-4503-2968-2.
DOI:10.1145/2632048.2636080. URL:http://doi.acm.org/10.1145/2632048.2636080
1.5
Scope and Limitations
The work described aims to conduct aninitial explorationof next generation digital signage
analytics in the context of the vision ofopen pervasive display networks. The vision describes
future display networks that consist of an increased number of stakeholders contributing both content and displays (openness), displays becoming embedded into public and
semi-public environments and omnipresent to viewers (pervasiveness), and displays becoming interconnected across distinct locations and deployment sites (networked). The work at hand
has been scoped particularly around the three areas of challenge regardinganalytics data
capture,reportingandautomated use of analytics data(as described in Section1.4). For each
of the areas, we provide a series of data points in the form of frameworks, components and
techniques – allowing us to gain a breadth of insights into each area. Additionally, we apply a
mixed methods approach that consists of an extensive literature review, and quantitative and qualitative analyses of long-term and in-the-wild trials.
A number of limitations exist to the work presented in this thesis including the following.
• Our work does not aim to provide comprehensive insights in each of the three areas of
challenge (i.e. data capture, reporting and automated use of analytics data) but focusses
1.6 Thesis Structure 12
• We did not aim to create a single joined-up end-to-end analytics solution for public
dis-play networks but instead provide a set of individual insights, systems and frameworks that can be combined into a common public display analytics system.
• We did not aim to create novel image processing technologies for the capture of analytics
data in the context of digital signs (e.g. for capturing gestures) but draw on existing
technologies such as Bluetooth Low Energy beacons for location tracking in order to form a foundational dataset for the generation of novel analytics reports.
• The in-the-wild studies and experiments described in this thesis have largely been
obtained in the context of the e-Campus display network and with a single deployment
in a commercial space. The digital signage testbeds are owned by single stakeholder entities who represent multiple stakeholder groups at the same time (particularly display,
space and display owners).
1.6
Thesis Structure
The structure of this thesis is as follows. Chapter 2 (Background) gives an overview of background and previous work in the broader context of analytics, and specifically in the domain of digital signage analytics. Based on the literature, we provide an analysis of the
suitability of existing work to support open pervasive display networks. Chapter3(Analytics Data Capture and Generation) provides insights into relevant analytics data that can be captured for digital signage and an exploration of the collection and generation of such data sets for
the use in new and existing analytics systems. Based on the identified data sets, Chapter4 (Reporting) outlines concrete examples of the generation and use of novel analytics reports. We demonstrate the opportunities and advantages that result from the shift toward novel
Chapter 2
Background
2.1
Overview
We begin the introduction of background and related work by describing models and
frame-works developed for the description of different interaction and engagement phases with
public displays (Section2.2). To understand better the current landscape of systems that already support the capture of digital signage analytics, we introduce in Section2.3systems that were specifically developed to collect data around digital signs (e.g. for capturing systems performance measures, content logs and the health status of displays), and that provide some
insights into the audience (e.g. their demographics and attention levels, and how they navigate
within a space). We further introduce public display applications and content (e.g. interactive applications) that enable the capture of explicit interaction events such as direct interaction
with the sign, gaze and interaction through mobile phones. To present captured data and learn
new insights from such datasets, work has been conducted into the reporting of analytical insights. Section2.4presents such previous work including historical approaches originating in Web analytics to describe user navigation patterns through association rules, statistical
reports of systems and content, and various visualisations that have been used in the context of digital signage analytics. While analytical insights are often used by display owners and
content providers to gain a better understanding about the ways viewers use displays,
addi-tional research has been conducted on automatically instrumenting displays and changing their content based on contextual events that goes beyond just simple touch events, as described
2.2 Audience Models and Metrics 14
Display
Figure 2.1:Overview of interaction zones by Vogel and Balakrishnan (redrawn from [VB04]).
2.2
Audience Models and Metrics
A number of models and frameworks have been developed for the classification and description of different phases of user interaction and engagement with public displays. Early work in
understanding interactions of viewers with public displays was published by Vogel and
Balakrishnan in 2004 – with a specific focus on displays that support both interaction from a distance using gestures and direct interaction through a touch sensors [VB04]. The authors developed theFramework for Interaction Phasesin which they identified four key interaction
phases that interactive public display systems should consider when viewers approach displays: (illustrated in Figure2.1):
Phase 1 – Ambient display: viewers are present in the vicinity of the display and notice
the display while it is following its regular content schedule (displays are in their
“neutral state” [VB04]).
Phase 2 – Implicit interaction: viewers have been detected by the system to be in the
the vicinity of the display. As a consequence, the detection of viewers leads to a change
in the content that is displayed without the viewer actively or explicitly interacting with the display.
Phase 3 – Subtle interaction: viewers “approaching the display and providing an
im-plicit cue such as pausing for a moment” [VB04]. Suchsubtle interactionsare consid-ered as a basis for a display to reveal personal and contextual information pertaining to the individual viewer.
Phase 4 – Personal interaction: viewers start explicitly interacting with the public
dis-play from a short distance through direct touch input or other appropriate input
modali-ties such as gestures.
2.2 Audience Models and Metrics 15
four (personal interaction) [VB04]. As part of the work, the authors have identified the need to facilitate each of these interaction phases dynamically for an improved viewer experience and provide appropriate content for each phase. For example, the content should change if
a viewer dwells in proximity to the screen for a certain amount of time (subtle interaction),
or if the viewer approaches the display and is close enough to perform direct interaction
(personal interaction) [VB04]. Vogel and Balakrishnan additionally discuss potential privacy
implications of users interacting with displays in public spaces. In particular, thepersonal
interactionphase imposes risks of revealing sensitive information. Whilst users can hide some
personal information displayed on the screen with their body, Vogel and Balakrishnan note
that this technique is only suitable for a certain “class of information” [VB04].
Another example of the exploration of design spaces and interaction zones in digital
signage was performed by Rogers and Brignull in 2005 [RB05] – with a specific focus on designing a system that encourages a group of viewers to start interacting with a public display and ultimately to initiate conversations within a group of viewers. The interactive display
application that Rogers and Brignull deployed allowed bystanders to share comments on a
public display through an input device installed in the vicinity of the screen. The authors observed two interaction patterns: firstly, the application quickly drew in more bystanders and
led to a “honey-pot effect” [RB05]. Secondly, people followed a typical interaction pattern in which they first moved into the honey-pot zone, and then started to queue up at the input device to start interacting with the application Rogers and Brignull. The authors further observed that
within the “virtual space” that emerged in the immediate vicinity of the display, it “became
socially acceptable to spark up conversations with others” [RB05]. The findings lead to the observation that two general interaction zones exist: a highly interactive circle around the
display which is visible through the honey-pot effect, and a low interaction zone further away
from the display.
Focusing on how passers-by and viewers approach digital signs, Michelis and Müller
developed theAudience Funnel Frameworkas a way of describing six typical viewer behaviour
and interaction phases as passers-by approach, dwell and leave the immediate vicinity of a digital sign in a public space [MM11]:
Passing by: people who are present in the immediate vicinity and view range of a display.
Viewing and reacting: people who showedinterestin the display and its content. Such
individuals are referred to as ‘viewers’.
Subtle interaction: viewers performing “something” that causes a reaction on the display
(e.g. approaching a proximity-aware display that detects the viewer and subsequently
changes the content).
Direct interaction: viewers who explicitly interact with the display and its content, e.g.
through touch or gesture.
Multiple interactions: the same viewers performingdirect interactionsmultiple times,
2.2 Audience Models and Metrics 16
Follow up actions: viewers performing additional subsequent actions upon engaging or
interacting with the screen, such as following up on the Web [MM11].
While we would expect viewers to go through these phases in chronological order, Michelis
and Müller point out this does not necessarily have to be the case [MM11]. Similar to Rogers and Brignull [RB05], Michelis and Müller based their findings on observations conducted as part of a deployment of an interactive application on a public display. In the case of Michelis
and Müller, the interactive application mirrored the passers-by virtually on the display as they walked by [MM11]. The framework describes typical ways people interact with public displays – of course, if a display does not offer direct interaction, the phases described might
differ. For example, the passing-by and viewing phases would be identical while the direct interactions phase might be interpreted differently in the context of non-interactive public
displays.
With regards to the capture and measurement of the effectiveness of advertisements through the means of digital signage, She et al. have proposed a new model for capturing and
measuring the “effectiveness of interactive display advertising” [She+14]. The model consists of three main phases in which viewers approach a display:
Attraction: potential viewers becoming aware of a public display in their vicinity, e.g.
by spotting its presence or walking by.
Interaction: viewers actively interacting with a display and its content, e.g. through touch
or gestures.
Conation: viewers performinganyactions after interacting with a display.
She et al. defined the “effectiveness” measure of an advertising campaign using public
displays as the ratio of the number of viewers of an advert, and the number of people who
followed up after theconationphase [She+14] which can be compared to thefollow up actions
phase from the Audience Funnel Framework [MM11]. The model developed by She et al. emphasises the importance of considering each of the three phases during the development
and deployment of content for public displays – in this case for advertisements.
The knowledge of interaction phases and zones, and the understanding of how viewers
approach digital signs are being used to implement novel applications that dynamically react
to the presence of viewers depending on the interaction zone a viewer has entered. Ballendat, Marquardt, and Greenberg developed theProxemic Interactionsmodel which, in addition
to the proximity of the user to the display, also considers their identity, orientation and movement [BMG10] and builds on top of the interaction transition approach developed by Vogel and Balakrishnan [VB04]. A further publication elaborated on the Proxemic Interactions model and described it as a basis for “the new Ubicomp” [Gre+11]. As part of the model, Greenberg et al. have identified five “dimensions” of relevance for the support of
![Table 4.2: Ranking of public displays at Lancaster University based on display personalisation requestsfrom Tacita throughout the lifetime of the service (initially published in [Mik+18d]).](https://thumb-us.123doks.com/thumbv2/123dok_us/9304113.431596/108.595.106.515.152.713/ranking-displays-lancaster-university-personalisation-requestsfrom-initially-published.webp)
![Figure 4.4: Cumulative distribution function of frequencies of content views for the three syntheticanalytics mobility models (initially published in [Mik+16]).](https://thumb-us.123doks.com/thumbv2/123dok_us/9304113.431596/111.595.137.476.88.338/cumulative-distribution-function-frequencies-syntheticanalytics-mobility-initially-published.webp)
![Figure 4.5: Number of total requests per Tacita application per day (initially published in [Mik+18d]).](https://thumb-us.123doks.com/thumbv2/123dok_us/9304113.431596/112.595.133.481.82.394/figure-number-total-requests-tacita-application-initially-published.webp)
![Figure 4.6: Number of unique users per Tacita application per day (initially published in [Mik+18d]).](https://thumb-us.123doks.com/thumbv2/123dok_us/9304113.431596/113.595.136.482.238.552/figure-number-unique-users-tacita-application-initially-published.webp)
![Figure 4.7: Total number of unique users per Tacita application (initially published in [Mik+18d]).](https://thumb-us.123doks.com/thumbv2/123dok_us/9304113.431596/114.595.159.463.107.323/figure-total-number-unique-tacita-application-initially-published.webp)
