Remotely Sensed Image Segmentation using Multiphase
Level-Set ACM
Kriti Bajpai
M. Tech Student,
Department of Computer Science Engineering, Gyan Ganga Institute of Technology & Sciences,
Jabalpur (MP)
Rishi Soni
Assistant Professor,
Department of Computer Science Engineering, Gyan Ganga Institute of Technology & Sciences,
Jabalpur (MP)
ABSTRACT
In remote sensing image analysis, segmentation of an image is an important aspect. It classifies similar pixels within the image. Image Segmentation is helpful in analyzing the patterns, objects, and edges within an image. There are many ways for performing image segmentation. In this paper, we are segmenting a satellite image using Multiphase Chan-Vese model. Chan-Vese models are based on ‘Active Contours without edges’. Active contour model is also known as Snake and Energy-Based Model, which is finding local minima in the equivalent energy function. Chan-Vese model gives effective results of segmented image. The multiphase level set construction is mechanized to avoid the drawback of overlap and vacuum; it can also signify edges with convoluted topologies. Researchers conclude in this paper with the findings that the multiphase CV method can give a sensible segmented image of satellite imagery with 2D-DWT, when they manipulate Heaviside function.
Keywords
Remote Sensing, Satellite Imagery, Image Enhancement, Segmentation, ACM, multiphase Chan-Vese method.
1.
INTRODUCTION
Image segmentation is the problematic condition of partitioning an image into various subgroups, where each subgroup may have a different classification in terms of color, intensity, texture, and other features. Segmentation is an essential domain of image processing, and it plays a major role in object recognition, tracking, and computer vision. The segmentation of remote-sensing images is done to overcome the drawbacks of satellite images. These drawbacks are,
overlapping of shadows because of buildings, trees, and mountains,
a level of noise which is high in an original image, variation of the small region due to construction, And the most important, the atmosphere of the Earth. To identify these drawbacks, researchers are implementing, ‘Active Contour Method without edges’. Active Contour Models (ACMs) create an influential energy-based minimization framework for image segmentation, which has been sure about the approximation to the idea of contour progress. Starting from an initial predict, the contour is evolved with the aim of approximation to get better result for the actual object boundaries.
2.
LITRATURE REVIEW
V.Day, Y.Zhang and M. Zhong proposed a research paper titled as, "A review on Image Segmentation Techniques with Remote Sensing perspective ". This paper is a brief review about Image segmentation research work done until 2010. Image Segmentation is usually defined as the method of grouping the
pixels into homogeneous groups, where such groups belong to a particular region (Pal and Pal 1993) [1].
The research paper titled as “The Snakes: Active Contour Model” was introduced by three scholars, Kass, Witkin, and Trezopoulos in 1988. Snake is an energy-minimizing strip which is navigated by external constraint forces and controlled by image forces that drag it towards the characteristics such as objects and edges. The Snakes model blocks the energy and encircles the object to segment it (Michael Kass, 1988) [2]. The research paper titled as, “Active Contour without Edges” was proposed by Tony F.Chan and Luminita A. Vese in 2001. In this paper, the researchers have applied Momford-Shah function and level-sets Segmentation function. The Chan-vese method is based on curve evolution to detect the objects within an image. In CV model, boundaries are not essential to be defined by the gradient as required in classic Snakes model. Its initial curvature can be positioned anywhere within an image; and it automatically detects the internal contour and starts evolving curve towards the boundaries [3].
A research paper titled as, "A Multiphase Level Set Framework for Image segmentation using the Mumford and Shah Model" was also introduced by Tony F.Chan and Luminita A Vese [4]. In this paper, they have taken reference from previous research work, titled as, "Optimal approximation by piecewise smooth functions and associated vibrational problems" which was introduced by Mumford D. and Shah, J. in 1989 [5]. A multiphase level set framework for image segmentation is a generalized method of Active contour without edges which is based on two-phase segmentation. The two-phase segmentation method was introduced by M.Nilsen in Scale-Space’99 which is modified in "Riemannian Drums, Anisotropic Curve Evolution and Segmentation" the work proposed by Shah J. [6] In Chan-Vese 2002 paper, the multiphase level set formulation is technically avoiding the issue of overlap and vacuum. A piecewise smooth case is a two-level set function, which is based on Four-color theorem (Gonthier,2008) [7] to represent any segmented object. The numeric approximation implementation of the level set method which is automatically detecting interior contour was proposed by the authors, Osher and Sethian in 1998 with the paper titled as, “Fronts propagating with curvature-dependent speed: Algorithms based on Hamilton-Jacobi formulation" [8]. Another related research work was proposed on use of Level set formulation by authors Osher S., and Fedkiw, in 2001 titled as "Level set methods: An overview and some recent results" [9].
3.
ACTIVE CONTOUR MODEL
Active contour model was proposed in 1987 by Kass, which is also known as the Snakes model. Active contour has become very popular in computer vision fields such as Image segmentation, Edge extraction, 3D reconstruction, and Motion tracking. Fundamental Snake model is an organized stable connection under the impact of image forces. There are two types of Image forces: Internal Energy and External Constraint. These image forces drive the snake to relevant image features such as edges, boundaries and independent contour.
Active contour, also known as “Evolving Front”, is denoted by a contour C which moves in the inside area of the image. The contour grows and is distorted with a set of minimizing /maximized procedures. This method is known as “Contour Evolution”. The segmentation of image is done via ACM by the fitting curve that is attracted towards the edge; i.e. it is directed by the minimization or maximization of the contour region by energy functional.
Active Contour Models (ACMs) usually deal with the image segmentation problem as a functional optimization problem. They try to divide an image into several regions by optimizing a suitable functional. Starting from an initialization of contour, the optimization is performed through an iterative method, evolving the contour with the purpose of approximation to get an actual edge via proper subgrouping the image pixels [3].
To achieve an active contour, there are primarily two methods in use. The first one is Lagrangian method; its effects are visualized as parametric active contours, also known as Snakes. The second one is Eulerian method, whose outcomes are visualized as geometric active contours, which is known as level set method. Fundamental Snake model is an organized stable connection under the impact of image forces. There are two types of Image forces: Internal Energy and External Constraint. [2]Demonstration of Fundamental Snake arrangement parameters are , Now, the energy functional is:
(1) where Eint symbolize the internal energy of the fitting line
towards flexible edges, Eimage provides growth to the image
forces, and Eext provides growth to the external constraint forces.
Expressions of ACM:
Suppose Ω is encircled by open subset 2, within ∂Ω.
In given image, , which has a standardized curve
.
The classic energy function of Snake Model S1(C) is:
(2)
Where , and are the positive constraints, and control the smoothness of the contour which belongs to the internal
energy which magnetize the contour towards the object within an image which belongs to the external constraint.
The edge finder is expressed by an optimistic reducing function ‘ ’, which depends on the gradient of the image u0, as:
For example,
Here, * u0, is an smooth form of u0, it is representing the
convolution of the image u0, for Gaussian
. The positive region of homogeneous function
is , its initial value is zero at the boundaries.
The curve is denoted indirectly by a Lipschitz function , through , and growth of the curvature is presented by the zero-level arc at time of the function .Evolving the curvature in standard way for momentum of
where F is the energy function; to explain this formulation, the Partial Differential Equation is
Here, the initial contour is described as a set:
.The mean of curvature is the actual case of momentum, when
it is a special case of scheme by level-curve passing though .
Now the equation turns to be
(5)
Snakes model are based on the mean of curvature evolution. It is represented by following equation:
(6)
3.1
Chan-Vese Model
The emerging curvature in , as the edge of an open subset of Ω ( , and ).Where, is denoted by and
is denoted by the region Ω\ [4]
This method belongs to the minimization of energy based segmentation. In this method, they assume that the image is designed by two regions which are formed approximately by piecewise constant forces. The regions are represented as
, where is the inside object of the curvature
and is the outside object of the curvature . The fitting term of the Curvature is:
Here is any other variable of curvature, and the constants , are to be contingent on , the averages of inside and correspondingly outside . The edges of the entity are minimized by a fitting term:
(8) In ACM, they minimize the fitting term and add approximate standardizing terms, such as length of the curvature , and the range of the region inside . Thus, the energy function is defined as:
(9)
Here, are static constraints. For numeric calculation =1 and .
Hence, the minimization problem of curvature of fitting is:
A generalize way to represent the length of curvature is
, From the edge function Equation (29) Length of Curvature is where . A random dimension N>1 that is represents the .
Now the length of curvature is:
And the inside area of curvature is:
(10)
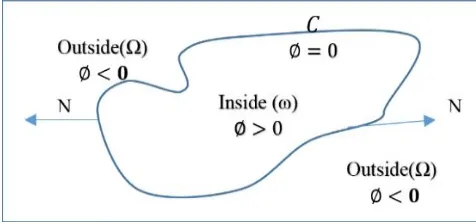
[image:3.595.53.291.585.697.2]Where c is a constant which depends on the value of N, where N executes randomly in the normal direction.
Fig 1: Curve C={(x,y): (x,y)=0} circulation in normal direction.
3.1.1
Mumford-Shah Functional:
This method is an energy based image segmentation method which was formulated by Mumford-Shah. It can be expressed via
ideal piecewise smooth calculation where an examined image is
which is disintegrated for smooth region of and optimal piecewise smooth calculation of to . Here, varies with every disintegrated function across the edges within an image [11].
The actual Mumford-Shah function or Energy function is
(11)
Where u = constant (ci) for each connected component and ci
=average ( ) for each element that is associated with . This process is known as minimal partition problem by Mumford Shah.
The finest approximation of u of is functioned as:
With the curvature C of the image u0.
It can get finer by the Level Set function where represents the zero level set of the contour.
Now, by the Lipschitz function , So,
For the variation of active contour model, the level set function is generating the Heaviside function H [10], which is measured by
. The final formulation is
Then,
In terms of energy, the Heaviside function is described as
(13)
(14)
In short, they can write the minimal partition problem of level set formula as
(16) When the constant and have no values as:
Previously, the energy function were defined as the Heaviside function ; Chen-vese reintroduced the energy function kappa for the open subset which belongs to the inside region. It is denoted as Kappa . Now the energy function ) for Kappa in new version is given as:
In Chan-vese model, is the level set function which is used to represent the curvature. For the numerical advantages, they compute and associate the above equations with Euler-Lagrange equation which is symbolized by for the unknown curve . Hence, H and are represented as and where For advance approximation, the energy function with Epsilon , the normalized energy function formulization is given as:
The normalized function of H by function is composed by
(19)
3.1.2
Multiphase Chan-Vese Model:
In this work, they have focused on Mumford-Shah Piecewise-Smooth Case for multiphase model (max 4 phase) which is based on four color theorem. [4]
As we know, C is the curvature of image u, so Chan-vase proposed the multi-phase function for C; these functions are u+ and u- .So
Thus, two dimensional constraints for function u is given as:
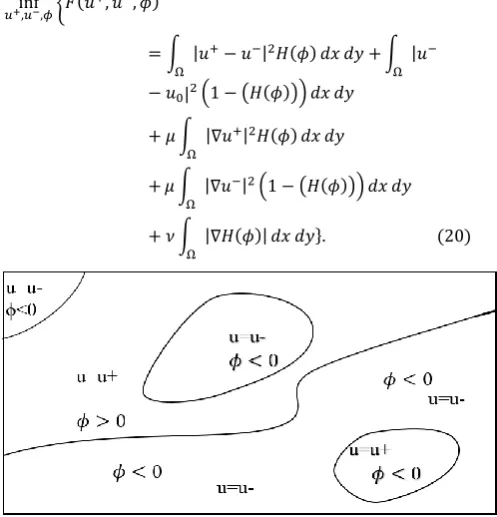
the edges of an image sets as { }. The representation of this function is well-defined in figure 2. The energy function with respect to :
[image:4.595.304.553.324.583.2]
Fig 2: The subset of image u in region with boundaries by a single level set( ϕ=0) function and smooth value function u+
and u-
Subsequently, 2D model with four phase is used which is based on four colour theorem. It colors the region after segmentation in four colors. Researchers can identify the colors by tracking these sets:{ ,{
and the edges of the region after the segmentation is formed by the set of curvature as C=
.
Previously, only two functions were produced; but in this case, the function u produces four functions for subgrouping of the image pixels with respect to image intensity. These functions are
Thus, two dimensional constraints for function for each four phase is
these representations are well-defined in figure 3.
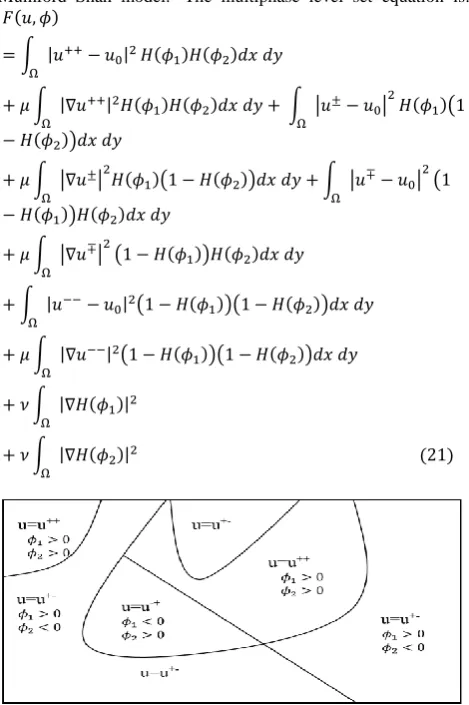
They consider symbol =( ,to introduce the new formulation; which is a multiphase level set equation based on Mumford Shah model. The multiphase level set equation is:
[image:5.595.308.556.90.315.2]
[image:5.595.55.290.210.563.2]
Fig 3: The subset of image u in region with boundaries by a single level set( ϕ_1=0) (ϕ_2=0)function and smooth value function u++, u+-,u-+and u—of all adjacent of curvature.
Table 1 List of Parameter
S.No. Parameter Description
1 Open subset
2 Image
3 Curvature
4 Energy Function
5 Level set function
6 0 Initial level set function
7 Edge Function
8
Initial contour
9 Level set Function for inside
contour
4.
METHODOLOGY
Fig 4: Process Diagram of followed method
4.1
Preprocessing
Researchers have taken the image data from QuickBird open source satellite imagery They have explored the satellite imagery that belongs to Kolkata city, West Bengal 02NOV21044347-M2AS_R1C1000000185940_01_P001.TIF for the advance process. In the direction of examining an enormous image, they have used ENVI 5.0 software [12]. It provides the GUI platform to generate the panchromatic data and clip the data to make our own data set from imagery, because the original image is difficult to read in MATLAB 9.2
Fig 5: ENVI GUI
4.1.1
Image Fusion
[image:5.595.308.530.463.630.2]Fig 5: Image Fusion
Clip 1: Eden garden & Hooghly River
Clip 2: Eden Garden
4.1.2
Image Enhancement
The Image enhancement technique doesn't boost the natural knowledge and scope of the data; it generates the dynamic scope of the selected properties that can be discovered effortlessly In this paper, Researchers are implementing two dimensional discrete wavelet transform to understand the effect of multiphase chan-vase model in satellite imagery [13].
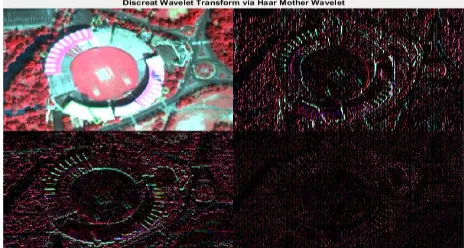
To implement 2D DWT, they have used Haar Mother Wavelet. It is a bipolar phase function. The expression of Haar wavelet is specified as an outcome of:
(22)
The 2D-DWT improves the resolution of an image. It increases the intensity or illumination of panchromatic image. [14]
Fig 6 : 2D-DWT via Haar mother Wavelet
Fig 7: Image Enhancement -2D Discrete Wavelet Transform via Haar Mother Wavelet
Fig 8: Proposed Method
4.2
Proposed Method
First, they are transforming the multispectral image into fusion image via wavelet fusion to obtain a panchromatic image. After this, they improve the image quality by image enhancement technique. There are various techniques, which can enhance the image attributes. In this paper, they have used Discrete Wavelet Transform to enhance a panchromatic image attributes (figure 7,8). For segmentation of an image, they have implemented Multiphase Chan-Vase method. To get more effective result, researchers are manipulating the Heaviside function equation [10] for improving the segmentation and get fine edges. The proposed formulation of Heaviside function is
(23)
In this formulation researchers are modified the equation no. 19, They reduce the size of angle 90 to 45 and sin π is replaced by and multiplied by 2.
[image:6.595.63.398.65.370.2]After image enhancement, they take DWT image as an input for the process of segmentation [15]. Then, they set Contour Mask, i.e. whole mask. This mask is an inbuilt mask of the Chan-Vese method and its radius is 9pixel of an image. Now, initializing the number of iterations, which run 2000 times to get a better resultant. Inbuilt µ is 0.2, which they changed to 0.02, and other numeric values of Chan-vase are used as it is. Finally, researchers was applyed the method, which is: Multiphase Chan-Vese method.
Table 2 Numeric values of Parameters
S. No. Parameter Values
1 Contour Radius (whole mask)
9 Given
2 Epsilon 10-5 default
3 Mu(µ)(weight of length term)
0.02 Given 4 Nu(ν)(weight of length
term after re-initialization)
0.02 Default
5 Phi (π) after
re-initialization
0.6 Default
6 Iteration 2000 Given
.
.
.
Image Fusion
• Panchromatric Image
Image Enhancement
• 2D Discrete Wavelet Transform
Image Segmentation
[image:6.595.304.538.70.165.2] [image:6.595.54.286.596.720.2] [image:6.595.298.550.644.768.2]5.
RESULT AND ANALYSIS
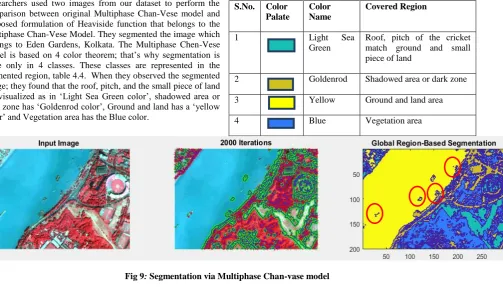
[image:7.595.53.574.75.645.2]Researchers used two images from our dataset to perform the comparison between original Multiphase Chan-Vese model and Proposed formulation of Heaviside function that belongs to the Multiphase Chan-Vese Model. They segmented the image which belongs to Eden Gardens, Kolkata. The Multiphase Chen-Vese model is based on 4 color theorem; that’s why segmentation is done only in 4 classes. These classes are represented in the segmented region, table 4.4. When they observed the segmented image; they found that the roof, pitch, and the small piece of land are visualized as in ‘Light Sea Green color’, shadowed area or dark zone has ‘Goldenrod color’, Ground and land has a ‘yellow color’ and Vegetation area has the Blue color.
Table 3 Segmented Region colors
S.No. Color Palate
Color Name
Covered Region
1 Light Sea
Green
Roof, pitch of the cricket match ground and small piece of land
2 Goldenrod Shadowed area or dark zone
3 Yellow Ground and land area
4 Blue Vegetation area
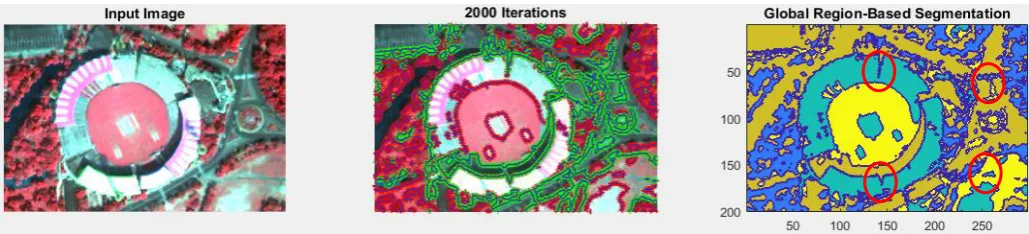
Fig 9: Segmentation via Multiphase Chan-vase model
Fig 10: Segmentation via Proposed Formulation of Heaviside Function
[image:7.595.70.574.92.379.2] [image:7.595.53.583.530.651.2]Fig 12: Segmentation via Proposed Formulation of Heaviside Function
Satellite images have many entities such as Buildings, Water-bodies, River, Vegetation area, Roads, Boats, etc. which we can see in Clip 1(Eden gardens & Hooghly River). These entities overlap some small objects during the segmentation process. This is the reason why researchers took another clip by zooming on the satellite imagery. They only zoom on the imagery until its pixels are not distorted nor blur.
The resultant of the segmented image (figure 13) is more clearly visible than the original (figure 12) multiphase Chan-Vase model. They circled some objects to justify their statement that the multiphase Chan-Vase formulation of Heaviside function result is more fine and sharp in comparison to the original multiphase Chan-Vase Model.
6.
CONCLUSION & FUTURE WORK
In the application area of Satellite Image Enhancement; resolution of the images is not the only problem. We also face equivalent geographical issues such as weather, cloud, fog, and sunlight. They form shadow or a dark zone within the image which eventually changes with time and atmosphere. That’s the reason researchers found similar images with minor variations. In the end, they visualized and examined the image attribute, where the result of enhancement depends on specific needs of the image Analyst. Identifying the real object and virtual object from the image is the actual purpose of image enhancement. Our work makes a vision to recognize the effective technique for advance executions like segmentation and classification etc. They are tried to cover most of the techniques that are used to enhance the image quality and its attributes.Satellite images have various kinds of objects with different intensity levels. Multiphase CV method is based on four color theorem, which means our approach can fine the edges during segmentation but it makes only four classes to summarize subgroups of pixels of the images. Still, researchers improved the results to some extent. They succeeded in grouping the boundaries of the object of satellite images and obtained absolutely fine and smooth results.
6.1
Future Work
All of these techniques help us to segment the image data and classify image information. This will help us in the future to get more information about the elements present in the Earth and to predict the continuous changes over the Earth. In future, it can be used for better characterization to generate understandable information present in imagery. It can also be used in monitoring and evaluation of the Earth environment.
Also in future, researchers can increase the number of classes for sub grouping of pixels, which will make segmentation even more justified. After more study and manipulation, they can train this method to improve segmentation. This can also help us to
classify the satellite imagery in its purest form; then they can define trees, water bodies, buildings, and shadows, etc. in more effective way.
7.
REFERENCES
[1] Y. Z. ,. M. Z. V. Dey, "A REVIEW ON IMAGE SEGMENTATION TECHNIQUES WITH REMOTE SENSING PERSPECTIVE," ISPRS,, vol. 38, no. 7, pp. 1-12, 2010.
A. W. a. D. T. Michael Kass, "Snakes: Active contour models," International Journal of Computer vision, vol. 1, no. 4, pp. 321-331, January 1988.
[2] L. A. V. Tony F. Chan, "Active contours without edges," IEEE Transactions on Image Processing, vol. 10, no. 2, pp. 266 - 277, Feb 2001 .
[3] T. F. C. Luminita A. Vese, "A Multiphase Level Set Framework for Image Segmentation Using the Mumford and Shah Model," International Journal of Computer Vision, vol. 50, no. 3, p. 271–293, December 2002.
[4] J. S. David Mumford, "Optimal approximations by piecewise smooth functions and associated variational problems," Communications on Pure and Applied Mathematics, July 1989.
[5] J. Shah, "Riemannian Drums, Anisotropic Curve Evolution and Segmentation," International Conference on Scale-Space Theories in Computer Vision, vol. 1682, pp. 129-140, 12 April 2002.
[6] G. Gonthier, "Formal Proof—The Four Color Theorem," AMS, December 2008. [Online]. Available: http://www.ams.org/notices/200811/tx081101382p.pdf. [7] J. A. S. STANLEY OSHER, "Fronts Propagating with
Curvature- Dependent Speed: Algorithms Based on Hamilton-Jacobi Formulations," JOURNAL OF COMPUTATIONAL PHYSICS, vol. 79, no. 1, pp. 12-49, 1988.
[8] R. P. F. Stanley Osher, "Level set methods: An overview and some recent results.," Journal of Computational Physics, vol. 169, no. 2, pp. 463 - 502, 30 May 2001.
[9] E. W. Weisstein, "Heaviside Step Function.," MathWorld--A Wolfram Web Resource, [Online]. Available: http://mathworld.wolfram.com/HeavisideStepFunction.html. [10]J. Shah, "A common framework for curve evolution, segmentation and anisotropic diffusion," in Computer Vision and Pattern Recognition, 1996. Proceedings CVPR '96, 1996 IEEE Computer Society Conference, San Francisco, CA, USA,, 18-20 June 1996.
[image:8.595.55.570.70.187.2][12]R. S. Kriti Bajpai, "Analysis of Image Enhancement Techniques Used in Remote Sensing Satellite Imagery," International Journal of Computer Application, vol. 169, no. 10, pp. 1-11, 20 July 2017.
[13]A. P. Unni, "Satellite Image Enhancement Using 2D Level DWT," International Journal of Engineering Research &
Technology (IJERT), vol. 3, no. 3, pp. 1926-1929, March 2014.