RESEARCH ARTICLE
CONSUMPTION PATTERN OF BITTER GOURD (Momordica charantia L.) AMONG TYPE II
DIABETICS
1
Amirthaveni, M.,
1Premakumari, S.,
*,1Gomathi, K. and
2Yang, R. Y.
1
Department of Food Science and Nutrition, Avinashilingam University, Coimbatore-43
2
AVRDC- The World Vegetable Center, Taiwan
ARTICLE INFO ABSTRACT
India is considered as the diabetes capital of the world with 41 million Indians having diabetes. Socioeconomic environment influences occupation, lifestyle, and nutrition of social classes which in turn would influence the prevalence and profile of glucose intolerance and diabetic complications. Even today, about 80 per cent of the population in developing countries depends on traditional medicine, Bitter Melon is one of the traditional medicine which is a good source of phenolic compounds. It is evidenced reported that only 58.7 per cent of the subjects generally believed that bittergourd is good for health, 27.3 per cent reported bittergourd decreases the sugar level and a few (5.3 5) members informed that it reduces the stomach infection.
Copyright, IJCR, 2013, Academic Journals. All rights reserved.
INTRODUCTION
The global prevalence of diabetes is estimated to increase, from 4 per cent in 1995 to 5.4 per cent by the year 2025. India is considered as the diabetes capital of the world with 41 million Indians having diabetes. Every fifth diabetic in the world is an Indian (Joshi and Parikh, 2007). Epidemiological studies conducted in India, showed that not only the prevalence was high in urban India but it was also increasing (Ramachandran, 2007) (Mohan et al., 2003). Socioeconomic environment influences occupation, lifestyle, and nutrition of social classes which in turn would influence the prevalence and profile of glucose intolerance and diabetic complications (Smith et al., 2011). Even today, about 80 per cent of the population in developing countries depends on traditional medicine, Bitter Melon is one of the traditional medicine which is a good source of phenolic compounds. Therefore, these natural plant phenolics can be a good source of biologically active compounds that may be applied in many food systems to enhance food values and special nutritional qualities. However studies are needed using more genetically diverse varieties to pin point the bioactive and functional compounds and their physiological properties (Islam, et al., 2011). A wider spectrum of assessing the usage pattern of bitter gourd is the essential primary step to proceed with the laboratory and clinical trials. Hence the present study was undertaken with the following objectives.
Elicit data on demographic profile, lifestyle pattern, personal and family history of diabetic subjects
Obtain details on consumption of bitter gourd among diabetics
Find out the awareness and usage of bitter gourd among selected health workers
*Corresponding author:goms.fsn@gmail.com
MATERIALS AND METHODS
A group of 150 diabetics, both male and female above the age of 25 years diagnosed clinically and biochemically to have diabetes mellitus were selected for the present study from diabetic clinics in around Coimbatore District, Tamil Nadu. Information regarding the socio-demographic and dietary profile of the selected subjects were collected through administering interview method by a pre-tested questionnaire. The relevant data on family and personal diabetic history of the subjects were recorded. Awareness about the control and management of diabetes, consumption of functional foods like bitter gourd and other vegetables was noted. Anthropometric measurements namely height and weight were recored and BMI was calculated for all the subjects. Pre, post prandial blood glucose levels and glycosylated haemoglobin levels at the time of personal interview were noted from the medical reports of the 150 diabetics.
RESULTS AND DISCUSSION
Socio Economic Status
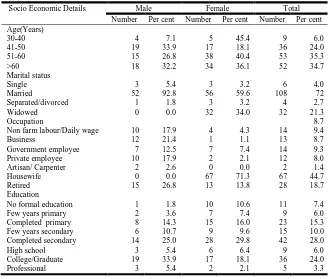
Socio-economic status and its constituent elements are accepted as being determinants of health. Certain risk factors implicated in the development of diabetes are also known to be associated with socioeconomic status.The socio economic factors like age, gender, marital state, occupation and education of the 150 diabetic subjects are given in ( Smith, et al., 2011)Table 1.
Type 2 diabetes is associated with older age and an important risk factor for diabetes. From the Table it is apparent that out of 150 subjects surveyed, majority (62.7 %) were female followed by male (37.3 %). The prevalence of diabetes was at higher range (35.3 %) in the age group of 51- 60 years and it is almost same (34.7 %) among above 60 years old. The data indicates that after 40 years people
ISSN: 0975-833X
International Journal of Current Research Vol. 5, Issue, 03, pp.456-460, March, 2013
INTERNATIONAL JOURNAL
OF CURRENT RESEARCH
Article History:
Received 28th December, 2012
Received in revised form 06th January, 2013
Accepted 14th February, 2013
Published online 19th March, 2013
Key words:
Socioeconomic environment,
Diabetes, Traditional medicine,
start catching diabetes and the maximum occurrence taken place at 50-60 years and thereafter. Among the selected diabetics majority of the male (92.9 %) and among the female 59.6 per cent married and 34 per cent were widowed. The data reflect that with regard to occupation majority of the male were retired (26.8 %) followed by business sector (21.4 %) and majority of the female were housewives (71.3 %). Among the surveyed diabetics, female diabetics were educated compared to male diabetics and 28 per cent had completed secondary level. In the present study it can be noted that 33.9 per cent of male and 18.1 per cent female were graduates and only 7.3 per cent were illiterates.
Religion
Among the 150 selected diabetic subjects, 83.9 and 88.3 per cent of male and female belonged to Hinduism while 14.3 and 8.5 per cent of the male and female were Christians and only a minimum of 1.8 and 3.2 per cent of the male and female followed Islamic religion.
Income levels
The income levels of the diabetics is depicted in Figure 1. The prevalence of diabetes, appears directly related to urbanization, rise in income levels and consequent change in lifestyle. The total prevalence was found to be highest in Chandigarh at 13.6 per cent of the population, and both urban and rural prevalence rates were found to be high, at 14.2 and 8.3 per cent respectively. Tamil Nadu was second in total prevalence with 10.4 per cent of the population suffering from it (Pallavi, 2011). Diabetes has been generally considered a disease of the rich and affluent. This study was also in par with the above study. About 34 per cent of the diabetics belongs to high income group followed by 31.7 per cent in middle income and only 20 per cent of the diabetics were in economically week section. The highest prevalence of Type 2 diabetes in developing
[image:2.595.133.461.71.350.2]countries occurs in the higher socio-economic groups and this is also true for the Indian population. The research conducted by Boddula et al., (2008) on 1,112 affluent adult Indian subjects found the prevalence of Type 2 diabetes to be 21.1 per cent the highest prevalence of Type 2 diabetes reported from within India to date.
Fig.1. Income level of the diabetic subjects
Mean Weight, Height and BMI
Table 2. reveals the mean weight, height and BMI of the selected diabetics
[image:2.595.314.533.423.512.2]It is clear that overweight was predominant among the diabetic subjects. The mean height of the diabetic male and female were lower than the reference value by 7.9 and 7.1 cm respectively. The mean weight of the diabetic male and female were 70.09 and 64.6 kg which were well above to the standard reference weight as recommended by the ICMR (2010) conforming even modest changes in weight was associated with substantial increase in diabetes risk (Boddula et al., 2008).Mean Body Mass Index determined for the diabetic male and female were 25.84 and 27.34 respectively which shows that they were in preobese category which is also associated
Table 2. Mean Anthropometric Measurements of the Diabetics
Anthropometric measurements
Male Fe male
Reference value * Mean ±SD Excess/ Deficit Reference value * Mean ±SD Excess/ Deficit
Height ( cm) 173 165.1±10. - 7.9 161 153.9±7.7 -7.1
Weight (Kg) 60 70.09±10.9 + 10.1 55 64.60±11.5 +9.6
BMI 20.3 25.84±4.3 + 5.5 21.2 27.34 ±5.1 +6.1
* ( ICMR 2010) (Nerurkar et al., 2010).
Table 1. Socio Economic Details of the Diabetic Subjects
Socio Economic Details
Male Female Total
Number Per cent Number Per cent Number Per cent
Age(Years)
30-40 4 7.1 5 45.4 9 6.0
41-50 19 33.9 17 18.1 36 24.0
51-60 15 26.8 38 40.4 53 35.3
>60 18 32.2 34 36.1 52 34.7
Marital status
Single 3 5.4 3 3.2 6 4.0
Married 52 92.8 56 59.6 108 72
Separated/divorced 1 1.8 3 3.2 4 2.7
Widowed 0 0.0 32 34.0 32 21.3
Occupation 8.7
Non farm labour/Daily wage 10 17.9 4 4.3 14 9.4
Business 12 21.4 1 1.1 13 8.7
Government employee 7 12.5 7 7.4 14 9.3
Private employee 10 17.9 2 2.1 12 8.0
Artisan/ Carpenter 2 2.6 0 0.0 2 1.4
Housewife 0 0.0 67 71.3 67 44.7
Retired 15 26.8 13 13.8 28 18.7
Education
No formal education 1 1.8 10 10.6 11 7.4
Few years primary 2 3.6 7 7.4 9 6.0
Completed primary 8 14.3 15 16.0 23 15.3
Few years secondary 6 10.7 9 9.6 15 10.0
Completed secondary 14 25.0 28 29.8 42 28.0
High school 3 5.4 6 6.4 9 6.0
College/Graduate 19 33.9 17 18.1 36 24.0
[image:2.595.55.521.556.611.2]with increased risk of diabetes. Mean BMI value of the selected female diabetics was greater than that of male.
Classification of Diabetics According to BMI
[image:3.595.40.280.139.338.2]BMI of the selected subjects computed were classified according to WHO (2004) classification and presented in Figure 2.
Fig. 2. Classification of Diabetics According to BMI
An increase in body fat is generally associated with an increase in risk of metabolic diseases such as type 2 diabetes mellitus (WHO, 2007) (Banerjee et al., 2004).The above Table revealed that higher per cent (44.7) of the diabetics were in pre obese class. Individuals in the upper normal-weight and slightly overweight BMI range have a relatively high prevalence and are at increased risk of having the metabolic syndrome. Therefore, screening in individuals with normal or slightly elevated BMI is important in the prevention of diabetes and cardiovascular disease (WHO, 2012). About 36.7 per cent of the diabetics were in the normal range, whereas 11.3 per cent were in grade I obesity. Only minimum (2 and 0.7 %) per cent of the diabetics were in the underweight category of moderate and mild thinness.
Mean Biochemical Parameters
Table 3. Depicts the mean biochemical parameters of the selected diabetics
Elevated blood glucose at all times was the commonest finding in type 2 diabetic patients. The observed patterns of mean fasting blood glucose in 94 female diabetics were especially higher (143.53 mg/dl) than 54 male diabetics (133.26) which was well above than the reference value. It is increasingly recognized that postprandial hyperglycemia is an important component of the overall glycemic burden, though there is as yet a paucity of data showing that lowering of postprandial plasma glucose (PPG) reduces risk of T2DM complications(St-Onge et al., 2004).The mean post prandial levels of the male and female subjects were 220.60 and 220.24 mg/dl. HbA1c values reflect overall glycemic exposure over the past 2-3 months and are determined by both fasting (FPG) and postprandial plasma glucose (PPG) levels (Blevins, 2011). Among the 150 surveyed diabetics the mean HbA1c levels were 8.56 per cent for female subjects and 8.12 per cent for the male subjects respectively.
The data collected revealed that 43 subjects were in the fair control category (7-8 %of HbA1C) followed by 40 diabetic subjects in the
unsatisfactory control (8-10 %) and 31 subjects were in the poor control category (>10 %) of HbA1C levels. About 36 subjects had
good control over their HbA1C level less that <5.6 per cent.
Frequency of Visit to Clinics by the Subjects
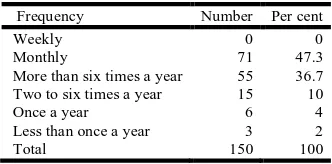
[image:3.595.352.518.180.262.2]Frequency of visit to clinics by the selected subjects is given in Table 4.
Table 4. Frequency of Visit to Clinics
Frequency Number Per cent
Weekly 0 0
Monthly 71 47.3
More than six times a year 55 36.7
Two to six times a year 15 10
Once a year 6 4
Less than once a year 3 2
Total 150 100
[image:3.595.317.555.400.470.2]The above Table reveals that the majority (47.3%) of the selected diabetics were health conscious and knew the importance of visiting the clinics regularly and visiting the clinics once in a month .Around 36.7 per cent of the selected subjects were visiting the hospitals more than six times a year. Only a minimum of 2 and 4 per cent of the diabetics were going to the hospitals occasionally and once in a year. None of the diabetics visited the doctor every week because they got their own glucometer to monitor the blood glucose levels and that was considered less expensive.
Table 5. Mean Monthly Medical Expenditure of the subjects
Expenditure details ``` Male N=56 Female N=94
Mean monthly income 18,780 12,843
Diabetes medicine 1,020 1,008
Doctor visits 229 230
Blood analysis 258 296
Mean expenditure total 1507 1534
Proportion of income spent (%) 8.02 11.94
Mean Monthly Medical Expenditure of the Subjects
Table 6. Presents the mean monthly medical expenditure of the subjects studied.
[image:3.595.126.470.561.607.2]The above Table highlights that the mean monthly income of the male and female subjects were Rs.18,780 and Rs.12,843 respectively. The mean expenditure incurred by the male and female diabetes were Rs. 1507 and Rs. 1534 respectively. About 11.94 per cent and 8.02 per cent of the income was spent towards hypoglycemic drugs, doctors fee and blood analysis by the female and male subjects respectively. Diabetes being a life-long disorder is an expensive ailment for a very large proportion of subjects in developing societies. In India the money spent was from the family’s financial resources. Although the amount spent by the upper and the lower class persons were similar, the per centage of the income spent was higher among the latter, due to their lower earning (Mohan, et al., 2003).
Table 3. Mean Biochemical Parameters of the Diabetics
Bio chemical parameters (mg/dl) Reference value * Male Mean ±SD Fe maleMean ±SD
Fasting blood sugar level ≥ 126 133.26±50.42 143.53±54.49
Post prandial blood sugar level ≥ 200 220.60±82.69 220.24±79.69
HbA1c (%) ≥ 6.5 8.12±1.84 8.56 ±1.79
Life style, Eating habits and Physical activity
Majority (70.7 %) of the type II diabetics opined that the way of their living affected their blood glucose level. A higher per centage (81.3) of the subjects stated that the eating habit and physical activity play a major role in maintaining the blood glucose level. The same percentage of the subjects changed their physical activity and 88 per cent of the subjects followed inclusion of fiber rich foods and exclusion of roots and tubers after the diagnosis of diabetes as they were aware of the principles of the diabetic diet advocated by doctors and dietitians. Twenty and 14 per cent of the subjects had no knowledge about the eating habits and physical activity in relation to blood glucose respectively. This might be due in part to a lack of specificity in advice, possibly arising from a lack of detailed knowledge concerning the foods and physical activity, eating habits and beliefs of these subjects. Proper education and awareness programmes have previously been shown to change the attitude of the public regarding diabetes (Woerle et al., 2007)
Details on Bitter gourd Consumption
About 137 diabetic subjects had the awareness on the health effect of bitteregourd
Health Benefits of Bitter Gourd
[image:4.595.50.274.428.491.2]Table 6. Shows the health benefit of bitter gourd as considered by the diabetics. Bitter melon has been used in various Asian traditional medicine systems for a long time. It is evidenced from the Table that 58.7 per cent of the subjects generally believed that bitter gourd is good for health, 27.3 per cent reported bitter gourd decreases the sugar level and a few (5.3 5) members informed that it reduces the stomach infection. In Ayurveda, the fruit is considered as tonic, stomachic, stimulant, emetic, antibilous, laxative and alterative (Sathish Kumar et al., 2010).
Table 6. Health Benefits of Bittergourd
Health benefits Number Per cent
Good for health 88 58.7
Blood sugar level decrease 41 27.3
Reduce stomach infection 8 5.3
Do not know 13 8.7
Total 150 100
Frequency and Quantity of Bitter gourd Consumption
One hundred and forty four subjects consuming bitter gourd and 97 subjects remove seeds before cooking and 44 subjects consuming bitter gourd with seeds. Frequency and quantity of bitter gourd consumption is presented in Table 7.
Out of 150 diabetic subjects, 36.7 and 9.3 per cent were consuming bitter gourd once in a week with the quantity of less than 100g and 100-200g respectively followed by 18.7 and 1.3 per cent of the diabetics consuming less than 100g and 100-200g of bitter gourd once in month. About 6.7 per cent of diabetics consumed less than 100g bitter gourd occasionally. Only a negligible number (5) of subjects of consumed bitter gourd on daily basis.
Form and Frequency of Bitter Gourd Consumption
Table 8. Gives the details concerning the form and frequency of bitter gourd consumption
Folk wisdom has it that bitter melon helps to prevent or counteract type-II diabetes. Oral administration of fresh fruit juice (dose, 6 c.c. /kg. body wt.) lowered the blood sugar level in normal and alloxan-diabetic rabbits (Sathish Kumar et al., 2010) Bitter melon juice is a potent inhibitor of lipogenesis and stimulator of lipolysis activity in human adipocytes and prove to be an effective complementary or alternative therapy to reduce adipogenesis in human (Sathishsekar and Subramanian, 2005). Majority of the diabetics consumed bitter gourd as curry form once in a week (56 subjects) followed by 26 subjects consuming two to three times per week and once in month. Shallow fat frying is the next popular method of cooking among diabetics, 39 subjects consumed once in a week and 17 and 14 subjects had two to three times per week and once in month respectively. Bitter gourd was consumed as fresh juice by only five and six subjects, two to three times in a week and once in a week and only one subject consume juice daily, once in a month and occasionally. Five, three and two subjects consumed deep fat fried bitter gourd in the form of chips once in a week, once in a month and occasionally respectively.
Purchase of Bitter Gourd
It is welcoming to note that among the selected diabetics 57.3 per cent procured bitter gourd freshly from the daily market. Around 38 per cent of the diabetics purchased from street venders because it is easily available at door steps. Only 2 per cent of the diabetics had bitter gourd creeper in their own garden and cultivated the fruits.
Treatment Done for the Bitter Gourd before Cooking
[image:4.595.126.478.572.660.2]As majority of the subjects prepared curry with tamarind no pre cookery was treatment done by the subjects. Few of the diabetics (5.3 and 6.7 %) soaked the cut bitter gourd bits in tamarind juice and salt water before cooking to remove bitterness. Only one member soak the bitter gourd after cutting in rice washed water and one subject left out the bits exposing to atmosphere for some time to remove bitterness.
Table 7. Frequency and Quantity of Bitetrgourd Consumption N=150
Frequency Quantitying
< 100 100-200 > 200
Number Per cent Number Per cent
Daily 5 3.3 0 0 Nil
More times a week 23 15.3 7 4.7 Nil
Once a week 55 36.7 14 9.3 Nil
Once a month 28 18.7 2 1.3 Nil
[image:4.595.65.539.682.770.2]Occationally 10 6.7 0 0 Nil
Table 8. Form and Frequency of Bitter gourd Consumption
Mode of preparation Daily 2-3 times in a week Once in a week Once in a month Occasionally Total
Raw - salad 0 0 0 1 0 1
Tea/Soup 0 0 1 0 0 1
Juice 1 5 6 1 1 14
Boiled/Cooked 0 4 7 2 0 13
Stewed 2 1 0 0 9 12
Gravy 2 26 56 26 0 110
Deep fat fried 0 0 5 3 2 10
Conclusion
The present study reveals that 10 % of the monthly income is spent towards diabetes medicine, doctor’s visit and blood testing. Majority of the diabetics consumed bitter gourd in curry form ie. less than 100 g per week. This shows that thesubjects were not aware about the frequent usage and method of preparation of bitter gourd as a remedy for diabetes. Further studies are needed to create awareness, identify the active components in bitter gourd and their mechanism in controlling diabetes.
REFERENCES
Banerjee K.P, Wang .Y, Hu B.F, Spiegelman D, C. Willett C.W, and Rimm B.E; Changes in Body Weight and Body Fat Distribution as Risk Factors for Clinical Diabetes in US Men; Am. J.
Epidemiol., 2004, Vol. 159, No. 12,Pp.1150–1159.
Blevins T. Control of postprandial glucose levels with insulin in type 2 diabetes. Postgrad Med. 2011 July 123(4) Pp.135-47. Boddula R Yadav S, Bhatia V, Genitta G, Pandey D, et al. High
prevalence of type 2 diabetes mellitus in affluent urban Indians.
Diabetes res.clin. practice, 2008, Vol.81, No.2, Pp. e4-e7.
http://diabetesinformationhub.com/WhatCausesDiabetes.php ICMR 2010, Nutrient requirements and recommended dietary
allowances for Indians, Pp 12.
Islam S, Jalaluddin .M, and Hettiarachchy S.N, Bio-active compounds of bitter melon genotypes (Momordica charantia L.) in relation to their physiological functions, Func. Fd. Heals and Diseas, 2011, Vol 2, Pp 61 of 74.
Joshi R.S, and Parikh M.R. India - Diabetes Capital of the World: Now Heading Towards Hypertension, J. Associ. Physicians Ind., May 2007, Vol. 55 , Pp323-324.
Mohan V, Shanthirani C.S and Deepa R; Chennai Urban Population Study (CUPS 14). Glucose intolerance (diabetes and IGT) in a selected south Indian population with special reference to family history, obesity and lifestyle factors - The Chennai Urban Population Study (CUPS 14). J. Associ. Physicians Ind., 2003, Vol.51, Pp 771–777.
NDEP, 2011, http://ndep.nih.gov/media/numatglance_eng-508. pdf, Updated March 2011.
Nerurkar, PV, Lee K. Y and Nerurkar R.V. Momordica charantia (bitter melon) inhibits primary human adipocyte differentiation by modulating adipogenic genes, BMC Complem. Alternative Med., 2010, Pp10:34.
Pallavi. A Issue: down to earth, web: http://www.downtoearth. org.in/content/india-s-diabetes-burden-likely-increase last date accessed: 26.12.2011 Nov 1, 2011.
Ramachandran, A Socio-Economic Burden of Diabetes in India, Supp. J. Associ. Physicians Ind.,JULY 2007,Vol. 55,Pp 9-12 Report of the Technical Group [11th Five Year Plan: 2007-12] on
Estimation of Urban Housing Shortage, Government of India, Ministry Of Housing and Urban Poverty Alleviation, Pp-13. http://mhupa.gov.in/ministry/housing/HOUSINGSHORTA GE -REPT.pdf.
Sathish Kumar. D, Sharathnath,V.K, Yogeswaran.P, Harani. A, Sudhakar.K, Sudha.Pand Banji D,A Medicinal Potency of Momordica Charantia, International Journal of Pharmaceutical
Sciences Review and Research ,Volume 1, Issue 2, March –
April 2010; Pp. 95-100 Available online at www.globalresearchonline.net.
Sathishsekar, D and Subramanian S. Antioxidant properties of Momordica Charantia (bitter gourd) seeds on Streptozotocin induced diabetic rats. Asia Pacific J. Clin. Nutri.,2005 , Vol. 14, Issue: 2, Pp. 153-158.
Smith B.T, Lynch W.J, Fox C.S, Harper S, Abrahamowicz M, Almeida D.N, and Loucks B.E, Life-Course Socioeconomic Position and Type 2 Diabetes Mellitus, The Framingham Offspring Study, Amer. J. Epid. Advance Access published January 17, 2011, Pp 1-1.
St-Onge M-P, Janssen I, Heymsfield SB: Metabolic Syndrome in Normal-Weight Americans. Diab. Care, 2004,Vol. 27, Pp.2222-2228.
W. K Maina, Z. M Ndegwa, E. W Njenga, and E. W Muchemi, Knowledge, attitude, and practices related to diabetes among community members in four provinces in Kenya: a cross-sectional study, Afri.J. Diab. Med., 15, Vol 19, No 1, May 2011,Pp 15-18.
Woerle, H.J, Neumann. C, Zschau S, Tenner. S, Irsigler. A, Schirra. J, Gerich. J.E and Göke. B.Impact of fasting and postprandial glycemia on overall glycemic control in type 2 diabetes Importance of postprandial glycemia to achieve target HbA1c levels. Diabetes Res Clin Pract. 2007 Aug; 77 (2), Pp.280-5. Epub 2007 Jan 22.
World Health Organization. Obesity and Overweight Facts. http://www.who.int/hpr/NPH/docs/gs_besity.pdf (accessed January 2012).