Studying the Interrelationship amongst the various
Barriers Faced by Oil and Gas Start-ups and
Entrepreneurs in India
Bhoomica Aggarwal
HCL Technologies Private Limited, Sector 126, Noida, India
Remica Aggarwal
MIT School of Education & Research,
MIT Art, Design & Technological University Pune, India
Anu Aggarwal
NAWADCO, Hauz Khas, Delhi, India
ABSTRACT
Oil and gas sector is amongst the eight core industries in India and plays a major role in influencing decision making for all the other important sections of economy. However this sector faces many challenges particularly for the start-ups . Present research work focuses on exploring the sector and various challenges faced by oil and gas start-ups in developing countries such as India . It further study the interrelationship amongst them using Interpretive Structural Modelling (ISM) Methodology .
Keywords
Oil and gas industry , Oil and gas start-ups , ISM
1.
INTRODUCTION
India’s economic growth is closely related to energy demand; therefore the need for oil and gas is projected to grow more, thereby making the sector quite conducive for investment. The Government of India has adopted several policies to fulfil the increasing demand. The government has allowed 100 per cent Foreign Direct Investment (FDI) in many segments of the sector, including natural gas, petroleum products, and refineries, among others. Today, it attracts both domestic and foreign investment, as attested by the presence of Reliance Industries Ltd (RIL) and Cairn India.
Energy demand of India is anticipated to grow faster than energy demand of all major economies, on the back of continuous robust economic growth. Consequently, India’s energy demand as a percentage of global energy demand is expected to rise to 11 per cent in 2040 from 5.58 per cent in 2017. Crude oil consumption is expected to grow at a CAGR of 3.60 per cent to 500 million tonnes by 2040 from 221.76 million tonnes in 2017. Natural Gas consumption is forecasted to increase at a CAGR of 4.31 per cent to 143.08 million tonnes by 2040 from 54.20 million tonnes in 2017. Globally, the demand for energy continues to be on the rise and this is especially true for India. The country is expected to be one of the largest contributors to non-OECD petroleum consumption growth globally, with the demand for energy projected to grow at 5% per annum. In 2017, India was the third largest consumer of oil in the world with consumption of 4.69 million barrels per day, and oil imports rose sharply to US$ 87.37 billion in 2017-18 from US$ 70.72 billion in 2016-17. In this backdrop, the challenge is to meet the rising demand for energy, at the same time bringing down emissions. Leveraging technology and innovation and fostering collaboration between the traditional hydrocarbon sector and innovative start-ups can play a major role in addressing this challenge. As part of an initiative to foster, nurture and
incubate new ideas from start-ups, 10 oil & gas PSUs (ONGC, OIL, IOCL, BPCL, HPCL, MRPL, GAIL, EIL, NRL and Balmer Lawrie) have earmarked a fund of Rs 300 crore to promote entrepreneurship among young Indians. The initiative aims to create an ecosystem that will enable energy start-ups with innovative technologies to grow, aided by mentoring, funding and incubation support from established oil and gas PSUs.
India is expected to be one of the largest contributors to non-OECD petroleum consumption growth globally. Oil imports rose sharply to US$ 87.37 billion in 2017-18 from US$ 70.72 billion in 2016-17. India retained its spot as the third largest consumer of oil in the world in 2017 with consumption of 4.69 mbpd of oil in 2017, compared to 4.56 mbpd in 2016. India was the fourth-largest Liquefied Natural Gas (LNG) importer in 2017 after Japan, South Korea and China. LNG imports increased to 26.11 bcm in 2017-18 from 24.48 bcm in 2016-17. Gas pipeline infrastructure in the country stood at 16,226 km at the beginning of February 2019.
According to data released by the Department of Industrial Policy and Promotion (DIPP), the petroleum and natural gas sector attracted FDI worth US$ 7.00 billion between April 2000 and December 2018. Another noteworthy attempts by Indian government includes the setup of LPG terminal at Okhla by Energy Infrastructure Limited (EIL) and the investment of 17,615 crore on drilling oil and gas wells in 2018-19 by ONGC.
1.1
Companies that are shaping O& G
industry ([1] ,[2] )
Oil and gas (O&G) are the most reliable and widely used source of energy that powers the modern world of transportation. Companies such as Tachyus ( known for making use of data physics technology which enables engineers to predict scenarios like machine failure and identify optimal operational plans that result in cost reduction and increased production) ; RunTitle ( first online marketplace for O&G title information and having the largest mineral ownership information database in the US);
fuel controller, a cash drawer, a scanner, a customer display, and a pin pad).
The processes and systems involved in exploration, production, refining, and marketing in the Oil & Gas industry are highly complex, capital-intensive and require state-of-the-art technology. Needless to say, the O&G companies are pressurized to adapt to the dynamic technological advancements and boost productivity, while keeping costs under control. This urgently calls for a higher-than-ever degree of collaboration and data-driven decision-making to optimize costs and maximize organizational effectiveness and operational efficiency. Organizations such as HCL private Limited , Tata Consultancy Services (TCS) is a renowned name in the niche area of business benefits-led outsourcing programs with the ability to offer committed year-on-year productivity on not just IT SLAs and KPIs but also on the key indicators that drive Oil & Gas companies. HCL understands the unique Oil & Gas value chain and provides solutions spanning complex engineering in the upstream and customer responsive business solutions in the retail and marketing segments. Their domain-rich experience and capabilities in digital transformation, IoT, automation, analytics and artificial intelligence help unlock value for organizations in their transformation journey.
The other services offered by them are as follows:
Logistics fleet analytics : HCL’s solution are built in partnerships with SAP, addressing challenges faced by oil and gas companies in logistics . Solutions focus on improving delivery schedules and optimum utilization of vehicles and drivers along with regulatory compilation.
Cloud adoption : HCL has the expertise , experience , tools , partnerships and the credentials to design , select , build and integrate services with modern hybrid and multi-cloud computing solutions . Digital and Analytics : HCL digital and analytics
services help design and build key platform components of customer digital technology footprint to power the digital transformation journey.
IoT works : At IoT works , HCL employees help create entirely new services that deliver measurable business outcomes . These experiences will have an increasing role in differentiating enterprises and enable them to become a next generation enterprise DRYiCE : It is an artificial intelligence driven
platform . It consists of machine learning components , automation modules , orchestration components , well proven monitoring tools , knowledge management and a reporting layer . Application services : HCL’s application business
is structured around 11 integrated horizontal capabilities , allowing us to offer clients a full life cycle of systems integration consulting services and a unified approach to developing the right solutions for their business needs.
Infrastructure services : HCL’s infrastructure management services has some of the most impressive credentials in the IT vendor landscape . We have not only executed complex global IT transformation exercises but also helped run
efficient IT services for more than 300 of the world’s leading companies .
Engineering and R&D services : From product blueprint to support , from software to hardware to mechanical , HCL works with more than half of the top 100 R&D engineering companies across the world.
2.
LITERATURE REVIEW : BARRIERS
FACED BY OIL & GAS START-UPs
1. High start-up costs /capital 2 (HSC): Very few companies even attempt to enter this sector. This lowers potential competition from the start. This entails being able to convince potential investors of the merits of the proposal. Start-up entrepreneurs need to answer a series of questions to satisfy likely investors .
2. Proprietary technology 2 (PT): forces even those with high start-up capital to face an immediate operating disadvantage upon entering the sector.
3. High fixed operating costs2(HFOC) : make companies with start-up capital wary of entering the sector.
4. Local and foreign governments2(LFG): force companies within the industry to closely comply with environmental regulations. These regulations often require capital to comply, forcing smaller companies out of the sector.
5. Problem in finding the right business investors2 (PRBI) : (investors investing start-ups) helps. many dragons provide critical access to networks, connections to potential customers and business experience that the entrepreneur may lack.”
6. Bringing innovation is a challenge3,4 (BI): Large organizations have many complementary assets that are vital to a start-up’s success. For instance, market knowledge and distribution channels are crucial for marketing innovative products and services. To succeed, start-ups need imagination, luck and business skills. Fortunately, launching an energy start-up is becoming cheaper for software- and hardware- based entrepreneurs.
7. Outsourcing3,4 (OUT) : helps large energy companies stay ahead in a stormy marketplace characterized by sustainability, costs and productivity concerns. 8. Poor visibility into complex operations 3,4 (PVO) :
Oil and gas companies operate in some of the most physically and politically challenging environments on earth. Add to that factors such as volatile market prices, fluctuating demand, complex compliance and regulatory regimes, projects that involve multiple third party suppliers, and a workforce that has widely varying education and skill levels — to name but a few
Additionally, poor collaboration and communication can slow down projects and increase inefficiency.
10. Employee onboarding , retention and training (EORT)3,4: Employee onboarding, retention and training have become a critical issue in oil and gas as competition for talent heats up. Emerging markets such as India and China are starting to open up — not only increasing global demand for oil and gas but also competing for talent. Employee turnover in search of the best offers and creating new challenges for companies to both retain their existing employees but also develop the robust training and onboarding processes to get new ones up to speed quickly.
11. Connection between management and execution3,4 (PCME): Successful upstream asset integrity management programs incorporate design, maintenance, inspection, process, operations and management concepts. “Best practice facilities have comprehensive, fully integrated systems and a culture directed at gaining greater lifetime effectiveness, value, safety, availability, profitability and return from production and manufacturing assets.”
12. Right metrics to improve effectiveness and efficiency of your operational improvement efforts3,4 (RM) : Coming up with the right metrics is crucial to gaining the right insight and visibility into business operations and driving the right behaviours and supporting the decision-making of staff.
13. Engagement and commitment for process excellence to achieve cost driven performance3,4 (ACDP): The past view of operational excellence has changed in recent years. Instead of driving out cost, operational excellence is about driving value. While this is a subtle shift, it is a crucial one to get across with senior executives who are tasked with satisfying shareholders who want reliable returns in an environment where sources of fuel are rapidly shifting towards new alternatives such as shale gas.
14. Create networks of excellence (CNE): This will enable transfer of knowledge to maximize operational excellence3,4 There are many different parts of oil and gas operations — e.g. Upstream, downstream, production, refining, etc . There can be benefits to leverage best practice in the different areas of the business. So the barriers identified are High start-up costs /capital (HSC), Proprietary technology (PT), High fixed operating costs (HFOC), Local and foreign governments policies (LFGP) , Problem in finding the right business investors (PRBI), Bringing innovation is a challenge (BI), . Outsourcing (OUT) , Poor visibility into complex operations (PVO) , Effort to improve collaboration with 3PL to improve logistics
(IC3PL) , Employee onboarding , retention and training expenses (EORT) , Poor connection between management and execution (PCME) , problem in getting right metrics to improve effectiveness and efficiency of your operational improvement efforts (PRM) , Engagement and commitment for process excellence to achieve cost driven performance(ACDP) , Problem in creating networks of excellence (CNE).
3.
ISM METHODOLOGY
Interpretive Structural Modelling Methodology or ISM [4] is a known technique to map the relationships amongst the relevant elements as per decision maker’s problems in a hierarchical manner. Starting with the identification of elements , it proceeds with establishing the contextual relationships between elements (by examining them in pairs) and move on towards developing the structural self-interaction (SSIM) matrix using VAXO [4] and then initial reachability matrix and final reachability matrix and rearranging the elements in topological order using the level partition matrices . A Mic-Mac analysis is performed afterwards which categorize the variables as per the driving and dependence power in to autonomous, dependent, driver and linkage category. Finally, a diagraph can be obtained.
4.
DEVELOPMENT OF ISM MODEL
So the barriers identified are High start-up costs /capital (HSC), Proprietary technology (PT) , High fixed operating costs (HFOC), Local and foreign governments policies (LFGP) , Problem in finding the right business investors (PRBI), Bringing innovation is a challenge (BI), . Outsourcing (OUT) , Poor visibility into complex operations (PVO) , Effort to improve collaboration with 3PL to improve logistics (IC3PL) , Employee onboarding , retention and training expenses (EORT) , Poor connection between management and execution excellence (PCME) , problem in getting right metrics to improve effectiveness and efficiency of your operational improvement efforts (PRM) , Engagement and commitment for process excellence to achieve cost driven performance(ACDP) , Problem in creating networks of excellence (CNE).
4.1
Construction of Structural Self
-Interaction Matrix (SSIM)
This matrix gives the pair-wise relationship between two variables i.e. i and j based on VAXO. SSIM has been presented below in Fig 1.
4.2
Construction of Initial Reachability
Matrix and final reachability matrix
S. No.
Barrier s
1 2 3 4 5 6 7 8 9 10 11 12 13 14
HSC HPT HF
OC
LFG PFR
BI
BI OU
T PV
O IC3
PL EO RT
PC ME E
PR M
ACDP PCNE
1 HSC A A A A A A A A A A A A A
2 HPT V A X A O V V V O A V V
3 HFOC A O O X X X A O V X V
4 LFG V V V V V V V V V V
5 PFRBI V V V V O V O O V
6 BI V V V O V O V V
7 OUT A A A O O A A
8 PVO V A A V V V
9 IC3PL X A A A A
10 EORT E
V V V V
11 PCME E
V V V
12 RM V V
13 ACDP V
14 PCNE
Fig 1: SSIM matrix for pair wise relationship amongst barriers
S. No .
Barriers 1 2 3 4 5 6 7 8 9 10 11 12 13 14
HSC HPT HFO
C
LFG PFRBI BI OUT PVO IC3P
L
EORT PCME
E
PRM ACDP PCNE
1 HSC 1 0 0 0 0 0 0 0 0 0 0 0 0 0
2 HPT 1 1 1 0 1 0 0 1 1 1 0 0 1 1
3 HFOC 1 0 1 0 0 0 1 1 1 0 0 1 1 1
4 LFG 1 1 1 1 1 1 1 1 1 1 1 1 1 1
5 PFRBI 1 1 0 0 1 1 1 1 1 0 1 0 0 1
6 BI 1 1 0 0 0 1 1 1 1 0 1 0 1 1
7 OUT 1 0 1 0 0 0 1 0 0 0 0 0 0 0
8 PVO 1 0 1 0 0 0 1 1 1 0 0 1 1 1
9 IC3PL 1 0 1 0 0 0 1 0 1 1 0 0 0 0
10 EORTE 1 0 1 0 0 0 1 1 1 1 1 1 1 1
11 PCMEE 1 0 0 0 0 0 0 1 1 0 1 1 1 1
12 RM 1 1 0 0 0 0 0 0 1 0 0 1 1 1
13 ACDP 1 0 1 0 0 0 1 0 1 0 0 0 1 1
Fig 2: Initial reachability matrix
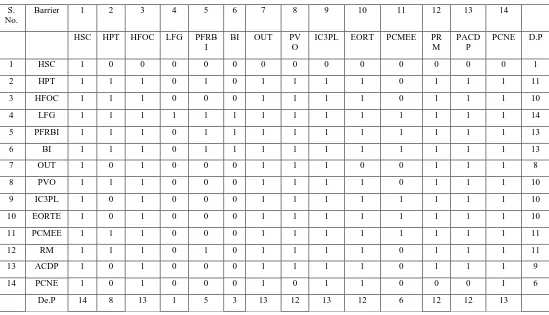
S. No.
Barrier 1 2 3 4 5 6 7 8 9 10 11 12 13 14
HSC HPT HFOC LFG PFRB I
BI OUT PV
O
IC3PL EORT PCMEE PR
M
PACD P
PCNE D.P
1 HSC 1 0 0 0 0 0 0 0 0 0 0 0 0 0 1
2 HPT 1 1 1 0 1 0 1 1 1 1 0 1 1 1 11
3 HFOC 1 1 1 0 0 0 1 1 1 1 0 1 1 1 10
4 LFG 1 1 1 1 1 1 1 1 1 1 1 1 1 1 14
5 PFRBI 1 1 1 0 1 1 1 1 1 1 1 1 1 1 13
6 BI 1 1 1 0 1 1 1 1 1 1 1 1 1 1 13
7 OUT 1 0 1 0 0 0 1 1 1 0 0 1 1 1 8
8 PVO 1 1 1 0 0 0 1 1 1 1 0 1 1 1 10
9 IC3PL 1 0 1 0 0 0 1 1 1 1 1 1 1 1 10
10 EORTE 1 0 1 0 0 0 1 1 1 1 1 1 1 1 10
11 PCMEE 1 1 1 0 0 0 1 1 1 1 1 1 1 1 11
12 RM 1 1 1 0 1 0 1 1 1 1 0 1 1 1 11
13 ACDP 1 0 1 0 0 0 1 1 1 1 0 1 1 1 9
14 PCNE 1 0 1 0 0 0 1 0 1 1 0 0 0 1 6
De.P 14 8 13 1 5 3 13 12 13 12 6 12 12 13
Fig 3: Final reachability matrix
4.3
Level Partition
level element, it is separated out from the other elements and the process continues for next level of elements. Iterations have been shown from table 4 – table 10 below .
Table 4 : Iteration I
Sr. No.
Reachability set
Antecedent set
Intersection set
Itera tion
1. 1 1,2,3,4,5,6,7,
8,9,10,11, 12,13,14
1
I 2. 1,3,7,9,14 2,3,4,5,6,7,8,
9,10,11,12,1 3,14
3,7,9,14
3. 1,3,7,8,9,10, 12,13
2,3,4,5,6,7,8, 9,10,11,12,1
3
3,7,8,9,10,12, 13
4. 1,2,3,7,8,9,10, 12,13
2,3,4,5,6,8, 11,12
2,3,8,12
5. 1,2,3,7,8,9,10, 11,12,13
4,5,6,11 11
6. 1,2,3,5,7,8,9, 10,11,12,13
4,5,6 5
7. 1,2,3,5,6,7,8,9, 10,11,12,13
4,5,6 5,6
8. 1,2,3,4,5,6,7,8, 9,10,11,12,13
4 4
Table 4 : Iteration II
Sr. No.
Reachability set
Antecedent set
Intersection set
Itera tion 2. 3,7,9,14 2,3,4,5,6,7,8,
9,10,11,12,1 3,14
3,7,9,14
II
3. 3,7,8,9,10,12,1 3
2,3,4,5,6,7,8, 9,10,11,12,1
3
3,7,8,9,10,12, 13
4. 2,3,7,8,9,10, 12,13
2,3,4,5,6,8, 11,12
2,3,8,12
5. 2,3,7,8,9,10, 11,12,13
4,5,6,11 11
6. 2,3,5,7,8,9,10, 11,12,13
4,5,6 5
7. 2,3,5,6,7,8,9, 10,11,12,13
4,5,6 5,6
8. 2,3,4,5,6,7,8,9, 10,11,12,13
Table 5 : Iteration III
Sr. No.
Reachability set
Antecedent set
Intersection set
Itera tion 3. 8,10,12,13 2,4,5,6,8,10,
11,12,13
8,10,12,13
III
4. 2,8,10,12,13 2,4,5,6,8,11, 12
2,8,12
5. 2,8,10,11,12,1 3
4,5,6,11 11
6. 2,5,8,10,11,12, 13
4,5,6 5
7. 2,5,6,8,10,11,1 2,13
4,5,6 5,6
8. 2,4,5,6,8,10,11 ,12,13
4 4
Table 6 : Iteration IV
Sr. No.
Reachability set
Antecedent set
Intersection set
Itera tion
4. 2 2,4,5,6,11 2
IV
5. 2,11 4,5,6,11 11
6. 2,5,11 4,5,6 5
7. 2,5,6,11 4,5,6 5,6
[image:6.595.319.561.110.328.2]8. 2,4,5,6,11 4 4
Table 7 : Iteration V
Sr. No.
Reachability set
Antecedent set
Intersection set
Itera tion
5. 11 4,5,6,11 11
V
6. 5,11 4,5,6 5
7. 5,6,11 4,5,6 5,6
8. 4,5,6,11 4 4
Table 8 : Iteration VI
Sr. No.
Reachability set
Antecedent set
Intersection set
Itera tion
6. 5 4,5,6 5
VI
7. 5,6 4,5,6 5,6
[image:6.595.358.503.399.652.2]8. 4,5,6 4 4
Table 9 : Iteration VII
Sr. No.
Reachability set
Antecedent set
Intersection set
Itera tion
8 4 4 4 VII
4.4
Classification of factors
Fig. 4 below shows the driving power and dominance diagram.
Fig . 4: Driving power and dependence diagram
4.5
ISM model
An ISM model is developed ( as shown in fig. 5 below ) after arranging the elements as per their interaction or dependence relationships.
5.
MANAGERIAL IMPLICATIONS &
CONCLUSIONS
Present research work highlights the interrelationships amongst the various barriers faced by oil and gas start-ups and entrepreneurs with the help of ISM methodology . The research can further be extended to include multi-criteria decision making such as Hybrid SCOR Metrics, AHP, and TOPSIS [4] and or PROMETHEE [5] .
Driving
power 14 LFG
13 BI PFRBI
12 IC3PL
11 Drivers PC
MEE
HPT Link
age
RM
10 PVO
EORTE HFOC
9 ACDP
8 OUT
7 Dependent
6 PCNE
5 Autonomous
4
3
2
1 HSC
1 2 3 4 5 6 7 8 9 10 11 12 13 14
DEPENDENCE
Figure 2 : Interpretive structural model HSC
OUT
PACDP EORTE
TE PVO
HPT PRM
PFRBI
LFG PCMEE
BI IC3PL
[image:6.595.39.296.448.737.2]6.
ACKNOWLEDGMENTS
Our thanks to the anonymous reviewers whose comments have helped us in improving the manuscript . Co-author Remica Aggarwal is also thankful to Prof. S.P Singh in disseminating the knowledge about ISM methodology .
7.
REFERENCES
[1] https://www.investopedia.com/ask/answers/061115/how-strong-are-barriers-entry-oil-and-gas-sector.asp [2] http://techgenix.com/oil-gas-tech-startups/ [3] https://www.hcltech.com/oil-and-gas
[4] Wang , C.N. , Huang, Y.F. , Cheng , I.F. , Thanh , N.V.
2018. A Multi-Criteria Decision-Making (MCDM) Approach Using Hybrid SCOR Metrics, AHP, and TOPSIS for supplier evaluation and selection in the gas and oil industry , Processes 6(12):252 .
[5] Qaradaghi , M. & Deason , J.P. 2017. Analysis of MCDM methods output coherence in oil and gas portfolio prioritization. Journal of petroleum exploration and production technology . DOI: 10.1007/s13202-017-0344-0.