Creation
of
a model
that
identifies
and
rates
the
factors
that
influence
NPD
success
within
SME’s
without
using
hard
data.
Student name: Robbin Kok Study supervisors:
M.S.C. Thesis dr. M. de Visser
Date: 03-12-2016 dr.ir. A. Veenendaal
Student Number: S1497863
Student mail: [email protected] Firm supervisor:
Preface
This thesis was written to complete my Master Business Administration at the university of
Twente. The road in reaching the ability to write previous sentence was long and hard. Almost a
year ago, I was ready to start with my master thesis. Although being ready for it I had not no clue
which topic to pick and to spend the rest of the year reading, researching, typing and talking
about. By coincidence I contacted dr. M. de Visser with some ideas about a possible master
thesis. Well ideas that maybe could have better fitted with studies like economy or politics. But
as a good supervisor he turned out be, he provided me with his PHD research and soon I found an
idea for an eventual thesis topic. Assessing the relation between exploration, exploitation and its
influence on sales. But after more than about a 50 phones calls, 100 mails, 6 meetings at different
firm, and 4 months in time it turned out to be not so easy to gather the required data.
Eventually, via dr. M. de Visser and dr.ir. A. Veenendaal I was brought into contact with ROS
Managementregie from Eibergen who were looking for a student to write a thesis about
innovation. So, to finish my thesis ROS offered me the opportunity to graduate within their firm
and use their connections to gather the data required. Unfortunately, after a few months of
working during the holiday on promoting my research, by making promotion videos, mailing
firms, calling firms and visiting firms nobody seemed to have the data required. So, at the end of
September we decided to pull the plug out of the first thesis attempt and to start a new one.
As you can guess the second attempt turned out be more achievable. This time dr. M. de Visser
asked me if I was interested in creating an innovation scan. Well this sounded interesting so I
decided to take the offer. A decision which I don’t regret. During this seemingly short period I
gained a lot of knowledge about innovation and product development within firms and had the
opportunity to have some interesting conversations with firm representatives about the topic. The
most satisfying moment during the project was to discover that one of the firms included in the
research is now using my model to implement certain changes.
To recap I would first like to thank dr. M. de Visser for keeping fate in my research and his
support at all moments when possible. Second I would like to thank dr.ir. A. Veenendaal for
bringing me into contact with ROS management regie allowing me to finish my thesis after all.
graduate within their firm. Additionally, all the firms who participated within my research also
need special some special thanks. And finally, I would like to thank my parents, brother and
friends for supporting me throughout the whole research.
In the end the most important thing I learned during this thesis is that it is sometimes better to
Management summary.
The aim of this research was to find out whether it is possible to create a framework to value the
factors that influence the success of new product development within small and medium
enterprises without using hard data. Due to increased competition, changing markets, shortening
life cycles firms and the increasing pressure from shareholders, firms are forced to increase
profits and to create sustainable competitive advantages. To create a sustainable competitive
advantage and meanwhile increase their profits firms should be innovative. An important factor
in being innovative is the creation of new products. To assess the strength of new product
development within firm’s scholars have created best practice models that enable firms to
compare their practice with the best practice. This enables managers to gain an insight into their
current new product development (NPD) performance and gives direction for eventual
improvement. One of the shortcoming of the existing models is that they are not suitable for
small and medium enterprises (SME’s) who for instance often lack the resources that large firms
do have. To fill this gap, we created a model to value NPD within SME’s. Based on a meta
analyses we took the factors that are ought to be related to the success of new products and
translated them into a 3-level scale. Together all these factors including their 3-level scale form
our final model. Eventually we tested our model within 4 firms by conducting interviews, internal
and external firm valuation based on our model, and the evaluation of our model by firm
representatives. By conducting an analysis over the previously indicated testing methods we
found that our model might be considered valid as a tool to value NPD within firms albeit that
some factors and the measurement method will need some future adjustment. Specifically, our
model still contains some factors that might be unachievable due to the possible absence of
required resources and clearly defined departments within SME’s. Furthermore, the factor
product advantage might not be suitable for firms who produce products on demand of their
customers. Additionally, we found that products who are radically new for a market, the usage of
customer input might be of less importance.To create more accurate scores per factor the model
New
product
development
is
considered
to
be
´´the
lifeblood
of
companies,
large
and
small´´
Contents
Preface ... 2
Management summary. ... 4
1.Introduction ... 9
2. Research design ... 12
2.1 Goals ... 13
2.2 Research questions ... 13
2.3 Conceptual framework ... 13
2.4 Methods ... 14
2.5 Validity ... 15
3. Literature review ... 17
3.1 What is innovation? ... 17
3.2 What is innovation management? ... 17
3.3 Existing NPD management valuation models. ... 19
3.4 Success factors in Product innovation ... 21
3.5 Product characteristics ... 24
3.5.1 Product Advantage ... 24
3.5.2 Product technological sophistication: ... 25
3.6 Process characteristics ... 26
3.6.1 Market orientation ... 26
3.6.2 Predevelopment task proficiency... 28
3.6.3 Cross-functional communication & integration. ... 29
3.6.4 Launch proficiency. ... 31
3.6.5 Marketing task proficiency. ... 31
3.6.6 Senior management support. ... 32
3.6.7. Structured approach ... 34
3.6.8 Customer input ... 35
3.6.9 Reduced cycle time... 37
3.7 Strategy characteristics ... 39
3.7.1 Dedicated human resources ... 39
3.7.2 Company resources and Dedicated R&D resources ... 40
3.7.4 Technological synergy... 43
3.7.5 Marketing synergy ... 44
3.8 Marketplace characteristics ... 45
3.8.1 Market attractiveness factors ... 45
3.9 Organizational characteristics ... 48
3.9.1 Organizational design and climate ... 48
3.9.2 External relations ... 49
3.9.3 Degree of formalization. ... 50
3.10 Best practice model ... 50
4. Field test within SME’s ... 53
4.1 Product advantage ... 54
4.2 Product technological sophistication ... 55
4.3 Dedicated human resources ... 55
4.4 Company and R&D resources ... 56
4.5 Strategic orientation ... 56
4.6 Technological & marketing synergy. ... 56
4.7 Market orientation ... 57
4.8 Predevelopment task proficiency ... 57
4.9 Cross functional communication and integration ... 58
4.10 Launch proficiency ... 59
4.11 Marketing task proficiency ... 59
4.12 Senior management support ... 59
4.13 Structured approach ... 59
4.14 Customer input ... 60
4.15 Reduced cycle time ... 60
4.16 Market attractiveness ... 61
4.17 Organizational design & climate ... 61
5. Conclusion ... 61
6. Limitations & future research ... 63
7: References. ... 65
Appendix 2. Dutch model with mixed valuations ... 72
Appendix 3. Dutch questionnaire. ... 73
Appendix 4. Dutch Evaluation model ... 76
Appendix 5. Firm x score ... 79
Appendix 6. Digitalized feedback forms. ... 80
1.Introduction
Increased competition, changing markets, shortening life cycles and the increasing pressure from
shareholders, are forcing firms to increase their profits and to create sustainable competitive
advantages (Ahmed, 1998; Gama, Silva, & Ataíde, 2007; Griffin, 1997). ‘’There are two
well-known approaches to increase profits and create a sustainable competitive advantage: a
short-term one via operational cost reduction and a longer short-term one by differentiation being
innovative’’(Gama et al., 2007, p.1). Apart from the long term competitive advantage offered by
successful innovation, innovation is found to increase firm performance, is related to firm growth
(Calantone, Cavusgil, & Zhao, 2002; Zahra & Covin, 1994), and is even considered critical for
firm survival (Zahra & Covin, 1994). So ‘’in order to both sustain their competitive position and
to strengthen it, organizations and economies must innovate and promote innovation’’(Baregheh
et al., 2009, p.1324). The development of new products (NPD) specifically plays an important
role in innovation and is considered to be ´´the lifeblood of companies, large and small´´ (Lynn,
Abel, Valentine, & Wright, 1999, p.320).
By tracking innovation managers are enabled to make informed decisions and to align firm
innovation with firm goals (Muller, Välikangas, & Merlyn, 2005). Firms might for instance want
to know how they perform in NPD ‘’because innovation can support differentiation and generate sustainable competitive advantage for organizations’’ (De Medeiros, Ribeiro, & Cortimiglia,
2014, p.76). Unfortunately innovation includes the creation of intangible value making it hard to
measure (Gama et al., 2007). Additionally many firms don´t ´´pay attention to the process of
innovation management ’’ or simply don´t ´´have the internal structures to measure innovation´´
(Gama, Silva, & Ataíde, 2007, p.2). To overcome this firms can measure and value the factors
that enable NPD within firms via a best practice model. Therefore various authors have tried to
identify the so-called success factors that drive the success of new product development within
firms (Cooper & Kleinschmidt, 1987; Cooper, 1990; Cooper, 1996, 1999; Cooper & Edgett,
2003; Cooper, Edgett, & Kleinschmidt, 2004b). An example of an identified success factors that
is argued to increase NPD success is the usage of a stage gate system (Cooper, 1990). A
stage-gate system is ´´a blueprint for managing the new product process to improve effectiveness and
efficiency’’( Cooper, 1990, p.44). Over the years, this and other success factors have been
practice with best practice (Ahmed, 1998; Ernst, 2002; Kahn, Barczak, & Moss, 2006; Kahn,
Barczak, Nicholas, Ledwith, & Perks, 2012; Nicholas & Ledwith, 2006). ‘’Best practices would
be those practices that appear to result in the most favorable outcomes’’ in NPD (Kahn et al.,
2012, p.182). By using a best practice model, firms can get an ‘’overview of a company’s
strengths and areas for improvement with regard to product innovation management, highlighting
those areas that require attention’’(Cormican & O’Sullivan, 2004, p.819).
Although the research on best practice within NPD has been widespread, the majority has been
based on large firms data and are also mainly constructed for large firms, making its applicability
for small and medium firms (SME’s) questionable (Nicholas, Ledwith, & Perks, 2011). SME’s
would be those firms that have between 10 and 250 employees and a turnover ranging between
€2 million and €50 million (European Union, 2003) and together account for more than 90% of
all firms worldwide (Singh, Matthews, Mullineuex, & Medland, 2009). In comparison to large
firms, SME’s might lack the resources to implement practices that are identified as best practices
(Dowling & Helm, 2006; Knudsen, 2007; Nicholas & Ledwith, 2006; Nicholas et al., 2011).
Although SME’s also hold certain advantages over large firms, such as for instance having
shorter decision taking cycles (Nicholas & Ledwith, 2006; Nicholas et al., 2011). These
advantages are not regarded as an advantage in existing best practice frameworks but rather as a
disadvantage. Kahn et al., (2006) for instance argue that in order to have a best practice process
within NPD, firms should implement a formal stage model as argued by Cooper (1990). It is
found that implementation of highly formalized processes can delay processes within firms
(Griffin, 1997). So, by implementing this best practices SME’s could possibly be throwing away
their advantage over large firms instead of expanding them.
So, existing models to value NPD within firms are mostly focused on larger firms with more
skills, resources and other structures making them not suitable for smaller firms (Cooper, 1999;
Eisenhardt, 1989; Ernst, 2002; Evanschitzky et al., 2012; Kahn, Barczak, & Moss, 2006;
Nicholas & Ledwith, 2006). Although these just where some examples of the shortcomings
within existing NPD best practice models we argue there is need for a model that enables SME’s
to value their NPD while respecting their differences in comparison to larger firms. Our intention
managers to track and influence the factors that influences NPD success. Additionally, we found
that in practice many firms lack hard data such as detailed NPD project descriptions, financial
data, and performance measures regarding NPD. Therefore, we add that our model should also be
suitable for firms that lack these types of data. Hereafter we will refer to this type of data as hard
data. So, our research question can be formulated as following: How can SME’s identify and rate
the factors that influence NPD performance without using hard data?
In order to answer our research question and to develop the suggested best practice model, we
will use the success factors in NPD as found by Evanschitzky et al., and make them if possible
applicable for SME’s. Each identified success factor will be discussed individually and will
function as a parameter in the to be developed best practice model. The reason why we will not
start from scratch but use existing models instead is quite simple. ‘’It is not desirable to reinvent
the wheel from scratch, repeating all the error previously made’’ (Stenmark, 2000, p.5). To test
2. Research design
As argued by Ritchie & Lewis (2003, p.5) qualitative methods can be ‘’used to address research
questions that require explanation or understanding of social phenomena and their contexts’’ and
are ´´well suited to exploring issues that hold some complexity´´. As our research question
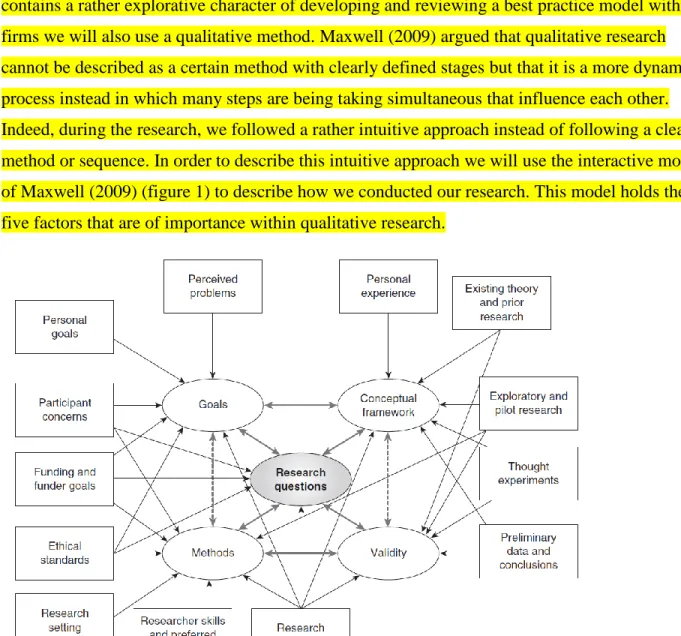
contains a rather explorative character of developing and reviewing a best practice model within
firms we will also use a qualitative method. Maxwell (2009) argued that qualitative research
cannot be described as a certain method with clearly defined stages but that it is a more dynamic
process instead in which many steps are being taking simultaneous that influence each other.
Indeed, during the research, we followed a rather intuitive approach instead of following a clear
method or sequence. In order to describe this intuitive approach we will use the interactive model
of Maxwell (2009) (figure 1) to describe how we conducted our research. This model holds the
five factors that are of importance within qualitative research.
Figure 1: Contextual Factors Influencing a Research Design
2.1 Goals
‘’Why is your study worth doing? What issues do you want it to clarify, and what practices and policies do you want it to influence? Why do you want to conduct this study, and why should we care about the results?’’ (Maxwell, 2009, p.216).As mentioned earlier under the tabs practical and theoretical contributions this research should contribute in creating a best practice framework
for NPD within SME’s without using hard data. The reason why we want to conduct this research
is that from previous research experience we have found that within SME’s there is demand for
such a framework. As argued by Strauss & Corbin, (1990) the reason to conduct a certain
research does not always have to originate from theory but may also come from personal
experience.
2.2 Research questions
‘’What, specifically, do you want to learn or understand by doing this study? What do you not know about the things you are studying that you want to learn? What questions will your research attempt to answer, and how are these questions related to one another?’’ (Maxwell, 2009, p.216). As indicated the aim of this research is to see whether it is possible to create a best
practice framework that values NPD within firms within SME’s without using hard data. To
answer our research question, we have multiple underlying questions that will need to be
answered. First, why are existing best practice models not suitable for SME’s? Answering this
question would give us the criteria that the to be designed best practice model should cope with to
make it suitable for SME’s. Second, which factors are related to the success of NPD within SME’s. Third how can we make these factors measurable and applicable for SME’s? And fourth
is our final model based on the identified factors indeed suitable for usage within practice?
2.3 Conceptual framework
‘’What do you think is going on with the issues, settings, or people you plan to study? What theories, beliefs, and prior research findings will guide or inform your research, and what literature, preliminary studies, and personal experiences will you draw on for understanding the people or issues you are studying?’’ (Maxwell, 2009, p.216). As mentioned earlier our research
question is partially based on personal experience that thought us that there is demand for a tool
that values NPD within SME’s without using hard data. This hard data would for instance include
Based on a preliminary study into the topic we found one model that values NPD within SME’s
(Nicholas & Ledwith, 2006), but this model still has its shortcomings for usage within SME’s. To
further develop our conceptual framework, we will execute a thorough literature research
regarding existing best practice framework in NPD and the factors involved in NPD.
2.4 Methods
‘’What will you actually do in conducting this study? What approaches and techniques will you use to collect and analyze your data, and how do these constitute an integrated strategy?’’
(Maxwell, 2009, p.216). To conduct this study, we first will review existing best practice
framework and why they might or might not be suitable for usage within SME’s. Based on the
results of this review we can specify which features the to be developed model should have.
Based on these specifications we will conduct a literature research regarding the NPD literature
to see how can construct a tool that values NPD within SME’s. And important, which factors
should be included within this model and how to operationalize them? The literature review and
operationalization of the discussed factors will be a synchronous process which eventually leads
to the assembly of the different factors into one model. To test our model, we will be conducting
case studies at four firms. The units of analysis within these cases will be SME firms that develop
and produce new products in-house. SME firms will be those firm that have between 10 and 250
employees and a turnover ranging between €2 million and €50 million turnover.
As argued by Yin (1994) if replication logic in the form of multiple cases is used to find support
for a theory, the result should be similar and whereas the results differ the reason for this should
be included within the theoretical framework. To review whether the theory that grounds our
model holds ground within these cases, and thus assesses its usability and validity for usage
within these firm, we will use the following approach. To start we will interview firm
representatives regarding the factors that are included in our model. Based on this information we
will be able to give this firm a score according our model. At the same time the firm
representative will have the opportunity to rank its own firm based on our model. In order to
prevent firm representatives to give more favorable answers as suggested by Podsakoff (1986)
their ranking scale will be mixed in order to prevent to give more favorable answers. After this
according our model. During this step the firm representative will have the opportunity to give
feedback on the model we created. This feedback step has the aim to assess the validity of the
model we created.
2.5 Validity
‘’ How might your results and conclusions be wrong? What are the plausible alternative
interpretations and validity threats to these, and how will you deal with these? How can the data that you have, or that you could potentially collect, support or challenge your ideas about what’s going on? Why should we believe your results?’’ (Maxwell, 2009, p.216).Maxwell, (2009) has proposed multiple methods or strategies to assure the validity of a research. One of those methods
is gathering rich data by for instance conducting an interview (Maxwell, 2009), as mentioned
earlier to we will initially start with an interview at each firm. The information gathered during
this interview will be noted and if necessary will be used to validate the research outcomes.
As indicated we will provide participants with a feedback form to check the validity of our
model. The participants will have the opportunity to give feedback on each separate factor that is
included within our model. The first question on the feedback form will be about whether the
firm representative does agree with the valuation of their firm according the model, and if not we
will ask them to motivate their disagreement. Eventual disagreement with a certain factor could
for instance indicate that they are biased towards their firms own performance, or in other words
are under or overestimating it. At the other hand, it could also indicate that the levels we
constructed are invalid. To find the source of disagreement we will review the specific firm
motivation to disagree and the information they provided to us during the interview against the
literature we used to build our model on. This method is referred to as ‘’searching for discrepant
evidence and negative cases’’(Maxwell, 2009, p.244).
The second question will be related to whether the firm representative does or does not agree
with the importance of a specific factor and the accompanied levels we identified based on the
theory. The last question will be related to the achievability of the best practice level of each
factor within a firm. Again, for both previous questions we will search for discrepant evidence
awarded to the firm and how the firm rated itself. The degree of discrepancy between the both
could indicate whether the tool is or is not suitable as an external valuation tool of a firms NPD.
Additionally we will use a ‘’quasi-statistics method’’ (Maxwell, 2009, p.245) by calculating the
average agreement over the previously mentioned evaluation questions. Large levels of
disagreement could be a signal to reinvestigate certain factors within the model. Eventual
3. Literature review
3.1 What is innovation?
Innovation is ‘’ the multi-stage process whereby organizations transform ideas into
new/improved products, service or processes, in order to advance, compete and differentiate
themselves successfully in their marketplace’’(Baregheh, Rowley, & Sambrook, 2009, p.1334).
This definition was formulated by reviewing different definitions of innovation throughout
different disciplines consisting of: business management, economy, Innovation and
entrepreneurship, technology & science engineering, knowledge management, marketing and
organization study. The following needs to be considered when speaking about innovation: ‘’ a
discovery that goes no further than the laboratory remains an invention. A discovery that moves
from the lab into production, and adds economic value and adds economic value to the firm (even
if only cost saving) would be considered an innovation’’(Garcia & Calantone, 2002, p.112). To
clarify the difference between inventions and innovation, ‘’an invention is the first occurrence of
an idea for a new product or process’’ whereas ‘’innovation is the first commercialization of the idea’’.’’ To be able to turn an invention into an innovation a firm normally needs to combine several different types of knowledge, capabilities, skills and resources’’ Fagerberg (2009, p.3).
This capability of a firm to transform ideas or inventions into successful product innovations
underlies a firms NPD capabilities.
3.2 What is innovation management?
Simply stated innovation management is concerned with managing ‘’the process of transforming business opportunities into tangible products and services’’ (Cormican & O’Sullivan, 2004,
p.820).In order for firms to develop innovation and to survive they need to have an innovation
management system (Cormican & O’Sullivan, 2004; Tuominen, Piippo, Ichimura, & Matsumoto,
1999). Or more specific, ‘’in order to achieve a competitive advantage in the market the
establishment of an effective product innovation management system is the most important
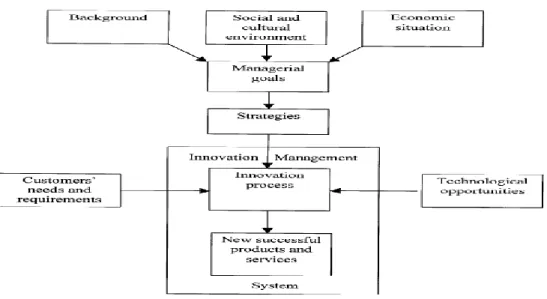
management need for every manufacturing enterprise’’ (Tuominen et al., 1999, p.135). Figure 2
displays the basic concept of product innovation management. As indicated, the firm’s strategy
combined with the costumers needs and available technological opportunities shape the
Figure 2: Basic concept of product innovation management.
Source: (Tuominen et al., 1999, p.138)
A firm’s innovation management system is thus concerned with transforming inputs into outputs
as displayed in figure 3. ´´In order to get good results of the innovation process the quality of all
the required outputs of the management system should be on a proper level´´ (Tuominen et al.,
1999, p.139). Or as Lewis, (2001, p.185) argues, ‘’ successful new products are the outcome of
effective NPD processes. One wrong output, for instance a premature product launch, could lead
to a failure of the process entire (Tuominen et al., 1999). We can argue that for each firm the
inputs differ which leads to different outputs. Firm A might for instance have costumers that
demand a quick development of products, while firm B´s costumers allow more time but demand
more specific features on a product.
Figure 2: Required inputs and outputs of successful product innovation management system.
Figure 3: Required inputs and outputs of successful product innovation management system.
3.3 Existing NPD management valuation models.
To value NPD within firms several authors have described success factors in areas that are related
to the success of NPD (Cooper, 1999; Cooper & Kleinschmidt, 1987; De Medeiros et al., 2014;
Ernst, 2002). Based on these and other success factors authors have created best practice models
to rate firms practice regarding the development of new products (Cooper, 1999; K. M.
Eisenhardt, 1989; Kahn et al., 2012; Kahn et al., 2006; Nicholas & Ledwith, 2006; Cormican &
O’Sullivan, 2004; Ahmed, 1998). To value whether current existing models satisfy the need of SME’s demand for a best framework we will now discuss some existing frameworks.
Cormican & O’Sullivan, (2004) developed a PIM scorecard model to value NPD management
within firms. This scorecard contains 50 statements, so ten statements for each of the following
topics: strategy and leadership, culture and climate, planning and selection, structure and
performance, communication and collaboration. The PIM model works by rating previous factors
ranging from 1 representing strong agreement to 5 which represents strong disagreement.
Although the research has indicated that the model has been successfully introduced in a range of
firms, it has only been tested in medium to large firms with team or function oriented structures.
Since SME’s are argued to lack clearly defined departments (Nicholas & Ledwith, 2006) this model might not be suitable for SME’s. Another model constructed by Ahmed (1998) is based on
the information gathered from 206 firms ranging from medium sized to large. So again, this
model has been based on large firms instead of SME’s making its usability within small firms
questionable. Another model created by (Kahn et al., 2006) includes factors which might be
perceived not to be achievable by SME’s. These factors are for instance the usage of software to
track NPD and its performance. As argued SME’s might lack the resources and time (Nicholas &
Ledwith, 2006) to implement such practices. For an overview of all the main differences between
SME´s and large firms we refer to appendix 7.
Although the previous models have had a lot of attention throughout the literature, it might be
argued they are inapplicable for SME’s due to the previous mentioned critics. In order to
overcome this, Nicholas & Ledwith (2006) adjusted the model developed by Kahn et al., (2006).
This model holds that product NPD management has six key areas existing of strategy, portfolio
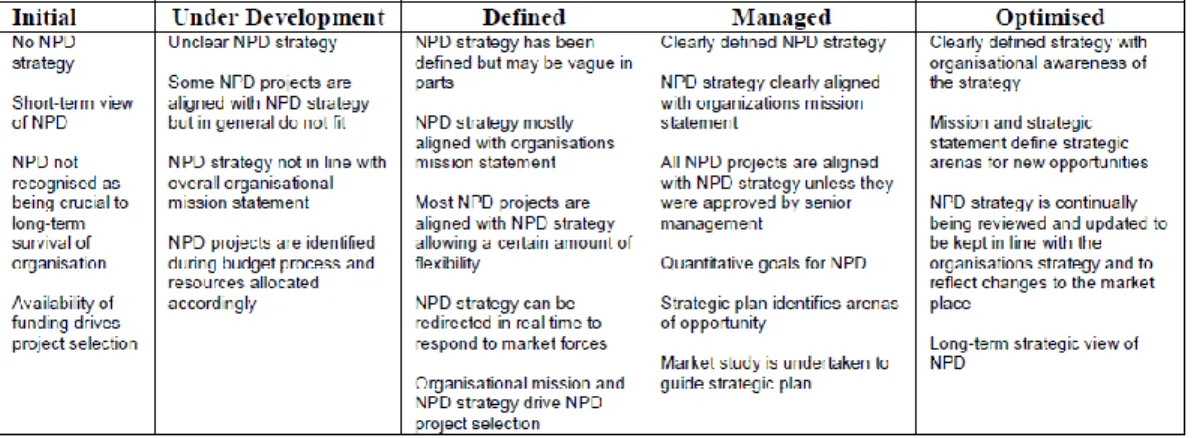
al., 2006; Nicholas & Ledwith, 2006). Figure 4 displays an example of the Key process area
strategy within their (Nicholas & Ledwith, 2006) best practice model. By identifying the actual
strategy practice with the model below managers can rate their firms practice. Firms that for
instance have no NPD strategy would according the model be rated as initial. To improve this
rating a manager could implement the development of clear NPD goals within the firm.
A field test of the model of Nicholas & Ledwith (2006) has shown that the model needed some
adjustments in order for it to become suitable for SME’s. The main points of criticism where that: Firms with ‘’less than 80 employees often have no defined departments’’. So, for firms without
defined departments it would be hard to value within the model. ‘’Another respondent saw
“context as a crucial limiting which drives/challenges NPD. This context includes resources (financial, skill, time) which handicaps SME’s’’(Nicholas & Ledwith, 2006, p.11). In other
words, small firms could for instance not be able to implement certain best practices due to the
lack of resources. Furthermore ‘’the fact that organizational structure is dependent on
organizational size’’ for instance holds that “the decision cycle is much faster in small companies” (Nicholas & Ledwith, 2006, p.11).
Figure 4: Key Process Area: Strategy.
3.4 Success factors in Product innovation
To overcome the previously mentioned critics, we suggest that a model for SME´s should value
factors that are found to increase the success of NPD instead of valuing the road to archive this
factors. Or as Kahn et al., (2012, p.182) argue ‘’there is no “one best way” to high performance
but rather different routes to the same end goal.’’ This will leave room for managers to come up with a custom solution that fits with the company’s resources and characteristics.
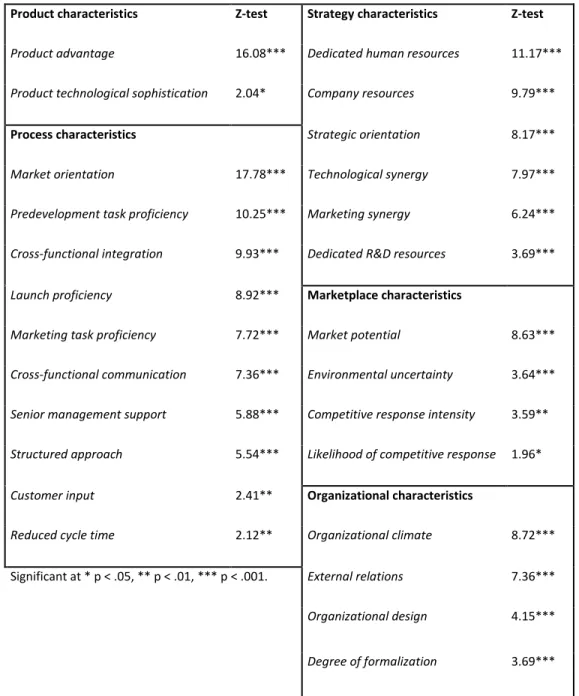
As a starting point to set these goals we will use the findings of Evanschitzky et al., (2012) who
conducted an extensive literature review regarding the success factors of product innovation
within firms. They (Evanschitzky et al., 2012)conducted a meta-analysis of 233 scientific papers
ranging from 1999 to 2011 to identify the predictors of product innovation success. Figure 5
displays the predictors that were identified to be statistically significant related to the success of
new products, albeit either negative or positive directed. Compared to a previous study using the
same analysis method they (Henard & Szymanski, 2001) found that the importance of certain
success factors has been decreasing. They (Evanschitzky et al., 2012) argue that knowledge of the
previously identified factors might have become more widespread among managers making it
more hard for managers to use these factors to create a competitive advantage. This argument
stresses the importance of using recent inputs for our best practice model and the recognition of
the possibility that the importance of the indicated success factors could eventually decrease.
Furthermore the input for this meta-analysis consists of researches conducted in firms ranging
from small to large, which are on average found to be related to the success of NPD within firms
(Evanschitzky et al., 2012). This implicates that the specific impact of these factors on NPD
success in SME’s is unknown. One can argue that these factors would thus not be suitable as an
input for our model and recommend the usage and adjustment of existing best practice models
instead. Again, we could come to the same conclusion then. The success factors or parameters
used in existing best practice models are also mostly based on large firms. Adjusting those
parameters to SME’s would lead to the same effect of being uncertain whether such a factor
indeed has an impact on NPD success within SME’s. Therefore, we will stick with what is
known, and to verify whether the selected success factors are indeed suitable for SME’s we will
Concluding to the discussion of each included success factor we will create a 3-level score of
each success factor. In comparison to existing models that use 4 or even 5 levels (Kahn et al.,
2006; Nicholas & Ledwith, 2006) we opted to set 3 levels. Firstly it could be argued that many of
the success factors identified by Evanschitzky et al., (2012) are rather dichotomous in nature. For
instance, regarding the success factor product advantage, a product developed by a firm either
offers an advantage over competitive offerings or it simply doesn’t. NPD projects that have
products without a product advantage as an output would clearly be seen as bad practice whereas
products that do offer advantages over competitive offerings as a best practice (Cooper et al.,
2004c). In reaching this it is argued that firms should have a mechanism of checking whether
products offer an advantage (Cooper et al., 2004c). We operationalize this by setting a bad
practice level for firms that have no checks on product advantage, causing products without a
product advantage over competitive offerings to enter the development phase. A best practice
level for firms that have adequate checks that prevent products without any competitive offerings
to enter the development phase. And a middle of the road level (level 2) for firms that have a
system to check products on their advantage but somehow fail and still allow product without an
advantage to enter the development phase. Furthermore, as mentioned earlier our aim is not to
describe the path to a certain success factor but to differentiate between the characteristics of
good and bad practice of each success factor. The path of reaching a best practice level can vary
between each firm. Therefore, setting much specific levels could put too much emphasis on the
path of reaching certain practice instead of the practice itself.
Additionally, during the research, we found that certain factors could not be seen separate from
each other and have therefore been merged within the discussion and within the final model.
Dedicated human resources and company resources have been merged into company and R&D
resources, all factors within marketplace characteristics have been merged, and all factors within
organizational characteristics except for external relations have also been merged. External
Product characteristics Z-test Strategy characteristics Z-test
Product advantage 16.08*** Dedicated human resources 11.17***
Product technological sophistication 2.04* Company resources 9.79***
Process characteristics Strategic orientation 8.17***
Market orientation 17.78*** Technological synergy 7.97***
Predevelopment task proficiency 10.25*** Marketing synergy 6.24***
Cross-functional integration 9.93*** Dedicated R&D resources 3.69***
Launch proficiency 8.92*** Marketplace characteristics
Marketing task proficiency 7.72*** Market potential 8.63***
Cross-functional communication 7.36*** Environmental uncertainty 3.64***
Senior management support 5.88*** Competitive response intensity 3.59**
Structured approach 5.54*** Likelihood of competitive response 1.96*
Customer input 2.41** Organizational characteristics
Reduced cycle time 2.12** Organizational climate 8.72*** Significant at * p < .05, ** p < .01, *** p < .001. External relations 7.36***
Organizational design 4.15***
Degree of formalization 3.69***
Figure 5: Relationship between Predictor Variables and New Product Success
3.5 Product characteristics 3.5.1 Product Advantage
Henard & Szymanski, (2001, p.364) indicate that product advantage is the ‘’superiority and/or
differentiation over competitive offerings’’. It is found that the advantage a product offers is
positively related to a NPD´s success (Evanschitzky et al., 2012; Henard & Szymanski, 2001;
Langerak, Hultink, & Robben, 2004). In line with the research outcomes, Cooper et al., (2004)
express that product advantage is one of the most important factors in successful NPD. Langerak
et al., (2004) state that products that offer costumers superior benefits are the most likely to be
successful. Cooper et al.,(2004, p.12) express certain ways how firms can create product
advantage such as by offering customers/users ‘’main benefits that are important to them’’, ‘’new
and unique benefits’’,’’ Better value for money for the customer’’,’’ Superior to competitors’
products in terms of meeting customer needs’’ or’’ Offering product with superior quality to competitive products’’.
They (Cooper et al., 2004c) argue that the product advantage should be known before a product
enters development. They suggest that a stage gate model might be implemented to prevail
products going into development before one of the previous advantages are known. At the other
hand it is known that SME’s might lack certain resources like time and skills to implement a
formal model such as a stage gate model (Loch, 2000; Nicholas & Ledwith, 2006). Furthermore
Nicholas & Ledwith, (2006) indicate that the decision cycle within smaller firms is much faster in
small firms. Implementing such a formal process could slow down this decision cycle due to
unnecessary bureaucracy (Griffin, 1997). Therefore, we suggest it is not about the process itself
but whether firms allow products without an advantage in development or not. The implantation
of how they reach this might be different for each firm. Or as Loch (2000) indicates, there is no
such thing as an NPD best practice, each firm should develop its own optimal processes.
To rank firms on this specific success factor we suggest the following scale. Firms that are ranked
as level 1 have no process to check if there is a product advantage over competitive existing
offerings, products without advantages over competitive offers could thus enter development. As
product advantage is one of the most important success factors in NPD (Cooper et al., 2004c;
resources. Level 2 firms have implemented a method to check if products offer an advantage, but
this method is inadequate as it still allows products without an advantage into development. Level
3 firms have an adequate method to check whether a product offers an advantage meaning that no
product without an advantage over competitive offerings can enter development. This offers
firms the possibility to be critical and terminate product development before they enter
development. This could prevent firms from wasting resources and to focus on the products that
do offer advantages.
Product advantage
Level 1
There is no check if products offer an advantage over existing competitive products before they enter the development phase.
Level 2
Although there are checks, products can still enter the
development phase without offering an advantage over existing competitive products.
Level 3 Due to checks, products can only enter the development phase if
they offer an advantage over existing competitive products.
Figure 6: Product advantage.
3.5.2 Product technological sophistication:
Henard & Szymanski, (2001, p.364) indicate that technological sophistication relates to the
‘’perceived technological sophistication (i.e., high-tech, low-tech) of the product’’’. They explain
that the perceived technological sophistication of a product relates to the market it is being sold.
In other words, the technological sophistication of a product should be consistent with the market
it is being sold on. Selling industrial machines to households could for instance cause that
costumers are not correctly perceiving the actual quality of this machines. At the other end of the
spectrum, selling household machines to industrial users could lead to an underestimation of
these machines. Although these products might be good, they are not suitable for this market.
To measure how good firms are able in translating actual technological product sophistication
into the correct perceived product sophistication we suggest the following scale. Level 1 firms are
costumers. An example would be selling low quality household vacuum cleaners within a b2b
market where customers demand sophisticated solutions.
Level 2 firms produce products that are sophisticated but are not able to transfer this
sophistication into the perception of the costumers. Selling high end household vacuum machines
within a b2b industry would lead to un underestimation of the sophistication of the product. In
other words, a mismatch between the product and the market in which it is being sold.
Level 3 firms produce technological sophisticated products that are also perceived as
sophisticated by their customers. Would the previously mentioned high end household vacuum
machine being sold within a consumer market it would be perceived as more sophisticate due to a
better fit between the product and the market.
Perceived technological product sophistication
Level 1
Non-sophisticated products that are also perceived as unsophisticated
by customers.
Level 2
Sophisticated products that are perceived as unsophisticated due to the fact they are being sold on the wrong market.
Level 3
Sophisticated products that are also perceived as sophisticated
because they are being sold on the correct market.
Figure 7: Perceived technological product sophistication.
3.6 Process characteristics 3.6.1 Market orientation
Henard & Szymanski, (2001, p.364) describe market orientation as the ‘’Degree of firm
orientation to its internal, competitor, and customer environments’’. It has been argued that market orientation will improve a firm’s profitability by incorporating customer and competitor
orientation accompanied with interfunctional coordination between different organizational
functions (Narver & Slater, 1990). ´´Customer orientation is the sufficient understanding of one's
target buyers to be able to create superior value for them continuously´´ (Narver & Slater, 1990,
p.21). Whereas competitor orientation is concerned with understanding current and potential
competitor’s capabilities. The outcomes of these orientations function as the input for firms in
order to create products that create value for buyers (Narver & Slater, 1990). Additionally it is
solely based on costumer or competitor orientation which is argued to lead to reduced product
performance (Gatignon & Xuereb, 1997). Different organizational functions should thus work
together in creating superior value for customers (Narver & Slater, 1990).
Other scholars express that market orientation is not directly positively related with NPD success,
but it is positively related to the factor product advantage (Langerak, Hultink, & Robben, 2004).
They explain that market orientation functions as a moderating factor between product advantage
and NPD success. They indicate that ‘’market-oriented culture helps in creating such an
advantage through actively scanning customers’ wishes in the context of the competitive
environment and then through analyzing, distributing, and using the resulting insights throughout
the new product team to create value for customers’’(Langerak et al., 2004, p.89). So basically,
the gathered market orientation results function as the inputs for the product advantage
parameters. To increase the success of NPD they (Langerak, Hultink, & Robben, 2004) indicate
that market orientation input should be implemented in all stages of the NPD process. An
important comment has to be made, firms who are solely depending on market orientation as an
input for product innovation are likely to only produce incremental innovation since this input is
mostly based on existing products (Baker & Sinkula, 1999). It is therefore argued that firms
should also have a strong learning orientation that critically values market and learns from
orientation instead of directly using it as an input for the NPD process (Baker & Sinkula, 1999).
So, to rank firms on their market orientation skills we suggest the following scale. Level 1 firms
do not use market data causing for instance they cannot know which advantages a new product
will bring which could lead to products that offer no advantages over existing products. Level 2
use market orientation as input for their NPD process but findings regarding customer and
competitor orientation are not shared via interfunctional coordination causing products to be
either solely customer or competitor oriented lowering its potential success (Gatignon & Xuereb,
1997). Level 3 use market orientation as input for their NPD process and transfer findings
regarding customer and competitor orientation via interfunctional coordination. They furthermore
have a learning orientation which enables them to critically value and learn from market input
Market Orientation
Level 1
There is no market orientation input into the NPD process causing for instance product advantages over competitive
products to be unknown.
Level 2
There is input of market orientation input into the NPD process causing product advantages over competitive products to be known. But there is no interfunctional coordination between departments causing the product to be solely customer or competitor oriented.
Level 3
There is input of market orientation input into the NPD process causing product advantages over competitive products to be known. There is interfunctional coordination between departments preventing the product to be solely customer or competitor oriented. Market information is
interpreted critically and is used to learn from enabling radical innovation.
Figure 8: Market orientation benchmark.
3.6.2 Predevelopment task proficiency.
Henard & Szymanski, (2001, p.364) define predevelopment task proficiency as the ‘’Proficiency
with which a firm executes the prelaunch activities (e.g., idea generation/screening, market
research, financial analyses)’’. Langerak et al., (2004) support this partially by the findings that
the proficiency of certain predevelopment tasks is positively related to NPD success. They
identify idea generation and strategic planning as main drivers in proficient predevelopment
tasks. Although they found that idea screening and business analysis are not directly positively
related to NPD success they stress these parts are crucial for the predevelopment process.
Furthermore, they (Langerak, Hultink, & Henrys, 2004) stress that market orientation can
positively mediate the predevelopment task proficiency by providing input.
So, to rank firms on their predevelopment task proficiency we suggest the following scale. Level
1 firms have no proficiency in predevelopment task, e.g. there is no process of idea generation /
screening, market research or financial analysis before a product enters development. Level 2
firms do execute these processes but do not base them on market orientation input. Level 3 firms
Predevelopment task proficiency
Level 1
No process of idea generation / screening, market research or financial analysis before a
product enters development.
Level 2
No input of market orientation in idea generation / screening, market research or financial analysis before a
product enters development
Level 3
Input of market orientation in idea generation /screening, market research or financial
analysis before a product enters development
Figure 9: Predevelopment task proficiency.
3.6.3 Cross-functional communication & integration.
Henard & Szymanski, (2001, p.364) indicate that cross-functional integration refers to the
‘’degree of multiple-department participation in a new product initiative’’. It is found that by
involving different people from departments (for instance commercial and research based
departments) the intellectual competition increases which leads to breakthroughs that a sole
department would have never reached. The reason for this is that departments with different
backgrounds have different views on things causing the problems to be approached different and
innovatively (Ahmed, 1998).
Gemser & Leenders (2011) found however that cross-functional integration is not always the best
way to go. They found that the effectiveness of the usage of cross-functional integration for NPD
depends on the risk of the NPD project. They describe risk as the degree of uncertainty, for
instance the pursue of technology or markets that are new to a firm. NPD projects with low risks
have comparable success rates as when firms do or do not use cross-functional integration.
Implementing costly cross-functional integrating mechanism in low risk are considered as a
waste of costly resources. Usage of cross-functional integration in high risk NPD project however
does increase the success rate. Therefore they (Gemser & Leenders, 2011) add that firms should
adapt their cross functional integration level over time according the risk of the NPD project in
Additionally they (Gemser & Leenders, 2011) add that the level of openness of information
between departments also influences the necessity of cross functional integration. Openness of
information between departments or cross-functional communication is considered as the ‘’level
of communication among departments in a new product initiative’’ (Henard & Szymanski, 2001,
p.364). Gemser & Leenders, (2011) argue that the openness between departments enables the
same mechanism of internal information sharing without the costs of cross functional integration.
High openness of information between departments is therefore argued to make cross functional
integration unnecessary in low risk projects. They therefore conclude by stating that cross
functional teams should only be used in high risk projects when the to be gathered knowledge is
new for the firm and therefore hard to gather solely via internal information sharing. Due to
scarce resources (Nicholas & Ledwith, 2006) within SME’s it can be argued that these resources
should be invested wisely. By increasing this information sharing the costs of cross functional
integration can be reduced. Firms should thus enhance the internal sharing of information
between departments for instance marketing, R&D. Since SME’s often lack clearly defined
departments (Nicholas & Ledwith, 2006) it here refers to the information sharing between people
from different disciplines. Furthermore, firms should only use cross functional integration
depending on the risk of a certain NPD project, again also to prevent resource wasting.
To rank firms on cross functional integration we propose the following scale. Level 1 firms have
no communication between departments or persons, using cross functional integration here is
suggested to lead to NPD failure and as a waste of resources (Gemser & Leenders, 2011). Level 2
firms have an openness of information between departments or persons but fail in the correct
usage of cross functional integration depending on the risk of a project. This could lead to project
failure or unnecessary resource spending (Gemser & Leenders, 2011). Level 3 firms have a high
openness between persons or departments and only use cross functional teams in high risk NPD
Cross functional communication & integration
Level 1
No communication between persons from different disciplines / or
departments during NPD projects.
Level 2
Communication and integration of persons from different disciplines / or departments
during all NPD projects.
Level 3
Communication between persons from different disciplines / or departments during all NPD projects. Only integration of people from different departments in high risk NPD projects.
Figure 10: Cross functional integration.
3.6.4 Launch proficiency.
Henard & Szymanski (2001, p.364) describe Launch proficiency as the ‘’Proficiency with which
a firm launches the product/service’’ Research indicates a positive relation between launch
proficiency and NPD success (Evanschitzky et al., 2012; Henard & Szymanski, 2001; Langerak,
Hultink, & Robben, 2004). Additionally Langerak et al., (2004) found that launch proficiency is
also positively related to market orientation. They argue that market orientation supports the
success of launch proficiency by providing market input which on its turn increases launch
proficiency. To rank firms on their launch proficiency we suggest the following scale. Level 1
firms have no proficiency in launching new products. Level 2 firms are proficient in launching
new products but do not use market orientation input to base their launch strategy on. Level 3
firms are proficient in launching new products and base their launching strategy on market
orientation input.
Launch proficiency
Level 1
No proficiency in launching new
products
Level 2
Proficiency in launching new products. But the launch
strategy is not based on market input.
Level 3
Proficiency in launching new products. Launch strategy is
based on market input.
Figure 11: Market proficiency benchmark.
3.6.5 Marketing task proficiency.
Henard & Szymanski, (2001, p.364) describe marketing task proficiency as the ‘’Proficiency
marketing tasks is positively related to NPD success (Cooper, 1982; Ernst, 2002; Evanschitzky et
al., 2012; Henard & Szymanski, 2001). The literature regarding the influence of marketing on
NPD has indicated multiple marketing factors that influence the success of NPD, gradually
becoming more specific during the time (Ernst, 2002). Cooper (1982, p.222) for instance
indicated that ‘’marketing research, advertising and promotion, and salesforce/distribution’’ are
the most important factors for NPD success. Current research separately indicated the influence
of market orientation on NPD Success (Evanschitzky et al., 2012), of which marketing research
can be considered as a part of. Although the research field has become more specific, the inputs
such as skills and resources for proficient marketing execution have remained the same (Ernst,
2002).
Therefore, to value a firms marketing task proficiency, we suggest the following scale. Level 1
firms lack the skills and resources to successfully conduct marketing task. They have for instance
no skilled workers nor the resources to conduct the market research required in for instance the
market orientation. Level 2 firms lack either resources or skills which could lead to the failure of
for instance market orientation. Level 3 firms have the resources and the skills to conduct
marketing tasks as market orientation successfully.
Marketing task proficiency
Level 1
Lacking marketing skills and resources to conduct required tasks. For example, no skilled workers nor the resources to conduct the market research required for the market
orientation.
Level 2
Either lacking marketing skills OR resources to conduct required tasks. For example, no skilled workers or no resources to conduct the market research required for the market orientation.
Level 3
Sufficient marketing skills and resources to conduct required tasks such as market research required for the market orientation.
Figure 12: Marketing task proficiency.
3.6.6 Senior management support.
Senior management support is considered as the ‘’Degree of senior management support for a
new product initiative’’Henard & Szymanski, (2001, p.364). Senior management support is found
McDermott, 2003). Best practice firms have ´´senior managers that support innovation with
appropriate resources, structures, and processes´´Barczak, Griffin, & Kahn, (2009, p.18) ‘’and
rewards the NPD efforts of the employees’’(Kahn et al., 2012, p.185). The involvement of senior
management within an NPD project enables the gathering and usage of valuable internal and
external information which increases the learning of an NPD team. This learning of NPD teams
increases the level of innovation and the speed to the market of the products they develop (Sarin
& McDermott, 2003). Additionally, in firms where employees can directly report to senior
management this results in more radically ideas and innovation, due to the fact that screening
mechanisms that would normally filter out these ideas are not in place (Ahmed, 1998). It can be
argued that especially in SME firms, due to its flatter organizational structure and short decision
cycle (Nicholas & Ledwith, 2006), this ideas are more easy accessible for senior management.
Apart from the interaction with the NPD projects or ideas it is also argued that senior
management is required to have certain skills to successfully support NPD projects (Barczak et
al., 2009; Cooper, Edgett, & Kleinschmidt, 2004a).Cooper, Edgett, & Kleinschmidt, (2004)
indicate that in order for senior management to successfully support NPD they need to have
authority, understanding of the NPD process, be engaged and committed to the NPD process and
the development of new products, measuring the performance of the NPD process, not micro
manage projects and being involved in the go or no decision of projects.
So, to value firms according their senior management support we suggest the following scale.
Level 1 firms lack senior management support in NPD projects and are ‘’characterized by an
organization where all NPD ideas originate inside the company, and senior management does not
encourage creativity or does not support the NPD effort of the employees’’ (Kahn et al., 2012,
p.185). Level 2 firms NPD projects have support from managers that either lack skills and or
resources to successfully support NPD projects. Level 3 firms NPD projects receive the support
from senior management that the poses the skills resources to successfully support the project.
Senior management support
Level 1 No senior management support in NPD projects.
Level 3 Skilled and resourceful senior manager support in NPD projects.
Figure 13: Senior manager support.
3.6.7. Structured approach
Structured approach refers to the ‘’employment of formalized product development procedures’’
(Henard & Szymanski, 2001, p.364). Several authors argue that a structured approach increases
NPD success (Ernst, 2002; Evanschitzky et al., 2012; Henard & Szymanski, 2001). Although
opposing, it is also found that when a firm introduces a new product into more turbulent or
dynamic environments a less structured development procedure is beneficial because products in
turbulent environments tend to become obsolete quickly (Henard & Szymanski, 2001). In order
to prevent products in turbulent environments to become obsolete firms are required firms to
engage in exploration (Jansen et al., (2006).‘’Organizations that engage in exploratory innovation
pursue new knowledge and develop products and services for emerging customers and
markets´´(Benner & Tushman (2003) and Jansen et al.,(2006) as cited in Jansen, Vera, &
Crossan, 2009, p.5). To enhance exploration, firms need to decentralize decision making and
semi-formalize their development processes (Ireland & Webb, 2007). Exploitation at the other
hand is found to be successful in stable environments (Jansen et al., 2006). ‘’Organizations
pursuing exploitative innovation build on existing knowledge resources and extend existing
products and services for current markets’’ (Benner & Tushman (2003) and Jansen et al.,(2006)
as cited in Jansen, Vera, & Crossan, 2009, p.5).In order to enhance exploitation firms are argued
to centralize and formalize decision making (Lavie et al.,2010). It has to be noted that to many
bureaucracy due to formalization can lower NPD success (Cooper, 1999). Additionally it has
been found that firms that have no formal process or follow some kind of informal process in
NPD can also be successful (Griffin, 1997). The costs of formalizing in SME’s that have limited
resources (Nicholas & Ledwith, 2006) could therefore be seen as waste of resources. To
conclude, firms should base their decision to employ formalized development procedures
dependent on the degree of environmental dynamism surrounding the NPD project, but should
avoid to over formalize their processes (Henard & Szymanski, 2001; Jansen et al., 2006).
To rank firms on their ability to successfully use formalization in NPD processes we suggest the
following scale. Level 1 firms lack either form of formalization within NPD processes and have
Level 2 firms use formalization but not based on the environmental dynamism of NPD. This
might for instance cause over formalization leading to failures in radical projects exploration.
Due to rigid formalization managers create a culture that might resist employees from looking for
new solutions outside their own tasks and responsibilities instead of exploring new solutions (van
der Panne, van Beers, & Kleinknecht, 2003). Furthermore the incorrect usage of formalization, or
over formalization, could hurt the success of NPD projects due to the fact the process becomes
the goal instead of the project (Cooper, 1999). Level 3 firms use formalization dependent on the
dynamic environment of the NPD project. NPD projects with exploitative characters would for
instance be characterized by higher formalization whereas explorative projects are characterized
by low formalization (Duane Ireland & Webb, 2007; Lavie et al., 2010). These firms avoid over
formalization in all situations to increase the NPD success rate (Cooper, 1999).
Structured approach
Level 1
No process or procedure at all to guide NPD projects. Also, no informal process to guide NPD projects.
Level 2
Highly formalized or unformalized processes or procedures in guidance of all NPD projects. Formalization is not adjusted to the required type of innovation.
Level 3
Low formalized process or procedure with decentralized decision making in projects where radical innovation is required due to uncertain environment of the market in which the product is going to be introduced. More formalized process or procedure with centralized decision making in projects where incremental innovation is required due to more stable environment of the market in which the product is going to be introduced. But no increased bureaucracy due to over formalization.
Figure 14: Structured approach.
3.6.8 Customer input
Customer input is considered as the ‘’ incorporation of customer specifications into a new product initiative’’ and is found to be positively related to NPD success (Henard & Szymanski,
2001, p.364). Customers used to be considered as passive buyers and users of new products
(O’Hern & Rindfleisch, 2008) in the B2B market as well in the B2C market (Ernst, Hoyer, &
Rübsaamen, 2010). Even the input of consumers is for instance already used in a wide variety of
markets ranging from the creation of open source software to the creation of new Boeing
airplanes (O’Hern & Rindfleisch, 2008). The reason for even involving end consumers in the
‘’NPD process’’ is that it ‘’can improve product quality, reduce risk, and increase market
acceptance´´(Wire, 2001 as cited in Hoyer, Chandy, Dorotic, Krafft, & Singh, 2010, p.283).
In order to gather the correct information from costumers it is suggested that firms should use the
input from the right costumers (Cooper et al., 2004c; von Hippel, 1986). If a firm ‘’works with
average customers, one gets average ideas, but innovative customers are likely to be the source of
much more innovative ideas’’(Cooper et al., 2004a, p.8). Therefore firms should use the input from lead users which are users ‘’whose present strong needs will become general in a
marketplace months or years in the future’’ (von Hippel, 1986, p.791).
Apart from gathering the input from the correct customer is argued that firms should not always
intensively use the input from costumers in NPD processes. The required intensity of customer
interaction, or the intensity of the process to gather costumer input, in NPD processes should
depend on the newness of a product and the embeddedness of the product with the customers
environment (Bonner, 2010). The newness of the product can be considered as the degree of
newness of the product for the firm and the market (Olson, Walker, & Ruekert, 1995), whereas
the of embeddedness of a product indicates its influence on the user (Bonner, 2010). It is argued
that NPD projects with a high degree of newness or embeddedness should use more intensive
costumer interaction to generate customer input than NPD projects with a low degree of newness
or embeddedness (Bonner, 2010). It is found that the quality of information, or customer input is
only positively related with customer interaction in situation where the to be developed products
have a high degree of newness and or highly embedded into the customer. The reason for this is
that products with a high degree of newness or embeddedness are surrounded by complex
demands from the customer side which are not easy to transfer. A high degree of interaction with
the customer thus enables the transfer of this knowledge to the firm. Since the quality of customer
input is lower in situations where product newness and embeddedness are lower, investing in