1
Algorithmic investing
within the philosophy of the Basis Zero experiment
An explorative study on the possibilities of implementing algorithmic investing within the scope of the Basis Zero experiment.
Public version
A thesis submitted in partial fulfillment of the requirements for the degree of
Master of Sciencein
Industrial Engineering and Management
Specialization:
Financial Engineering and Management
Department Industrial Engineering and Business Information Systems February 2017
Author: M.L. de Wit
University supervisors: Dr. B. Roorda
Dr. R.A.M.G. Joosten External Supervisor: H. Terpoorten MSc
2
Management summary
The goal of the “Basis Zero: 10-10-10” experiment is the development of a new basic pension product that needs to meet three requirements. The concept should be explicable within 10 lines of text, with maximum asset management costs of 10 basis points a year (including transaction costs) and its execution costs should not be higher than 10 euro a year. In summary, a simple and inexpensive product that still offers appropriate quality features.
In the experiment phase three schools of thought underpin the development of the product. These schools of thought, or scenarios were based on the distance to current practices at APG – ranging from Heerlen to Groningen and Rottumerplaat. The focus of this thesis is on the scenario that is farthest removed from current practices: Rottumerplaat. On the desert island a complete new pension provider is built from scratch, not using any current systems or infrastructure of APG. As Rottumerplaat is uninhabited every action needs to be automated including asset management. The objective of this thesis is the development of an algorithm to automate the asset management process. The research question is therefore:
Is it possible for APG to create and implement an algorithm that automatically makes investment decisions - given a certain investment universe and the Basis Zero philosophy - with a pension objective that achieves adequate performance?
Treleaven (2013) describes the trading process in five steps: data access/cleaning, pre-trade analysis, trading signal generation, trade execution and post-trade analysis. Our contribution focuses on the composition of portfolios over time where aspects of the pre-trade analysis as well as the trading signal generation will be included.
In line with the philosophy of Basis Zero the adequacy of the algorithms results will be based on a replacement rate. The (absolute) replacement rate generally refers to an indicator showing the level of pension income as a percentage of earnings before retirement and measures the extent to which a pension system enables continuing a certain standard of living. The minimum acceptable replacement rate level is set at 60% but the objective of the algorithm will be a 70% replacement rate. There is a widely supported belief, a ‘rule-of-thumb’, that 70% of final earnings will provide a good pension.
The original idea of the Basis Zero experiment was to arrange exchange connectivity to Euronext and be able to invest in every product traded on this exchange. For the purpose of this thesis the investment universe is limited to seven asset classes and ten liquid products on several corresponding indices. The tenth instrument is a(n approximated) ‘risk-free’ or cash instrument to which funds can be allocated. The asset classes included in the scope are equities in developed and emerging markets, real estate, commodities, credits, treasuries and cash. The corresponding equity indices are: MSCI North America, Europe, Asia Pacific ex Japan, Japan and MSCI Emerging Markets. The other indices are: FTSE EPRA/NAREIT Developed (Real Estate), S&P GSCI (Commodities), Barclays US Corporates: Investment Grade (Credits) and Barclays Euro Aggregated Treasury (Treasuries). The J.P. Morgan Euro Cash 1-month instrument is used as our cash option. The 10 instruments are chosen based on liquidity, so large volumes do not limit our trading possibilities.
From the selected indices historical time series are used as dataset. The set includes monthly closing values from the indices ranging from January 31st 2002 to April 29th 2016. This time frame is chosen based on the length of the period and actuality of the data.
The selected portfolio construction models can be divided in rule-based models using heuristics, and optimisation-based models using an objective function. We will use mean variance and minimum variance optimisation, momentum and mean reversion on the return rate, a 1/N model and a lifecycle. Some are rather simple, others more sophisticated.
3
simulated time series. A geometric Brownian motion and a basic historical simulation approach generate these series. Two extensions of the historical simulation approach are used. The first is an exponentially weighted moving average where recent observations get more weight. The second approach gives more weight to scenarios with a low interest rate. The historical data set will additionally be used to test the models on a short, but real, dataset.
The results of the simulations show that the mean variance model achieves the best performance across all simulation methods. The mean and median replacement rates exceed 70% in all historical simulations but underperform in the geometric Brownian motion simulation. It beats the performance of APG on these measures almost always. At the same time the dispersion of the results is large which is an important downside as it comes to pension investing. The Value at Risk is many times below satisfactory levels where APG shows decent numbers. By giving more weight to more recent scenarios or to scenarios with a low interest rate both mean/median results and the Values at Risk increase substantially while the variance numbers stay large. Nevertheless it is still APG that shows the preferred results.
According to our results the conclusion can be drawn that it is possible to develop an algorithm that automatically invests funds at low costs. The limit of ten 10 basis points should not be a problem. The best performing/mean variance model shows adequate performance in the majority of the results. However there is a substantial risk that an insufficient result will be obtained. The results of APG are on average a bit worse, but they are more stable making setbacks less severe. A conservative attitude is desirable when making decisions about (other) people’s pension income. For participants or investors with a low risk appetite our solution is not yet an alternative to APG’s current practice. However, a participant that is more risk tolerant could consider this alternative option.
As the number 10 is the foundation of the experiment we summarize our solution, for the professional reader, in 10 lines:
We created an algorithm that automatically invests pension capital with costs that stay under 10 basis points per year. When the participant retires, the total capital position is transferred to an annuity from which our performance can be measured by the replacement rate: the ratio between earnings before and after retirement. A limited investment universe is used including 10 indices on the following asset classes: equities1, real estate, commodities, credits/treasuries and cash. The solution is based on a mean variance strategy that is tested on historical and simulated data. Our datasets are simulated by a geometric Brownian motion, general historical simulation and extensions based on an exponential weighted moving average where recent or low interest rate scenarios get more weight. Compared to our benchmark APG our results score well on mean and median values but fail on the dispersion of the results where low Values at Risk are the result. As the risk on insufficient results is substantial APG’s own performance is still preferred due to the decent, stable results.
4
Table of Contents
MANAGEMENT SUMMARY ... 2
LIST OF FIGURES ... 6
LIST OF TABLES ... 6
PREFACE ... 7
1.
RESEARCH DESIGN ... 8
1.1.
C
ONTEXT OF THE STUDY... 8
The company APG ... 8
1.2.
R
ESEARCH OBJECTIVE... 10
1.3.
R
ESEARCH QUESTIONS... 11
1.4.
R
ESEARCH STRATEGY... 12
Methodology and data collection ... 12
Outline thesis ... 13
2.
LITERATURE REVIEW & THEORETICAL FRAMEWORK ... 14
2.1.
A
LGORITHMIC TRADING AND INVESTING... 14
Introducing Algorithmic Trading ... 14
Key stages in AT ... 15
From algorithmic trading to the Basis Zero algorithm ... 17
2.2.
T
HE INVESTMENT OBJECTIVE... 18
Pension Pillars ... 18
Introduction in retirement schemes ... 19
Goals of a pension system ... 19
How to measure a good pension? ... 20
The investment objective in the Basis Zero algorithm ... 21
3.
CHARACTERISTICS OF THE ALGORITHM ... 23
3.1.
S
COPE OF THE INVESTMENT UNIVERSE... 23
3.2.
D
ATASET ASSET CLASSES... 26
3.3.
P
ORTFOLIO CONSTRUCTION MODELS... 26
Selection of the model types ... 26
General model assumptions ... 27
Description of the model characteristics ... 27
3.4.
C
ONSTRAINTS... 31
Transaction costs ... 31
Portfolio rebalancing ... 32
4.
DATA GENERATION AND TESTING ... 34
4.1.
T
HE PARTICIPANT... 34
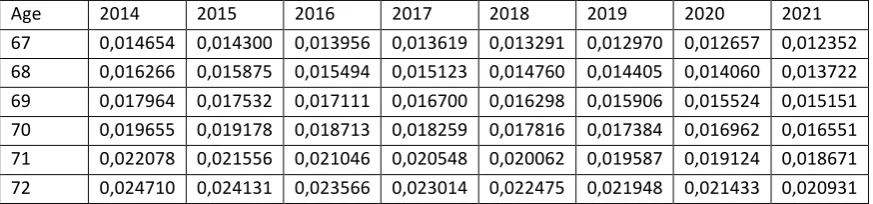
Survival tables ... 34
From annuity to replacement rate ... 35
4.2.
F
INANCIAL MARKETS... 36
Historical simulation ... 37
Extensions of the historical simulation approach ... 38
Geometric Brownian motion ... 38
Interest rate simulation ... 39
4.3.
T
ESTING... 40
5.
RESULTS ... 41
5
5.2.
E
VALUATION CRITERIA AND BENCHMARK... 41
5.3.
H
ISTOGRAMS AND DESCRIPTIVE STATISTICS... 43
Historical simulation ... 43
Historical simulation – Exponential Weighted Moving Average ... 44
Historical simulation - Exponential Weighted Moving Average on the Interest Rate ... 45
Geometric Brownian motion ... 47
5.4.
S
IMULATION ON REAL DATA... 48
5.5.
S
MOOTHING OF THE RESULTS... 48
5.6.
A
SSET MANAGEMENT COSTS... 49
5.7.
S
ENSITIVITY ANALYSIS... 49
6.
CONCLUSIONS, LIMITATIONS AND FUTURE RESEARCH ... 50
6.1.
C
ONCLUSION... 50
6.2.
L
IMITATIONS... 51
6.3.
F
UTURE RESEARCH... 52
7.
REFERENCES ... 53
APPENDICES ... 55
A
PPENDIX1
–
T
HEB
ASISZ
ERO CONCEPT... 55
A
PPENDIX2
–
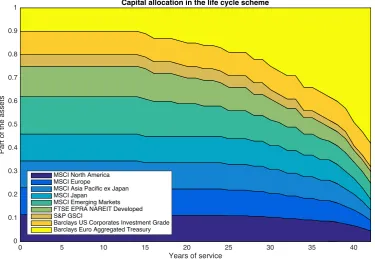
LIFECYCLE DATA... 56
6
List of figures
Figure 1: the Basis Zero principles. ... 9
Figure 2: phase 2 of the Basis Zero experiment will focus on asset management algorithms and blockchain technology. The focus in this report is on workstream 2: the radical outside solution. ... 10
Figure 3: graphical representation of the research methods. ... 12
Figure 4: create, test and evaluate. ... 13
Figure 5: the major components of an AT system. ... 16
Figure 6: the three traditional pillars made up to six pillars. ... 19
Figure 7: Total return indices over the specified period. ... 26
Figure 8: the portfolio construction models. ... 27
Figure 9: lifecycle capital allocation over time. ... 31
Figure 10: Nominal interest rate term structure of pension funds (zero coupon). ... 36
Figure 11: an example of simulated total return indices by the historical simulation approach. ... 37
Figure 12: an example of an interest rate simulation by the Vašíček method over the first 100 months. ... 40
Figure 13: the total capital position increases faster compared to the contributions. ... 41
Figure 14: histograms presenting the replacement rates by using the historical simulation approach. ... 44
Figure 15: histograms presenting the replacement rates by using the exponential weighted moving average historical simulation approach. ... 45
Figure 16: histograms presenting the replacement rates by using the exponential weighted moving average historical simulation approach based on the interest rate. ... 46
Figure 17: histograms presenting the replacement rates by using the geometric Brownian motion. ... 47
List of tables
Table 1: the asset classes and several corresponding indices that will be used. ... 23Table 2: correlation matrix. ... 25
Table 3: part of a mortality table for males. ... 35
Table 4: statistics of the historical simulation approach. ... 43
Table 5: statistics of the historical simulation approach by using an exponential weighted moving average. ... 44
Table 6: statistics of the historical simulation approach by using an exponential weighted moving average on the interest rate. ... 45
Table 7: statistics of the geometric Brownian motion simulation. ... 47
Table 8: performance of the investment models and APG over the 12-year period. ... 48
Table 9: transaction costs of the models. ... 49
7
Preface
To complete my master Industrial Engineering and Management I had the opportunity to write my master thesis at APG. I tried to explore the possibilities in the field of algorithmic pension investing as part of a new pension product originated from the Basis Zero experiment.
To make this project to a success I want to express my gratitude to a number of people. I want to thank my supervisor from APG, Hidde Terpoorten, for his help, feedback and positive views enabling me to complete this assignment. In addition to him also my colleagues of Group Risk and Compliance and my fellow interns (especially Jorgo Goossens) that were seated at the 17th floor of the Symphony building. I also want to thank Eric de Rouw from Asset Management and Alwin Oerlemans, Cateautje Hijmans van den Bergh, Joep Beukers, Loes Frehen and Chris Veerkamp for their help, suggestions and feedback. I hope this report is helpful to you. I would not have been able to write this thesis without the support of Berend Roorda. I experienced a very positive cooperation as you took plenty of time to help me during this assignment. I want to thank Reinoud Joosten for his comments that improved my final version. Most of all I like to thank them for their courses the past years that I really enjoyed.
Finally I would like to thank my mother and brother for their support during my studies. Maarten de Wit
8
1. Research design
The research for this master thesis has been conducted at the All Pensions Group, APG. This report presents a proof of concept on the introduction of algorithmic investing within the scope of the Basis Zero experiment at APG.
In this chapter we will explain the research design. Verschuren and Doorewaard (2010) argue that the design of research activities involves two separate sets of activities. The first set involves determining everything that should be achieved through the research project. This is called the conceptual design of the research project. The second part, the technical research design, concerns the activities to realize this.
The chapter starts with the conceptual design and more specifically with a short introduction to the context of the assignment. In Section 1.2 we will describe the research objective after which the research questions are covered in Section 1.3. We will explain the technical design in Section 1.4. This section includes the research strategy, the method of data collection and the outline of this thesis.
1.1.
Context of the study
The company APG
Financial services provider APG offers services for pension funds such as pension administration, pension communication, asset management and executive consultancy and offers individuals supplementary products on the pensions market. APG focuses on products in the second pension pillar and performs these activities on behalf of clients and their participants in the sectors of education, government, construction, cleaning and glass cleaning, housing associations, energy and utility companies, sheltered employment and medical specialists. APG manages about € 443 billion (August 2016) in pension assets for these sectors. APG provides pension for one in five families in the Netherlands, which is equal to approximately 4.5 million participants. APG has offices in Heerlen, Amsterdam, Brussels, New York and Hong Kong (APG, 2016).
APG Asset Management is an investor focused on pension investing. APG tries to leverage experience, expertise and innovative power to invest the pension assets of its clients and their participants cost effectively. APG wants to contribute to a qualitative, affordable pension for the clients’ participants by achieving long-term stable returns while taking responsible risks. Last but not least APG wants to contribute to a sustainable world that is integral part of the investment process.
This research on algorithmic investing is not executed at APG Asset Management but at APG Group level, in particular at the department Group Risk and Compliance (GRC). The most important tasks of GRC are the development of risk management and compliance frameworks, giving independent advice and challenging the management on the implementation of these frameworks. Monitoring and reporting on the application of the frameworks also belongs to the responsibilities of GRC.
Innovation activities within APG
Based on the rapidly changing world in general, and the pension world in particular, APG believes that some of the products in their current form and context will lose their competitive edge and will be no longer relevant in the future. You might think of developments in the labour market (e.g. in robotics), in the field of health (e.g. changing life expectancies) and technology (e.g. artificial intelligence), but also in terms of changes in the current pension system. To remain a relevant player now and in the future APG works on innovation.
9
When it comes to innovation APG want to develop its current practice as well as create entirely new products and services. Ideas need exploration and development to grow to the so-called ‘experiment phase’. When an idea is sufficiently developed, and enters the experiment phase, the quest for sponsors, team members, internal knowledge, external partners and new technologies will be started. After passing the ‘delivery phase’ the experiment will be absorbed within the organization or continues as an independent unit with funding from the innovation fund.
Problem description
The innovation activities within APG have led to multiple experiments to improve current or create new products and processes. One of these experiments is “Basis Zero: 10-10-10”. Goal of this experiment is the development of a new basic pension product that needs to meet the three requirements that are presented in Figure 1. The concept should be explicable within 10 lines2, with maximum asset management costs of 10 basis points a year and its execution costs should not be higher than 10 euro a year. In summary, a simple and inexpensive product that still offers appropriate quality features.
Figure 1: the Basis Zero principles.
Within the original experiment there were three schools of thought that were used to further develop the product. These scenarios are described by the following pseudonyms: ‘Heerlen’, ‘Groningen’ and ‘Rottumerplaat’. The ‘Heerlen’ school of thought refers to execution of the new product by using current APG knowledge and infrastructure. A solution that remains close to home.
Groningen is already a bit more distant from current practices. In this scenario a new external basis will be built that will be used to create a new basic pension provider. The scenario’s ‘Heerlen’ and ‘Rottumerplaat’ both describe the execution of asset management as well as the execution/administration problem of the experiment (i.e. block 2 and 3 in Figure 1). The Groningen scenario only describes the administration part but will not develop a solution on asset management.
Finally ‘Rottumerplaat’ represents a scenario that is furthest removed from the current situation. Here a whole new pension provider will be created: a pension provider 2.0. On the uninhabited island the new pension provider is built from scratch, not using any current APG systems or infrastructure. As Rottumerplaat is uninhabited every action needs to be automated. In this thesis the focus will be on the latter scenario.
The idea is a result of the desire to create a simple and inexpensive pension product. Simplicity is reflected in a collective product without individual choices that should be easy to understand. The inexpensive product is the result of automated administration and digital communication by using blockchain technology. However, the administration and communication part of the experiment are beyond the scope of this research. The focus will be on the last part of the proposition: automated asset management by using algorithms.
2
10
Contributions to APG
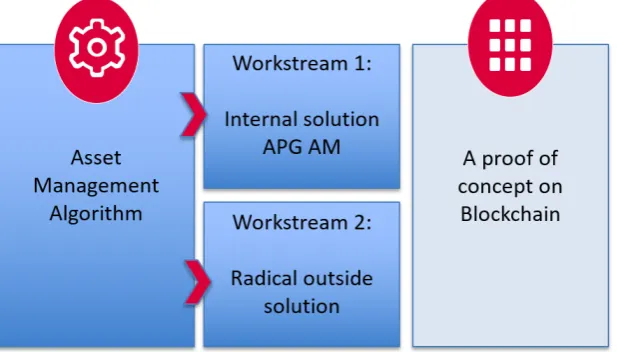
The bigger picture of the Basis Zero experiment is shown in Figure 2. The figure shows the two workstreams on asset management: workstream 1 on the Heerlen scenario and workstream 2 on the Rottumerplaat scenario. In this report the focus is on the ‘radical outside solution’ without a clear link to current asset management practices. Within the Asset Management department itself, another part of the experiment is executed by examining if it is possible to invest at a maximum of 10 basis points by using current practices; the ‘Heerlen’ school of thought.
[image:10.595.146.455.210.386.2]In other parts of the experiment a team is engaged in the development of a pension administration based on blockchain technology. This should give an answer on the question if 10 Euro administration costs are feasible.
Figure 2: phase 2 of the Basis Zero experiment will focus on asset management algorithms and blockchain technology. The focus in this report is on workstream 2: the radical outside solution.
1.2.
Research objective
The objective of this thesis is the development of an algorithm. In line with the Rottumerplaat philosophy the algorithm should be able to invest independently and automatically incoming contributions or divest funds when distributions exceed contributions - while keeping operating, transaction and management costs low. These investment decisions need to be optimised on a pension objective and should be executable within a certain investment universe.
11
1.3.
Research questions
To achieve the research objective several research questions are formulated. The main research question is: Is it possible for APG to create and implement an algorithm that automatically makes investment decisions - given a certain investment universe and the Basis Zero philosophy - with a pension objective that achieves adequate performance?
To answer the main research question several sub questions are formulated. These questions are selected and formulated in a way that the answers will yield information that is useful or necessary for accomplishing the research objective.
1. What is algorithmic trading and how can it be applied in the context of pension investing?
The answer on the first question provides a better understanding of the algorithmic trading environment from a literature perspective. It should introduce methods that can be used to apply at the problem in this thesis.
2. What is the investment objective?
The answer on the second question gives more information about investing with a pension objective. For the participant the pension capital will be part of the second pension pillar that is additive to the first pillar. This means the pension we are talking about is additive to the AOW; the general old age pension act that should provide elderly with a basic pension. A target needs to be set where the algorithm should focus on. In addition, it is debatable how far results may deviate from this target to remain solid.
3. How can an algorithm be used to automate the investment process when taking the pension objective into account?
When answering this question an algorithm has to be delivered that combines aspects of algorithmic trading and investing with a pension objective. The algorithm should be able to automatically make decisions on how to invest incoming premiums given a certain investment universe and the objective. These decisions will be based on different selection rules. Relevant restrictions need to be taken into account when developing the algorithm.
12
1.4.
Research strategy
Methodology and data collection
Different research methods will be used depending on the sub-question that needs to be answered. These are described in this section and presented in Figure 3. The first sub question about algorithmic trading will be answered by a review of existing literature. By reviewing the literature, an overview of, and insight in algorithmic models and their applications will be obtained.
The approach to answer the second question is based on literature as well. In addition the principles found in the literature review will be assessed by a consultation of experts within APG. This combination gives the possibility to couple literature and the view of APG to answer the question.
The knowledge gathered in the first two questions provides the foundation of question three. In the third question the algorithm will be created. When developing the algorithm the investment universe has to be defined first to be able to determine the scope of our investment possibilities. Furthermore for practical usability several constraints need to be included. This will be at least transaction costs and rebalancing criteria as well as limitations on the short sale of securities. When assessing the selection criteria and the overall performance of the algorithm to answer question 4, (simulations based on) historical data will be used. This information is used to explore the performance of the algorithm and compares its performance to the performance of APG that will be used as a benchmark.
13
Outline thesis
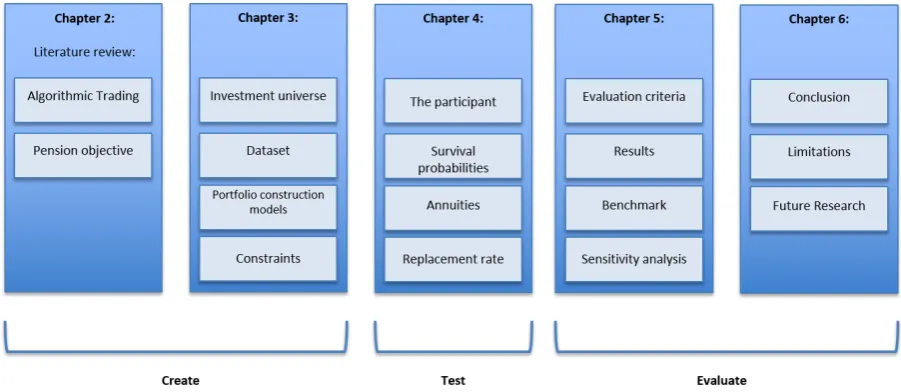
[image:13.595.72.523.264.460.2]This section gives an overview of the different chapters of this master thesis. Here, in the first chapter we introduced the company APG including the challenge underlying this report by illustrating the research design. The first part of Chapter 2 will be based on a literature review of relevant papers on the subject of algorithmic trading. In the second part of Chapter 2 we will focus on the investment objective that needs to be determined, keeping the pension setting in mind. The first two research questions should be answered in Chapter 2. In Chapter 3 we will specify the investment universe followed by information about, for example, transaction costs and rebalancing requirements, that need to be kept in mind when developing the algorithm. In Chapter 4 the algorithm will be tested and evaluated by performing a case study based on real data and simulated time series. This will be the proof of concept of the algorithm and enables us to answer research question 4. Then we will present our results in Chapter 5. Chapter 6 will contain the conclusion and there we will answer the main research question. Limitations of this research and ideas for next steps/future research will be presented as well in Chapter 6. Chapter 2 and 3 provide the basis to create the algorithm, in Chapter 4 it will be tested and in the Chapters 5 and 6 the behaviour will be evaluated. This is shown schematically in Figure 4.
14
2. Literature review & theoretical framework
In this chapter we will answer the first and second research question. In the first part a literature review is conducted to introduce algorithmic trading. In the second part we will focus on the investment objective of the algorithm and therefore argue what characteristics a good pension should meet. This is done by a combination that starts with literature review, where after the results will be discussed with industry experts from APG. This assures the final algorithm of pursuing the right goals.
We will conclude both sections by a paragraph where the most important insights of each section will be summarized. These insights contribute to the development of the algorithm in subsequent chapters.
2.1.
Algorithmic trading and investing
The first section of the literature review will focus on literature in the field of algorithmic trading and how it can be used in algorithmic investing. We will describe the five-step trading process by Treleaven (2013) and explain how it will be used in the remainder of this thesis. The trading process is very comprehensive, i.e. it includes many advanced steps, which enforces us to choose specific parts of the process and scope to those components that will be included in the algorithm.
Introducing Algorithmic Trading
Advances in telecommunications and computer technologies have created increasingly global, dynamic and complex financial markets (Nuti, 2011). This stimulated trading by computer programs and subsequently the rise of systems for Algorithmic Trading (AT) to automate one or more stages of the trading process. Treleaven (2013) defines algorithmic trading as any form of trading using sophisticated algorithms (programmed systems) to automate all or some part of the trade cycle. AT usually involves concepts of learning, dynamic planning, reasoning and decision taking.
Within the electronic trading environment there are several closely related terms that are sometimes confused. These include electronic trading, order management systems, automated trading, systematic trading, and algorithmic trading. Broadly, electronic trading is a method of exchanging securities, stocks, bonds, foreign exchange and derivatives. Within electronic trading, specialized programs bring together buyers and sellers through electronic media to create an exchange. Order management systems facilitate and manage order execution, generally connecting to one or more electronic exchanges. Automated trading systems usually refer to trade execution programs that automatically submit trades to an exchange. The distinguishing feature of algorithmic trading systems is the sophistication of their analysis and (speed of) decision-making. Broadly, these systems are deployed for highly liquid markets and high frequency trading, such as equities, futures, derivatives, bonds and foreign exchange (Nuti, 2011).
An algorithm can be described as a set of instructions for executing a specified task. A trading algorithm therefore is a computerised model that incorporates the steps required to trade an order in a specific way. Trading via algorithms requires investors to first specify their investing and/or trading goals in terms of mathematical instructions. Dependent upon investors’ needs, customized instructions range from simple to highly sophisticated. After instructions are specified, computers implement those trades following the prescribed instructions (Kissell, 2014). The instructions can become quite complex for an algorithm to react to ever changing market conditions. These instructions determine the type, price and quantity for each order, often based on a mixture of historical and live market data (Johnson, 2010).
15
Key stages in AT
Several papers (e.g. Johnson, 2010, Nuti, 2011, Treleaven, 2013) describe the trading process that can be roughly divided into diverse stages. We will continue with the process as described by Treleaven as he provides the most complete overview while others do not include all stages he covers. The trading process as described by Treleaven has a clear structure and describes five key stages of the investment process:
1. Data access/cleaning: the first stage obtains and cleans financial, economic and social data that will drive AT.
2. Pre-trade analysis: the second stage analyses properties of assets to identify trading opportunities using market data or financial news (data analysis).
3. Trading signal generation: identifies the portfolio of assets to be accumulated based on the pre-trade analysis (what and when to trade).
4. Trade execution: executing orders for the selected asset (how to trade).
5. Post-trade analysis: analyses the results of the trading activity, such as the difference between the price when a buy/sell decision was made and the final execution price (trade analysis).
Here the stages are presented as five separate phases. However, in practice several stages may overlap each other. Although one might think of AT as automating all stages, much of the activity in the industry is devoted to the data access/cleaning and pre-trade analysis stages, with the latter stages of the trading process being supervised by humans (Treleaven, 2013).
Data access/cleaning
Clean data is of major importance in AT for the analysis of a successful trading system. It may include financial or economic data, like price data on financial instruments but may also contain data from news sources or social media. Data can be gathered real time through data feeds (i.e. from exchanges) or can be accumulated and obtained as historical data. Unprocessed or raw data need to be cleaned by removing erroneous data that may be the source of errors in the subsequent process. Especially buying cleaned data is expensive and cleaning data is very time consuming. However it is essential due to the sensitivity of trading algorithms.
Pre-trade analysis
The next stage is the pre-trade analysis where an analysis is made whether several assets offer trading opportunities by using data analysis.
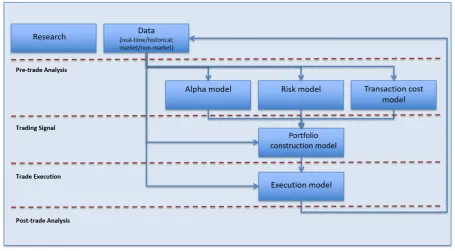
The pre-trade analysis comprises three main components: the alpha model, the risk model and the transaction cost model. The alpha model is a mathematical model designed to predict future behaviour of the financial instruments that the algorithmic system is intended to use. The risk model evaluates the levels of risk/exposure associated with a financial instrument. In the transaction cost model the potential costs related to trading the instruments are calculated. We will describe each component separately in the next sections.
Alpha model
In pre-trade analysis, and specifically the Alpha model, real-time and historic data will be analysed to identify potential trade opportunities. Nuti (2011) and Treleaven (2013) distinguish three principal techniques:
- Fundamental analysis: in a fundamental approach variables are evaluated that can affect a security’s value. This can include macroeconomic factors (e.g. industry and overall economy conditions) as well as company specific factors (e.g. financial reports).
- Technical analysis: This approach is concerned with the analysis of trends and pattern recognition in charts.
16
Figure 5: the major components of an AT system (Treleaven, 2013).
There are two strategic approaches within the alpha model: a theory driven and an empirical strategy. In the theory driven model a hypothesis is chosen that tries to describe the most likely behaviour of securities. By modelling this behaviour the hypothesis will be accepted or rejected. Examples are a momentum and a mean reversion approach that hypothesize market behaviour (theory-driven) based on price data. In an alternative empirical strategy, the algorithm will be used to identify a pattern in the underlying data of a security.
Constructing the Alpha model and more specifically setting the variables can be a highly complex task. Numerous factors influence the actual algorithm implementation: forecast goals (like direction, magnitude, duration and probability), forecast time horizon (such as millisecond, day, week, month), the mix of instruments, the data available, actual setting of the model’s variables and the frequency of running the model (Treleaven, 2013).
Risk model
The risk model focuses on risks associated with a financial instrument and on the relevant factors that may affect the economic climate and so the future value of the (portfolio of) financial instruments. It tries to limit the amount of risk (e.g. volatility or leverage) and limits the type of risk by limiting whole types of exposure. Where the alpha model may propose many financial instruments in a particular industry the risk model is able to set a constraint that limits risks of the total exposure to that industry.
Transaction cost model
17
Trading Signal generation
In this stage of the trading process the portfolio construction model collects the results of the alpha, risk and transaction cost models. Based on this collection of data it selects the optimal portfolio (in terms securities and in what quantities they should be owned) for the next time step to maximize profit, limit risk and minimize transaction costs.
There are multiple portfolio construction models that can broadly be subdivided into two types of models: rule-based models and optimisation models. A rule-rule-based model is a heuristic specification on how to assemble a portfolio with multiple instruments. An optimisation model uses an algorithm with an objective function. It iterates several portfolios until it finds the portfolio with, for example, a minimum variance level.
Both types of models are used, but in Chapter 4 we will provide a detailed description of the portfolio construction models that we will use.
Trade Execution
When the trading signal is generated and the optimal portfolio is constructed this model takes decisions regarding the execution of a transaction. Think about the trading venue (e.g. NYSE, NASDAQ), execution strategies (e.g. smart order routing) and order types (e.g. market or limit).
Post-trade analysis
After the trade is executed the results are evaluated during the post-trade analysis. An example is the evaluation of the difference between the expected price and the actual traded price.
From algorithmic trading to the Basis Zero algorithm
This section provided an overview of the concept algorithmic trading and covered the methods and stages that are part of the trading process. The next step is the application of this information in the development of the Basis Zero algorithm. Within the experiment/thesis not all phases of the trading process can be covered. As simplicity as well as feasibility is important, we decided to reduce the scope to a specific part of the process. Our contribution focuses on the composition of portfolios over time where aspects of the pre-trade analysis as well as the trading signal generation will be included. Focussing on those stages will result in an algorithm where the most essential components are included that should result in an algorithm within the philosophy of Basis Zero.
18
2.2.
The investment objective
The second section of the literature review will focus on literature in the field of pensions. How is the pension system arranged and what is considered to be a good pension? In particular this last question is important when setting a target for our algorithm. The found objective is discussed and approved by APG experts and used in the successive chapters of this thesis.
Pension Pillars
Different types of pension schemes are usually grouped into multiple pillars of a pension system. Many systems distinguish between statutory, occupational and individual pension schemes. It is also common practice to distinguish on voluntary and mandatory schemes. The Dutch pension system consists of three pillars: the state pension, a collective second pillar and individual (sometimes additional) third pillar pension products. The focus of this thesis is on a second pillar product.
The first pillar is the state pension (AOW), a pay-as-you-go system that is the foundation of the old-age pension benefits. The AOW provides a basic income that is linked to the minimum wage level and the number of years that a person has resided in the Netherlands.
Single pensioners who have lived in the Netherlands between 15 and 67 receive 70% of the minimum wage; couples receive both 50% of the minimum wage. For people with a low or no pension income and (almost) no wealth the first pillar will be supplemented with social assistance to guarantee a social minimum.
The first pillar pension only provides a limited part of all old age benefits and can be supplemented with benefits from the second and third pillar.
Collective pension schemes are represented in the second pillar and are administered by pension funds or insurance companies. The second pillar accommodates capital-funded occupational pensions of which the primary responsibility lies at the level of employees and their employers. The pensions are financed by contributions of the participants, their employers and by the returns on investment over these contributions. Occupational pensions in the Netherlands have a mandatory nature, such that 90% of all employees have pension schemes with their employer (Knoef, 2014).
Up to the beginning of the 21st century, most pension plans aimed to pay a pension income of 70% of the final gross salary starting at the age of 65. From 2003 onwards, pension funds lowered their ambition and now mostly aim to pay 70% of their average career salary, instead of 70% of the final gross salary (Knoef, 2014). Recent economic instability also revealed the vulnerability to shocks in the financial markets. Many pension funds have difficulties achieving their ambitions and sometimes have too cut in pension payments.
In the arrangement of pension agreements social partners inevitably need to find the right balance between the aspired pension outcome, the degree of certainty of the pension outcome and the costs (the contributions). In particular, after the dotcom crises the real tradeoff between ambition, security and costs became clear.
19
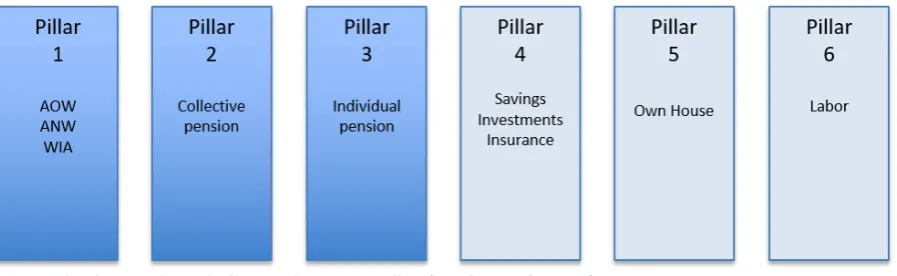
Figure 6: the three traditional pillars made up to six pillars (García-Huitrón, 2016).
Other pillars, like presented in Figure 6, can be found in housing wealth or an extension of working life. People who have paid off their mortgage can benefit from lower housing costs during their retirement. Although it is not commonly done by the current generation of elderly, people may move or use reverse mortgages to deplete housing wealth (Knoef, 2014). As already indicated the focus will be on the second pillar pension benefits: supplementary benefits to a basic income provided from the first pillar.
Introduction in retirement schemes
Retirement schemes may be classified according to how the benefits are determined. The two main categories are Defined Benefit (DB) and Defined Contribution (DC) schemes.
In a Defined Benefit scheme the benefits accrued are linked to earnings and the employment career of the participant. The future benefit is predefined and promised to the participant. Consequently it is the scheme sponsor who is bearing the investment risk and also longevity risk. If predictions about rates of returns or life expectancy are not met, the scheme sponsor must increase its contributions to pay for the resulting gap. Opposed to Defined Benefit schemes, there are Defined Contribution schemes where the level of contributions is predefined. This means no future benefit is promised and the pension level will depend on the performance of the investments and the contributions made to the scheme. The individual participant therefore bears the risk and needs to decide how to mitigate the risks.
A Collective Defined Contribution (CDC) scheme is a hybrid scheme additional to the traditional DB and DC schemes. It combines the limited risks of fluctuating pension commitments for an employer with advantages of a collective pension scheme. In a CDC scheme the pension capital is based on the salary and the number of years someone is employed/participates in the scheme like in the DB scheme. The contributions are fixed for many years. That means when they are insufficient, the benefits will be lower than originally expected.
Basically a DC scheme will be the foundation of the algorithm that will be built. Extensions, like discussed in Chapter 5 on the results, can provide a collective touch to the product.
Goals of a pension system
According to Hinz and Hollman (2005), the primary goals of a pension system should be to provide an adequate, affordable, sustainable and robust retirement income.
Adequacy is reflected in a system that provides benefits to the population to prevent old-age poverty on an absolute level and in addition to provide reliable means to smooth lifetime consumption for the vast majority of the population, i.e. replacing sufficient lifetime earnings. This includes assurance that those individuals that live beyond the norms from the risk of longevity.
The system should also be affordable, one that is within the financing capacity of the individual participants and society. It should not unduly displace other social or economic imperatives or have untenable fiscal consequences.
20
A sustainable pension is a pension that is financially sound, can be maintained over a foreseeable time horizon under a broad set of reasonable assumptions. A sustainable pension should be structured in a way that the financial situation does not require unannounced future hikes in contributions or unforeseen cuts in benefits. In other words, all adjustments that are needed to keep the pension system financially sound (i.e. changes in contributions, benefits or retirement ages) should be included in the design of the system. This includes mechanisms to adjust the program to periods of economic depression.
Finally, a robust pension is one that is able to withstand major shocks, like those from economic, demographic and political volatility. The system must have the capacity to remain viable when unforeseen circumstances arise. In this regard, the most important outcome is the ability to sustain income replacement targets in a predictable manner. A central element in meeting this goal is a credible analysis across the full range of likely scenarios, over the full term required to reach long-term stability. To fulfil this goal, we need to apply sophisticated modelling tools to present analyses that incorporate a significant range of variation in basic assumptions or scenarios to demonstrate the viability of our system over the long term.
In a publication of the Pensions Institute (2016), we find several criteria for a good DC pension scheme. The Pensions Institute set up a list and the most relevant criteria can be found in the list below. The pension scheme should:
• Deliver adequate and sustainable (stable) pensions
• Provide an investment strategy that reflects the scheme member’s attitude to and capacity to take risk and generates a return at least as high as inflation.
• Provide value for money for every euro saved in the scheme • Have transparent charges and costs
• Provide reliable and efficient administration • Deliver effective communications to members
Now we gathered several qualitative criteria a good pension scheme should meet, but still a good pension is difficult to define; it is not defined in policy or regulation. Even between people the definition of a good pension may vary because individual needs may vary. It is also the question if good means if participants get what they need, rather than what they want. When developing a model and in particular to evaluate the performance we want to work towards a quantitative measure that enables us to assess the performance of the model in an objective manner.
How to measure a good pension?
What is the right target to aim for when it comes to retirement income? Knoef (2013) conducted a study to find out what an adequate level of resources for retirees should be. She concluded a variety of standards could be chosen against which to judge adequacy. The article is focused on two measures, the Life Cycle Hypothesis and an absolute or social replacement rate.
The Life Cycle Hypothesis is a theoretical framework that is able to assess the adequacy of savings (Banks et al., 1998). In the model, consumption is not based on current income, but by expected lifetime resources. It should be optimal for persons or households to save (or borrow) to the extent that, after discounting, the marginal utility of consumption is smoothed over the life cycle.
Another measure is the replacement rate. Knoef (2014) distinguishes between two different replacement rates: an absolute and a social replacement rate. In the second approach a social standard is set for adequacy. The retirement income is then considered adequate when it is equal or greater than poverty levels of income (Haveman et al., 2007).
The (absolute) replacement rate generally refers to an indicator showing the level of pension income as a percentage of earnings before retirement. The replacement rate measures the extent to which a pension system enables participants to continue their standard of living when moving from employment to retirement. This methodology assumes a gradual wage growth over time without for example a peak or an extraordinary pay rise shortly before retirement. The conventional replacement rate formula is given in Formula 2.1:
Conventionalreplacementrate= !"#$$!"#$%&!" !"#$%!"#$!"!"#$!"%"&# (!.!.!" !"# !")
21
The most commonly advocated benchmark in literature is having a retirement income of at least 70% of gross final annual employment earnings (e.g. Haveman et al., 2007, Goudswaard et al., 201 MacDonald et al., 2014). This amount is regarded as the income needed to sustain an individual’s standard of living after retirement. This benchmark is used by financial planners, pensions plan advisors, academics, public policy makers and much of the research that predicts workers will be financially unprepared for an adequate retirement (MacDonald et al., 2014).
The 70% is based on the idea that retirees will pay lower taxes, will not be saving for retirement anymore, have often paid off their mortgage and no longer need to support children nor pay expenses related to their former jobs. Related to the Life Cycle Hypothesis, Boskin and Shoven (1987) conclude that a replacement rate of less than unity is consistent with the Life Cycle Theory.
The method of the replacement rate is simple, however there is also criticism on the measure and the 70% norm of a good pension. Several studies have been sceptical if the replacement rate indeed provides the benchmark for adequacy where we are looking for (e.g. Vanderhei, 2006, Scholz and Seshadri, 2009, MacDonald et al., 2014).
MacDonald et al. (2014) conclude that people who attain a replacement rate of 65-75% of gross final earnings will experience a large range of changes of their average living standards after retirement when the traditional replacement rate is used. As MacDonald et al. describe, it is clearly problematic when the living standard is further reduced while the opposite, an improved standard could be the result of an over-sacrifice of welfare before retirement.
According to MacDonald et al. (2014) the problem lies in the computation of the replacement rate itself. It criticizes the measurement period and disagrees with not (accurate) incorporating many components of living standards or even omitting them from the equation. The article provides an extensive list of factors that should be included from which the most important are stated below:
1. Household-level differences in consumption needs due to family size (and changes over time in household size and composition)
2. Imputed income from owner occupied housing
3. Taxes (specifically the differentials in taxation year by year pre and post retirement) 4. Transfers – e.g. unemployment insurance, child benefits and social assistance
5. The accumulation and drawdown of non-traditional forms of savings (non-registered financial wealth/debt, and home-ownership equity)
Knoef (2014) continues naming the replacement rate as the key indicator of savings adequacy and retirement readiness. It stays the most used concept for evaluating participants’ likely living standard in terms of adequacy. In line with the philosophy of Basis Zero we also continue with this simple, easy explicable measure.
The investment objective in the Basis Zero algorithm
In this section the investment objective of the algorithm is set. The goal of the Basis Zero experiment is the development of a pension product that is easily explicable to its participants. Therefore it is a logical step to continue assessing the adequacy of the algorithm’s results based on the replacement rate. It is a simple, widely used measure in theory and is supported by APG for the purpose of this thesis.
The minimum acceptable replacement rate level is set at 60% but the objective of the algorithm will be a 70% replacement rate. There is a widely supported belief, a ‘rule-of-thumb’, that 70% of final earnings will provide a good pension.
22
sustainability and robustness checks cannot be confirmed here. To test those properties the algorithm needs to be exposed to several (simulated) scenarios that will be illustrated in Chapter 4.
23
3. Characteristics of the Algorithm
In Chapter 3 we will combine the information gathered in the first two sub questions to create the algorithm. This chapter starts with an outline of the investment universe to scope the investment possibilities. Afterwards we will present the dataset that is used as input in the decision-making or investment process. The asset allocation will be based on several portfolio construction strategies that are described in the third paragraph. Important constraints that need to be taken into account are transaction cost and rebalancing criteria. We will discuss those criteria in Subsection 4. We will complete this chapter with a graphical representation of the succeeding steps that the algorithm takes to invest or divest funds every time step.
In this chapter we want to provide an answer to Question 3. The associated deliverable is an algorithm that combines aspects of algorithmic trading and investing with a pension objective. The algorithm itself will not be presented in this report as it consists of too many scripts to present a clear overview. However the different steps in the algorithm takes will be explained by us as clear as possible after which the obtained results will be presented in Chapter 5.
3.1.
Scope of the investment universe
The original idea of the Basis Zero experiment was to arrange exchange connectivity to Euronext and be able to invest in every product traded on this exchange. For the purpose of this thesis the investment universe is limited to 7 asset classes and 10 liquid products on several corresponding indices. The tenth instrument is a(n approximated) ‘risk-free’ or cash instrument to which funds can be allocated. The indices are chosen based on geographical diversification in case of equities.
For the other asset classes, the most common instrument for each asset class will be used. The 10 instruments are chosen based on liquidity and therefore investment volumes do not form a restriction on our trading possibilities. The algorithm is designed in a way that makes expanding easy and the ten instruments are therefore only used as a scope for the purpose of this thesis.
We decided to use total return indices rather than price indices. While in a price index only the price movements are considered, in a total return index also cash distributions such as dividends are reinvested. Therefore the total return index is considered as a more accurate measure of performance compared to the price index where these distributions are ignored. Other criteria considered for the choice of the type of indices were the availability of sufficient historical data points and the need to comply with the general requirements that have to be met by a benchmark.
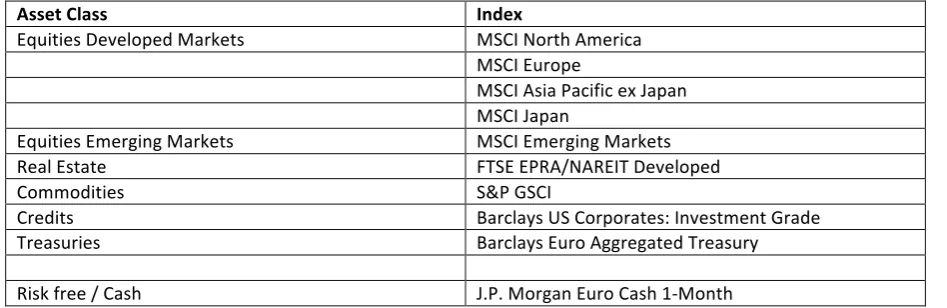
[image:23.595.63.537.601.755.2]The asset classes and indices that will be used in this thesis are shown in Table 1 and will be explained hereafter.
Table 1: the asset classes and several corresponding indices that will be used.
Asset Class Index
Equities Developed Markets MSCI North America
MSCI Europe
MSCI Asia Pacific ex Japan MSCI Japan
Equities Emerging Markets MSCI Emerging Markets
Real Estate FTSE EPRA/NAREIT Developed
Commodities S&P GSCI
Credits Barclays US Corporates: Investment Grade
Treasuries Barclays Euro Aggregated Treasury
24
Equities Developed Markets
The MSCI World index offers a broad global diversified index and represents large and mid-cap equity performance across 23 developed markets. It is one of the best-diversified, transparent and replicable indices and therefore will provide a good representation of this asset class.
To include geographical diversification over the different developed markets the index is broken down in four categories representing North America, Europe, the Middle East-Pacific (ex-Japan) and Japan.
Equities Emerging Markets
For the emerging markets the MSCI index also offers a broad and diversified index that gives a representation of several countries in South America, Europe, the Middle East & Africa and the Asia region.
Real Estate
The FTSE EPRA/NAREIT Global Real Estate Index and the S&P Global Property Index are the most commonly used indices with the widest geographical coverage for global listed real estate. The FTSE Index is preferred as it sets some more stringent rules on minimum volumes, what better suits the investment portfolio of a pension investor like APG.
Commodities
Commodity futures are the most efficient way of investing in commodities compared to physical investing in commodities. The S&P GSCI Total return Index is the most well-known, prominent global commodities futures index. It uses a 5-year moving average value of each commodity as weighting factor that results in a large (60%) weight on the energy market. This makes the index not very diversified; however still representative for the commodity market.
Credits
For credits the Barclays US Corporates Investment Grade index is chosen as index. It reflects the benchmark of customer ABP and meets the general requirements that may be imposed for benchmarks whereby sufficient historical data is available.
Treasuries
The main goal of investing in treasuries is the preservation of capital and liquidity. The choice was made for treasuries in the local currency, Barclays Euro Treasuries Bond Index. APG benchmarks its performance for 50% on this index and for the other half on the Barclays Global Majors Bond index with fully hedged currency risk.
Risk free / cash
For the risk-free option we choose to use the J.P. Morgan Euro cash 1-month total return index.
Several asset classes (private equity, infrastructure, hedge funds and several debt instruments) are not included in our asset pool for various reasons. Some classes are not represented well by a corresponding index, like private equity and infrastructure investments (due to the deal-driven nature). Another reason is our self-imposed limit on 10 indices to scope the investment possibilities. Therefore the natural choice is made to prefer assets like commodities and real estate above an asset class like emerging markets debt.
25
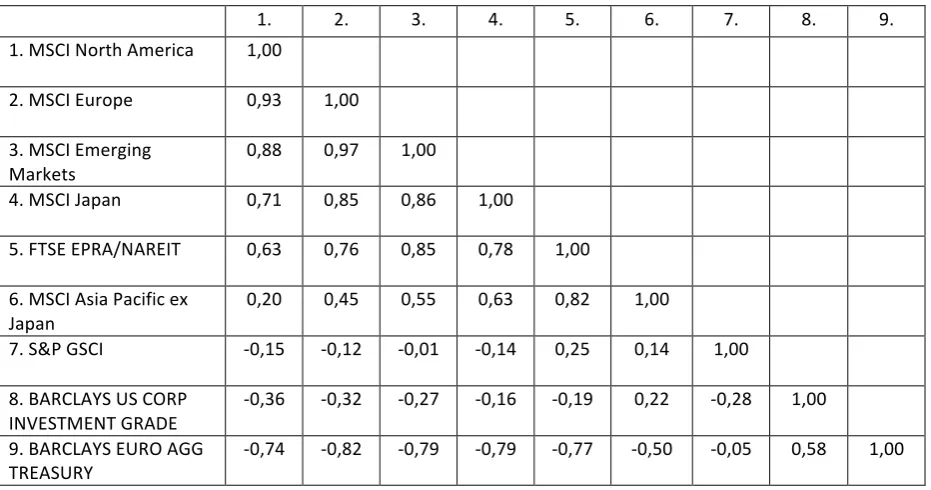
Correlations
Based on our complete dataset of returns we computed the correlations between the indices and present them in Table 2. One correlation matrix is used, that means no extra attention for tail correlations or changing correlations is taken into account.
Note that two variables are uncorrelated if 𝜌=0. Otherwise they are correlated to a greater or lesser extent. When 𝜌=1 the two variables are perfectly correlated and move in the same direction. If 𝜌=−1 the variables move exactly the same in the opposite direction. From the table can be concluded that some assets or asset classes correlate substantially with each other while others do not. As expected, there are some high correlations between the equities. The exception is the Asia Pacific index that has a somewhat lower correlation compared to the other equities. The index that covers real estate investments (FTSE EPRA/NAREIT) also significantly correlates with the equity indices.
[image:25.595.67.533.285.530.2]The commodity index and the credits and treasuries show mainly negative correlations with other asset classes. The equity indices do not meet this criterion, but leaving them aside as individuals (and see them as one asset class) several low or negative correlations can be distinguished.
Table 2: correlation matrix.
1. 2. 3. 4. 5. 6. 7. 8. 9.
1. MSCI North America 1,00
2. MSCI Europe 0,93 1,00
3. MSCI Emerging Markets
0,88 0,97 1,00
4. MSCI Japan 0,71 0,85 0,86 1,00
5. FTSE EPRA/NAREIT 0,63 0,76 0,85 0,78 1,00 6. MSCI Asia Pacific ex
Japan
0,20 0,45 0,55 0,63 0,82 1,00
7. S&P GSCI -0,15 -0,12 -0,01 -0,14 0,25 0,14 1,00 8. BARCLAYS US CORP
INVESTMENT GRADE
-0,36 -0,32 -0,27 -0,16 -0,19 0,22 -0,28 1,00 9. BARCLAYS EURO AGG
TREASURY -0,74 -0,82 -0,79 -0,79 -0,77 -0,50 -0,05 0,58 1,00
The selected asset classes and their corresponding indices that will be used in the algorithm are described in this section. This provides the scope for the investment possibilities. In the next section we will specify our dataset more in depth.
26
3.2.
Dataset asset classes
We will use historical time series from the 10 indices presented in the previous section as our dataset. It includes monthly closing values from the indices ranging from January 31st 2002 to April 29th 2016. This results in a data set of 172 data points for each index retrieved from Thomson Reuters DataStream. In consultation with APG Asset Management this time frame is chosen based on the length of the period (to provide sufficient data) and actuality of the data (too old data does not provide a realistic picture of current markets anymore). The transition to the Euro currency is also excluded.
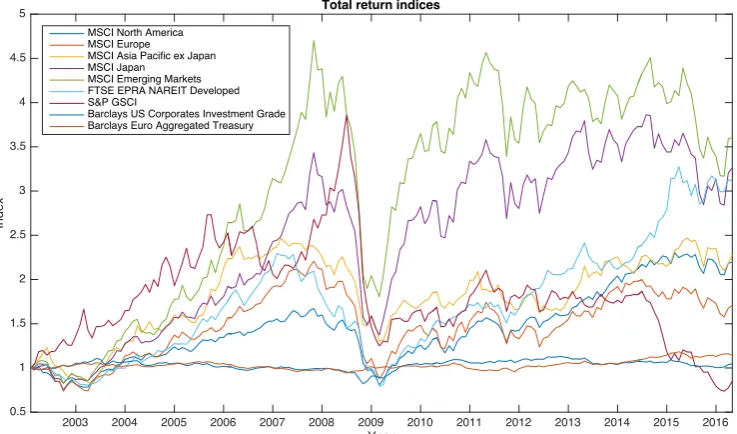
[image:26.595.115.484.255.472.2]In Figure 7 we show a graphical performance representation of the indices in the chosen time frame. This time frame includes periods of economic prosperity as well as periods of economic distress. The drop in the graph around 2008 corresponds to the collapse of the stock markets at that moment.
Figure 7: Total return indices over the specified period (source: Thomson Reuters DataStream).
In the algorithm price data are turned into return data that will be used as input for the investment models. To evaluate the performance of the portfolio construction models applied in the algorithm, time series will be created on which the algorithm is tested. Due to the period of financial distress both calm and volatile periods on the financial markets are included in the dataset. This may provide us several stress scenarios in the simulations. Chapter four will take a closer look on this topic.
3.3.
Portfolio construction models
Having described the investment instruments, we will now introduce the method to determine the asset weights within the portfolio during each month t. In Chapter 3 already two types of portfolio construction models were discussed: rule-based (heuristic) and optimisation models (objective function). For the algorithm we will introduce 3 rule based models and 2 optimisation models and evaluate them in the remainder of the thesis. Besides these models a life cycle model is included whereby the number of models equals 6.
Selection of the model types
When considering which models we should evaluate for the algorithm the paper of Treleaven (2013) provides several options that are widely used in an algorithmic trading environment. Various models focus on individual products (i.e. single stocks) in contrast to indices in the manner and scale they are used in our situation. An
2003 2004 2005 2006 2007 2008 2009 2010 2011 2012 2013 2014 2015 2016
Year 0.5
1 1.5 2 2.5 3 3.5 4 4.5 5
Index
Total return indices
MSCI North America MSCI Europe MSCI Asia Pacific ex Japan MSCI Japan
MSCI Emerging Markets FTSE EPRA NAREIT Developed S&P GSCI
27
example is a market-neutral strategy. A strategy that takes a long position in certain instruments while shorting others. The result should be a portfolio with no net exposure to market moves. As our focus is different, several strategies were considered not usable when keeping the Basis Zero vision in mind.
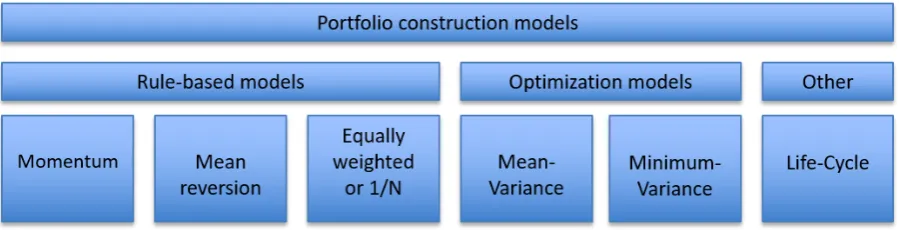
[image:27.595.74.524.279.394.2]We selected several models out of the paper of Treleaven (2013). In the category ‘rule-based models’, momentum, mean reversion and equal position-weighting (or1/N) meet the requirements. Opposite to the rule-based models there are optimisation models. Examples that are considered are Black-Litterman-, mean variance- and minimum variance optimisation. Treleaven (2013) mentions Black-Litterman optimisation as a sophisticated optimizer popular with AT and it looks like a nice extension to the traditional Markowitz models. However, the inclusion of the ‘view of the investor’ makes the model less applicable in the Basis Zero – Rottumerplaat philosophy where complete automation is important. Our algorithm should make its investments without a ‘view’ from any analyst or portfolio manager. Although there might be hundreds of other models, the chosen models meet the requirements and provide a good representation of the different possibilities proposed in literature. Some are rather simple; others use a more sophisticated approach but all of them are not too complex and explicable, in line with the Basis Zero philosophy. A schematic overview of the models is given in Figure 8and each model will be discussed in detail starting from the subsequent section.
Figure 8: the portfolio construction models.
General model assumptions
Every asset allocation model uses several assumptions. One of them is a long only constraint, i.e. the weights of each asset must be greater than or equal to zero; short positions are not allowed. Subsequently a budget constraint will be used, i.e. all weights must sum to one in order to allocate all funds to an asset class (risky as well as risk free assets). The risk free asset is included as part of the mean variance model.
All portfolio construction models use (simulated) time series with return data as input parameters. Section 4.2 will explain how these time series will be created. Based on these time series and the chosen model a recommended asset allocation is determined. Assets are invested according to the recommended allocation. However, the model may deviate from the recommended allocation to save on transaction costs. This is further described in the section on rebalancing costs starting from page 32.
Description of the model characteristics
The selected models, increasing in complexity, are described in the subsequent sections. It is the purpose of the sections to introduce our implementation of the portfolio composition techniques from literature. The first model is a simple equal position-weighting model that does not need much explanation. Passing the rule based models we arrive at Markowitz’ mean- and minimum-variance portfolio models.
Equal Position Weighting or 1/N