Abstract—3D Networks-on-Chip(NoC) reduce the length of global interconnects while achieve good scalability, high communication performance and low area cost. However, thermal issues become the major challenge due to the high power density and long heat dissipation path. The temperature of the core strongly depends on the task running on it and its location in the 3D NoC. Furthermore, the communication energy consumption is also an influence on the temperature of system. A proper task allocation algorithm can help to alleviate the potential thermal problem and reduce the communication energy, which might not be fully considered in previous work. In this paper, we propose a novel cluster-based thermal-aware task allocation algorithm (CTTA) which considers computation energy, communication energy, as well as heat dissipation effect locations together. Experiments showed that, in the 2x4x2 3D Mesh NoC, compared with Coldest-First task allocation algorithm, CTTA reduced communication energy consumption and peak temperature by 52.23% and 4.31K, respectively.
Index Terms—networks-on-chip, thermal-aware, task allocation, peak temperature
I. INTRODUCTION
ITH the combination of NoC and three-dimensional (3D) technologies, 3D networks-on-Chip(NoC) are attractive to the design of high-performance system-on-chips (SoCs)[1,2]. 3D NoCs reduce the length of global interconnects while achieves better scalability, higher communication performance and lower area cost when compared to 2D NoC[3]. However, 3D NoCs are likely to exhibit severe thermal problems due to high power density and long heat dissipation paths in the vertical directions [4].
Because of the Uneven temperature distribution in 3D NoCs, hotspots may be easily formed and lead to shorter chip Manuscript received July 19, 2016; This work was supported in part by the National Natural Science Foundation of China under Grants 61376025, and the Natural Science Foundation of Jiangsu Province under Grant BK20160806.
L. Shen is with the College of Electronic and Information Engineering, Nanjing University of Aeronautics and Astronautics, Nanjing , 211106, China, and with Jincheng college, Nanjing University of Aeronautics and Astronautics, Nanjing , 211106, China.(email:[email protected]).
N. WU is with the College of Electronic and Information Engineering, Nanjing University of Aeronautics and Astronautics, Nanjing, 211106, China (e-mail: [email protected]).
G. YAN is with the College of Electronic and Information Engineering, Nanjing University of Aeronautics and Astronautics, Nanjing , 211106, China, and with the College of Mathematics, Physics and Information Engineering, Anhui Science and Technology University, Fengyang, 233100,China.(email: [email protected]).
J.Zhang is with the College of Electronic and Information Engineering, NUAA, Nanjing, 210016, China (e-mail: [email protected]).
F.Zhou is with the College of Electronic and Information Engineering, NUAA, Nanjing, 210016, China (e-mail: [email protected]).
lifetime and worse system reliability.
To solve the thermal issue in 3D NoCs, dynamic thermal management (DTM) techniques such as dynamic frequency scaling(DFS) [5], dynamic voltage scaling (DVS) [6], dynamic voltage and frequency scaling (DVFS) [7] have been proposed in the literature. The DTMs are triggered to reduce the processor power and control the temperature when the system temperature reaches the threshold level. However, the DTMs usually result in performance degradation. On the other hand, the thermal-aware task allocation is another way to balance the temperature distribution. It not only improves the system performance under the same thermal limit, but also consumes less hardware implementation cost. Zhou et al. [8]
proposed an OS-level scheduling algorithm for thermal balancing on 3D chip multiprocessor, which leverages the inherent thermal variations within and across different tasks, and schedules them to keep the chip temperature low.
However, this algorithm only considered the task computation energy consumption and ignored the influence of the communication energy consumption of the system. Cheng et al. [9] proposed a thermal-constrained task allocation algorithm for interconnect energy reduction in 3D homogeneous multiprocessor system-on-chips. It minimizes the communication energy to reduce the system temperature by exploring the tradeoff between thermal dissipation and interconnect energy. However, the algorithm ignores the computation energy.
In order to address the shortcoming of the existing problems, we propose a cluster-based thermal-aware task allocation algorithm, which considers task computation energy, communication energy and heat dissipation of the system together. The proposed algorithm first maps the tasks of an application into clusters, and then assigns the ready clustered tasks to a core stack which we denoted as a
“clustered core” considering the lowest communication energy consumption, and finally adjusts the tasks inside a
“clustered core” to lower down the system peak temperature.
Compared to the Coldest-First task allocation algorithm [11], the peak temperature and communication energy can be reduced by 4.31K, and 52.23%, respectively.
The rest of this paper is organized as follows: Section II gives the thermal, energy and architecture model applied in this paper. The cluster-based thermal-aware task allocation algorithm is described in Section III; Section IV shows the experimental results and Section V concludes this paper.
II. PRELIMINARIES
In this section, we describe the details of our system models including thermal model, energy model and architecture
CTTA: A Cluster-Based Thermal-Aware Task Allocation Algorithm for 3D NoC
Lili Shen, Ning Wu, Gaizhen Yan, Jinbao Zhang, Fang Zhou
W
model of 3D multiprocessor. And we also give some definitions and terminologies which will be used in this paper.
A. Thermal model
Using Fourier heat flow analysis, heat flow is analogous to electrical current, and temperature is analogous to voltage [10], thermal model of 3D NoCs is shown in Fig. 1. The temperatures of core 2 and core 1 can be calculated by the following formulas:
1
2 1
( )
( )
amb F D amb
D V
amb F D amb D V
T T P P R
T T P R
T P P R P R
(1)
WherePD and PF represent the power consumption of node D and F, respectively. RV is the thermal resistance between different nodes in adjacent layers andRH is the thermal resistance between different nodes in the same layer.
Rambrepresents the thermal resistance between node and the ambient environment. Ambient temperature is represented asTamb.
From (1), we can see that the temperature of the core is mainly decided by the power consumption with the same thermal resistance parameters. Furthermore, due to
H
16
VR R , the thermal correlation between vertical direction is much stronger than the horizontal layer.
B. Energy model
The total energy of system is comprised of two parts:
computation energy Ecomp and communication energy Ecomm. According to [12], the total computation energy consumed by the task graph which has n tasks can be expressed as
2
1
( )
n
comp j i i
i
E NC C V
(2) Where NCjrepresents the execution cycles of task j that is independent on the voltage and frequency of the core. Ci represents the average switching capacitance per cycle of core that the task j executed on. Vi represents the voltage that the core operated on.When calculating the total communication energy, as described in [9], the bit energy consumed on sending one bit from node i to node j can be represented as
,
( 1)
i j horizontal router horizontal horizontal vertical
bit hops bit hops bit vertial bit
E n E n E n E (3)
Where nhopshorizontal represents horizontal distance between
node i and j, nvertial represents vertical distance. Ebithorizontaland
vertical
Ebit represent the energy consumed on each horizontal link and vertical link when transmitting one bit respectively, while
router
Ebit represents the energy consumed by the router when transmitting one bit.
The communication energy consumption Ei j, between node i and node j can be calculated by
Ei j, i j, Ebiti j, (4) Wherei j, indicates the amount of communication data volume between node i and j.
The total communication energy consumed by a task graph with communication transaction set Comm can be defined as
, ,
i j comm
i j Comm
E E
(5)C. Architecture model
Without loss of generality, we model our 3D NoC as a regular mesh of tiles stacked over multiple layers connected with a network-on-chip (NoC) communication structure.
Every tile contains a processing core and a router. And all the processors are homogeneous. Communication within a layer is carried out by the mesh NoC, while vertical links are achieved using through silicon vias(TSVs).
Base on the thermal model mentioned above, the thermal correlation between vertical direction is much stronger than the horizontal layer. Therefore, we denote a set of vertically aligned cores as a core stack. Cores in a core stack are extremely thermal correlative. If a core with heavy task has a high temperature, it will also increase the temperatures of other cores in the core stack. Intuitively, we assume each core stack as a “clustered core” which has cores with similar temperatures. In this way, the dimension of the system can be reduced from 3D to 2D, which reduces the complexity of the task allocation algorithm, as shown in Fig. 2.
D. Definitions
Definition 1: Architecture Graph of 3D NoC A(L,M,N,B).
L represents the number of layers and each layer contains MNcores which are connected by 2-D mesh in every layer.
These layers communicate with each other through TSV vertically. B is the bandwidth of the communication channel.
Definition 2: Task Graph G(V,E,T,C), which is a directed acyclic graph. A task graph G(V,E,T,C) contains a set of vertices representing the tasks and edges E representing the communication and precedence relationship between tasks.
The task execution time set can be represented as
{ ,
i1, 2,3,... }
T t i v and the communication time set can be represented as C
{
i j,| ,
i jv i,
j}
.Definition 3:Predecessors pred(i), successor succ(i) and
D
E F
C
C Ramb
C
Ramb PF
PE
PD RV
RH
Tamb Tamb
Core1 Core0
Core2
Fig 1. 3D thermal model
CC3 CC2
CC0 CC1
Fig. 2 Example of Clustered Cores
best predecessor bpred(i). All the predecessors of task i are the tasks who communicate with task i just before task i executes. All the predecessors compose the set pred(i). All the successors of task i are the tasks who communicate with task i just after task i executes. All the successors compose the set succ(i). The best predecessor of task i is the latest predecessor of pred(i). It can be expressed as
, ,
( ) | ( ) ( ),
, ( ),
j j i k k i
bpred i j ect ect j k pred i j k
(6) Where ect denotes the earliest complete time of task j. j Given the architecture graph of 3D NoC A(L,M,N,B) and the task graph G=(V,E,T,C), in which each task is annotated with its execution time and power consumption. Our problem is formulated as to allocate tasks to cores to find the thermal-aware optimal solution.
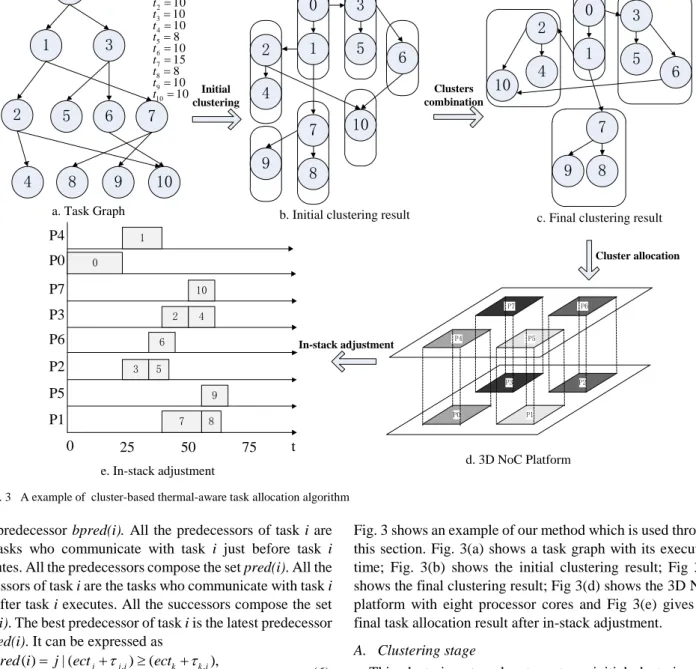
III. CLUSTER-BASED THERMAL-AWARE TASK ALLOCATION Our cluster-based thermal-aware task allocation algorithm for 3D NoC is described as three stages. The first stage is clustering stage which maps the tasks of an application into clusters. The purpose of this stage is to reduce the communication energy consumption and balance the computation energy consumption of the tasks. The second stage is cluster allocation stage that maps the ready clustered tasks into a “clustered core” considering the lowest communication and energy cost. The third stage is in-stack adjustment that moves some heavy tasks to near the heat sink to low the temperature of the system. To explain the procedures of the cluster-base thermal-aware task allocation,
Fig. 3 shows an example of our method which is used through this section. Fig. 3(a) shows a task graph with its execution time; Fig. 3(b) shows the initial clustering result; Fig 3(c) shows the final clustering result; Fig 3(d) shows the 3D NoC platform with eight processor cores and Fig 3(e) gives the final task allocation result after in-stack adjustment.
A. Clustering stage
This clustering stage has two steps: initial clustering and cluster combination.
1) Initial clustering
Given a task graph, the priority queue of task levels could be set firstly. The task level which describes the executing order of all tasks in the task graph is set by the accumulation of execution time of tasks in a path. Equation (7) defines the task level.
( )
, ( )
( ) max { ( )}, ( )
i
i k succ i
t if succ i
level i
t level k if succ i
(7)
The algorithm records a list of tasks that are ready to be executed according to the descending order of task level.
Every task in the ready list is considered as an individual cluster. The task vi with minimal task level will first be fetched from the ready list to seek its best predecessor vj and then gather its best predecessor vj together as a new cluster. After that, the task vj will be deleted from the ready task list. If the task can not find its best predecessor from the list, it will become a cluster individually. After all the tasks in the ready task list are clustered, the initial clustering is finished.
2)Cluster combination
0
1
4
3
2 5 7
8 6
10 9
Initial clustering
3 2 5
4 7 8 0 1
10 9
6
Clusters combination
a. Task Graph b. Initial clustering result
3 5 2
4
7 8 0 1 10
9
6
c. Final clustering result
d. 3D NoC Platform
P7 P6
P4 P5
P3 P2
P0 P1
t P0
P4
P7 P3 P6 P2 P5 P1
1 0
2 4
10
3 5 6
8 7
9
0 25 50 75
e. In-stack adjustment
Cluster allocation
In-stack adjustment
0 1 2 3 4 5 6 7 8 9 10
25 15 10 10 10 8 10 15 8 10
10 t t t t t t t t t t t
Fig. 3 A example of cluster-based thermal-aware task allocation algorithm
After initial clustering, if the number of clusters exceeds the “clustered core” nodes, it should need cluster combination.
The pseudo code of this cluster combination algorithm is shown in Fig. 4.
Every initial clustered task will calculate its computation energy(Line 1). Similarly, the total computation energy and the average computation energy will be calculated for the initial clustered tasks(Line 2). When the number of clustered tasks exceeds the “clustered core” nodes, the cluster with minimum computation energy will be picked to merge with other cluster. As decribed in[9], bit transmission energy on TSV is only 7.5% of that on the horizontal link. This shows that the tasks with more communication should be assigned into one “clustered core” to reduce the communication energy.
Moreover, for thermal optimization, it is not wise to assign the tasks with high computation energy into a “clustered core”, which will cause the generation of hotspots. So we should explore the tradeoff between thermal dissipation and communication energy. This work is done by Line 3 to Line 12. The process is conducted until all the requirements are met.
B. Cluster allocation
In this stage, the ready clusters are heuristically allocated onto the “clustered core” nodes considering to reduce the communication energy. The overall algorithm of cluster allocation can be summarized as follows:
(1)At the beginning, the cluster with largest communication traffic is allocation onto the center location which has maximum neighbors.
(2)The next cluster having the largest communication traffic with the allocated cluster is chosen and is allocated to the location that can minimize the communication energy with allocated clusters.
(3)The stage repeats until all the clusters have been allocated onto the clustered cores.
C. In-stack adjustment
After allocating all clusters onto the “clustered core” nodes, this stage is to adjust the tasks inside the “clustered core” to low the system temperature. For all cores in a “clustered core”, the distances to the heat sink are different, cores farther from the heat sink are hotter[8,13]. Therefore, this algorithm considers the power consumption and the parallelism of the
tasks in order to maintain low temperature and reduce execution time. The pseudo code of this cluster combination algorithm is shown in Fig. 5.
The algorithm first constructs task queues in each cluster according to the descending order of task level(Line 1), and then selects a task with highest priority to create a new task set Vs, and inserts all the tasks which meet conditons on Line 6 into Vs. All the tasks in Vs do not have dependence with each other, that are able to execute in parallel. Due to the tasks of Vs can be executed in parallel, we can assign the tasks to different cores to reduce the execution time. This job is done by Line 11 to Line 16. The process is conducted until all the requirements are met.
IV. EXPERIMENTS A. Experiments setup
In this experiment, the topology architecture of the simulation platform is 2x4x2 3D Mesh NoC. We use TGFF[14] to generate six sets of task graphs randomly with 48 tasks (tgff1-tgff6). HotSpot 5.02 is used as the thermal simulation tool, which supports thermal simulation on 3D chip with a grid model. The configuration information of the HotSpot-5.02 is shown in Table I. The other configuration followed the default setting of HotSpot.
To evaluate the performance of the task allocation algorithm proposed in this paper, comparisons have been made with the Coldest-First task allocation method in the communication energy and the peak temperature.
In the experiment, we first run the task allocation algorithm to produce the tasks, and then the power traces are obtained from execution of the tasks. Finally, the temperature profile of Algorithm 1 Cluster combination algorithm
//Input: Cinitial_task (V);
//Output: Cfinal_task (V);
1. Calculate Ecomp for each initial clustered task;
2. Calculate total Ecomp and average Ecomp of initial clustered tasks;
3. While number_of_clusters > the clustered core nodes do 4. Ct=find_minimum_Ecomp;
5. Co=find_maximum_Ecomm with Ct;
6. If the sum of Ecomp of Ct and Co < the average Ecomp then 8. put the Ct and Co together to create a new cluster;
9. Else
10. Cm=find minimum Ecomp of Cinitial_task (V) except Ct; 11. put the Ct and Cm together to create a new cluster;
12. End if;
12. End while;
13. Return the final task clusters Cfinal_task (V);
Fig. 4 Pseudo code of cluster combination algorithm
Algorithm 2 In-stack adjustment algorithm //Input: The clustered task set Vc
//Output: A task allocation generated by in-stack adjustment 1. Sort tasks in Vc according to the descending order of task level ; 2. While Vc is not empty do
3. vh=highest_priority_of_Vc; i=0;
4. create a new task set Vs,including vh; 5. For the rest tasks in Vc do 6. If level(vh)-t(vh)<level(vi) then 7. Put the vi into Vs;
8. End if;
9. i++;
10. End for;
11. While Vs is not empty do 12. vm=find_max_Ecomp_of_Vs;
13. Calculate the Ecomp of cores in the clustered core ; 14. Assign task vm to the core with minimum Ecomp; 15. Update the task set Vs;
16. End while;
17. Update the clustered task set Vc; 18. End while.
Fig. 5 Pseudo code of in-stack adjustment algorithm
TABLE I Configuration of HotSpot-5.02
Item Value
Bulk Si thickness of bottom die(next to heat sink) 150 m Bulk Si thickness of other die 50 m
Si thermal conductivity 100.0 W/(m-K)
Heat sink thermal conductivity 400.0 W/(m-K)
HotSpot grid resolution 64*64
the 3D NoC was generated by putting the power traces into HotSpot.
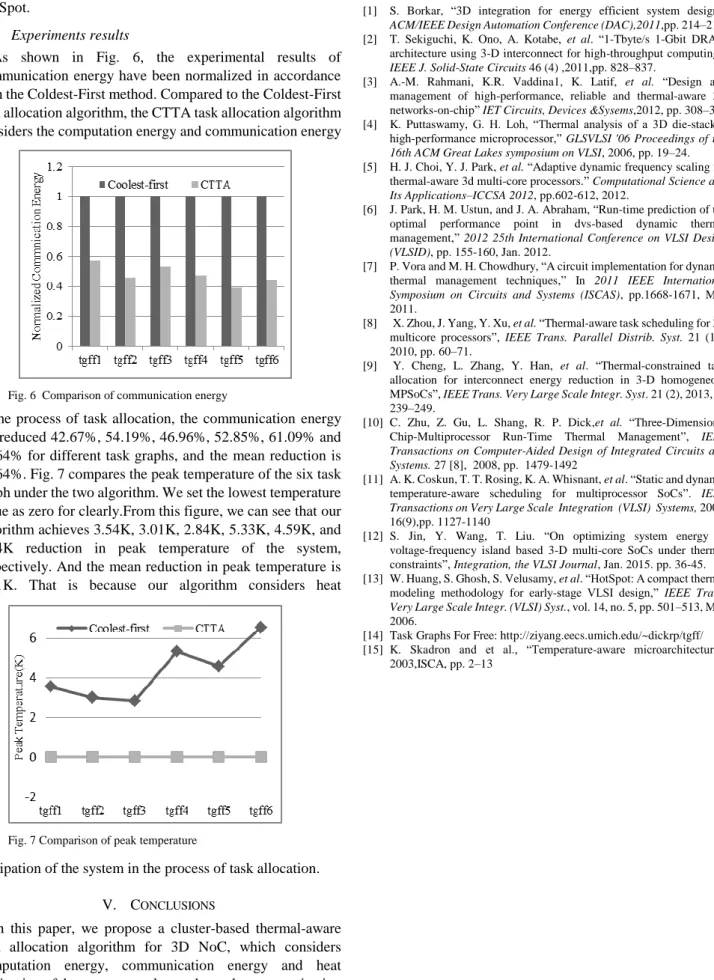
B. Experiments results
As shown in Fig. 6, the experimental results of communication energy have been normalized in accordance with the Coldest-First method. Compared to the Coldest-First task allocation algorithm, the CTTA task allocation algorithm considers the computation energy and communication energy
in the process of task allocation, the communication energy are reduced 42.67%, 54.19%, 46.96%, 52.85%, 61.09% and 55.64% for different task graphs, and the mean reduction is 55.64%. Fig. 7 compares the peak temperature of the six task graph under the two algorithm. We set the lowest temperature value as zero for clearly.From this figure, we can see that our algorithm achieves 3.54K, 3.01K, 2.84K, 5.33K, 4.59K, and 6.54K reduction in peak temperature of the system, respectively. And the mean reduction in peak temperature is 4.31K. That is because our algorithm considers heat
dissipation of the system in the process of task allocation.
V. CONCLUSIONS
In this paper, we propose a cluster-based thermal-aware task allocation algorithm for 3D NoC, which considers computation energy, communication energy and heat dissipation of the system together, reduces the communication energy and balances the power distribution, so as to achieve the purpose of reducing the peak temperature. Overall we obtained 42.67% to 61.09% reduction in communication energy, and 2.84K to 6.54K reduction in peak temperature compared to the Coldest-First task allocation algorithm.
REFERENCES
[1] S. Borkar, “3D integration for energy efficient system design”, ACM/IEEE Design Automation Conference (DAC),2011,pp. 214–219.
[2] T. Sekiguchi, K. Ono, A. Kotabe, et al. “1-Tbyte/s 1-Gbit DRAM architecture using 3-D interconnect for high-throughput computing”, IEEE J. Solid-State Circuits 46 (4) ,2011,pp. 828–837.
[3] A.-M. Rahmani, K.R. Vaddina1, K. Latif, et al. “Design and management of high-performance, reliable and thermal-aware 3D networks-on-chip” IET Circuits, Devices &Sysems,2012, pp. 308–321 [4] K. Puttaswamy, G. H. Loh, “Thermal analysis of a 3D die-stacked high-performance microprocessor,” GLSVLSI '06 Proceedings of the 16th ACM Great Lakes symposium on VLSI, 2006, pp. 19–24.
[5] H. J. Choi, Y. J. Park, et al. “Adaptive dynamic frequency scaling for thermal-aware 3d multi-core processors.” Computational Science and Its Applications–ICCSA 2012, pp.602-612, 2012.
[6] J. Park, H. M. Ustun, and J. A. Abraham, “Run-time prediction of the optimal performance point in dvs-based dynamic thermal management,” 2012 25th International Conference on VLSI Design (VLSID), pp. 155-160, Jan. 2012.
[7] P. Vora and M. H. Chowdhury, “A circuit implementation for dynamic thermal management techniques,” In 2011 IEEE International Symposium on Circuits and Systems (ISCAS), pp.1668-1671, May 2011.
[8] X. Zhou, J. Yang, Y. Xu, et al. “Thermal-aware task scheduling for 3D multicore processors”, IEEE Trans. Parallel Distrib. Syst. 21 (1) , 2010, pp. 60–71.
[9] Y. Cheng, L. Zhang, Y. Han, et al. “Thermal-constrained task allocation for interconnect energy reduction in 3-D homogeneous MPSoCs”, IEEE Trans. Very Large Scale Integr. Syst. 21 (2), 2013, pp.
239–249.
[10] C. Zhu, Z. Gu, L. Shang, R. P. Dick,et al. “Three-Dimensional Chip-Multiprocessor Run-Time Thermal Management”, IEEE Transactions on Computer-Aided Design of Integrated Circuits and Systems. 27 [8], 2008, pp. 1479-1492
[11] A. K. Coskun, T. T. Rosing, K. A. Whisnant, et al. “Static and dynamic temperature-aware scheduling for multiprocessor SoCs”. IEEE Transactions on Very Large Scale Integration (VLSI) Systems, 2008, 16(9),pp. 1127-1140
[12] S. Jin, Y. Wang, T. Liu. “On optimizing system energy of voltage-frequency island based 3-D multi-core SoCs under thermal constraints”, Integration, the VLSI Journal, Jan. 2015. pp. 36-45.
[13] W. Huang, S. Ghosh, S. Velusamy, et al. “HotSpot: A compact thermal modeling methodology for early-stage VLSI design,” IEEE Trans.
Very Large Scale Integr. (VLSI) Syst., vol. 14, no. 5, pp. 501–513, May 2006.
[14] Task Graphs For Free: http://ziyang.eecs.umich.edu/~dickrp/tgff/
[15] K. Skadron and et al., “Temperature-aware microarchitecture,”
2003,ISCA, pp. 2–13
Fig. 6 Comparison of communication energy
Fig. 7 Comparison of peak temperature