MASTER THESIS
KEEPING TRACK OF THE
PERFORMANCE OF THE
PURCHASE-TO-PAY PROCESS OF
PHILIPS LIGHTING
Public version
Iris Celeste Brem
INDUSTRIAL ENGINEERING AND MANAGEMENT
UNIVERSITEIT TWENTE
2
Title
Keeping track of the performance of the Purchase-to-Pay process of Philips Lighting
Author
Name: Iris Celeste Brem E-mail: [email protected]Student number: s1102907
Program: Industrial Engineering and Management Specialization Production and Logistics
Supervisory committee
Internal supervisorsDr. Ir. P. Hoffmann
Faculty of Behavioural, Management and Social Sciences Department Technology Management and Supply
University of Twente
Dr. Ir. L.L.M. van der Wegen
Faculty of Behavioural, Management and Social Sciences Department Industrial Engineering and Business Information Systems
University of Twente
External supervisors W. Bos Royal Philips B.V. Website: www.philips.com
3
Management summary
Royal Philips N.V., also known as Philips, is a Dutch diversified technology company that serves both professional and consumer markets. In February 2016, the company will split into two companies: Royal
Philips and Philips Lighting. This research is performed at the Procurement Department for the new Philips Lighting, and focuses on the buying of Indirect Materials & Services (IMS). The transactional purchasing
process is called the Purchase-to-pay (P2P) process, which covers the process from the need for a product or service until the delivery and payment. Currently, the overview on the performance of the P2P process is incomplete and inadequate. Therefore, the objective of this research is: develop a performance
measurement system that the IMS Procurement Department of Philips Lighting can use to continuously control
and improve the performance of the P2P process. A performance measurement system (PMS) is a system that
measures performance using performance indicators in a consistent and complete way (Lohman, Fortuin,
& Wouters, 2004). Andersen and Fagerhaug (2002) created an eight-step methodology to guide the creation of a PMS, and their method is used to structure this research. The eight steps of their design process are:
1. Understand and map business structures and processes;
2. Develop business performance priorities; 3. Understand the current PMS;
4. Develop performance indicators; 5. Decide how to collect the required data;
6. Design reporting and performance data presentation formats;
7. Test and adjust the PMS;
8. Implement the PMS (the implementation is not part of this research due to time constraints).
Performance indicators should be derived from the strategy of the company (Azzone, Masella, & Bertelè, 1991; Dixon, Nanni, & Vollmann, 1990; Fortuin, 1988; Goold, 1991; Kaplan & Norton, 1992; Lynch & Cross, 1991; Maskell, 1991), however, since Philips Lighting does not exist formally, the strategy and strategic
objectives are not entirely clear yet. Therefore, interviews are performed with several stakeholders of the P2P process, at all levels of the organization, and their needs and requirements (in combination with the current draft of the firm’s mission) are the main input on which the selection of the key performance
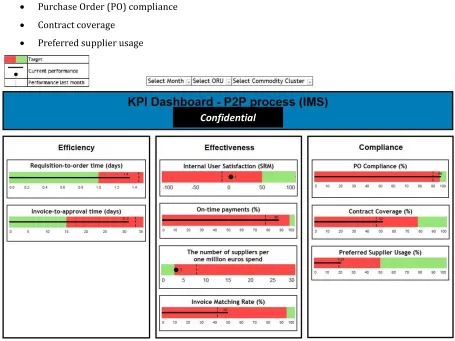
indicators (KPIs) for the PMS is based. From this input, three objectives for the PMS are drawn, and all KPIs are categorized according to these objectives: increase process efficiency, increase process effectiveness, and maintain compliance with internal controls. The following KPIs are selected for the PMS, and the final
design of the dashboard can be seen in Figure 1: • Cycle time
o Requisition-to-order time o Invoice-to-approval time
• Internal user satisfaction (SRM system usability) • On-time payments
4 • Purchase Order (PO) compliance
• Contract coverage • Preferred supplier usage
The model is verified by the commodity cluster leader of Industrial and Real Estate, who will use the PMS
to see how the Organizational Reporting Units (ORUs) within Philips Lighting are performing on his clusters. The PMS could not be validated yet, as most data is still missing, and the model will not be implemented
until next year.
To achieve a successful implementation of the PMS, three phases need to be passed according to the model of Lewin (1951), which are ‘Unfreezing,’ ‘Changing’ and ‘Refreezing’. The first stage is the unfreezing stage,
where the need for the PMS needs to be recognized, and where the organization needs to prepare for the change. Active participation of the employees is recommended, to reduce the likelihood of resistance. In the next stage, changing, the PMS will be actually implemented. The implementation can be divided into four
phases: prepare & plan, design, validate, and deploy. In the prepare & plan phase, the project must be initiated, and a project team should be composed with people from different departments, including Finance, Procurement, and IT. Then, a good IT system needs to be chosen, which needs to fulfill the following
criteria of Malik (2005): fast response, intuitive, web-based, secured, scalable, industry compliant, open technology, supportable, and cost effective. The next phase is the design of the PMS by IT experts in the
selected system. In the following phase, the PMS needs to be validated. Several methods of validation should be performed by a process expert and an IT expert, including a user acceptance test, and a pilot at ORU level. In the last phase, the PMS goes live and the employees should be trained properly. The last stage of the
[image:5.595.69.524.71.412.2]model of Lewin (1951) is refreezing, where the company needs to start working with the PMS, and try to make it part of the regular work. Several aspects need to be taken into account, including the following: Figure 1 – Final design PMS dashboard
5 • Check whether the targets are feasible for every ORU;
• Select KPIs that you want to improve first;
• Make sure that the management team stays committed to the PMS (during and after implementation);
• Organize review moments with the ORUs;
• Make performance visible at ORU level (print screens of the dashboard in the corridors).
When the PMS is successfully implemented, Philips Lighting IMS Procurement can start using it to continuously control and improve the performance of the P2P process, and start solving the challenges that
6
Preface
This thesis is written in the last seven months, in order to finalize the master Industrial Engineering and Management at the University of Twente. I had the amazing opportunity to be part of the separation of one of the largest electronics companies in the world: Royal Philips. Philips is splitting the company into two
companies, separating the lighting business from the healthcare and consumer lifestyle businesses. This research is executed for the new company: Philips Lighting.
I would not have been able to write this thesis without the support of many people, to whom I am very grateful.
First of all, I would like to thank Hein Rensma and Wicher Bos for their major support during the internship
at Philips. Although the company was in a turbulent and very busy period, you always found time to discuss my thesis and many other things. Your expertise and useful suggestions really helped me to improve my
thesis. I also want to thank my fellow intern colleagues, with whom I had a great time during the internship. In particular, my end-to-end partner, Nicko Imron, with whom I had many conversations, which really contributed to my thesis.
I would also like to thank my supervisors at the University of Twente, Petra Hoffmann and Leo van der Wegen. Your very detailed feedback and constructive criticism helped me to bring my thesis to a higher level.
I could not have written this thesis and finalize my study without the support of my family and Ali. The past years have not been easy, however I am very grateful to be part of this very strong family.
Unfortunately, my student time is over, but I am looking forward to the next step in my life. I am very happy that I was given the opportunity to join Philips Lighting from January 2016.
Iris Celeste Brem
7
Table of Contents
Management summary ... 3
Preface ... 6
List of Abbreviations ... 9
1. Introduction ... 10
1.1 Introduction to Royal Philips ... 10
1.2 The Philips Procurement Organization ... 10
1.2.1 Importance of the procurement function ... 11
1.3 Research context... 12
1.3.1 The P2P process ... 12
1.4 Problem statement ... 13
1.5 Research objective ... 14
1.6 Research scope ... 15
1.7 Research questions ... 15
2. Current performance measurement of the P2P process ... 18
2.1 The P2P process ... 18
2.1.1 Requisitioning ... 18
2.1.2 Purchasing ... 20
2.1.3 Invoice handling ... 21
2.1.4 Payment ... 21
2.1.5 Challenges and bottlenecks ... 21
2.2 Performance measurement of the P2P process ... 23
2.2.1 Challenges and bottlenecks ... 24
2.3 Conclusion ... 25
3. Literature review ... 26
3.1 Performance measurement system ... 26
3.1.1 Designing a performance measurement system ... 26
3.1.2 The PMS design method for PL IMS Procurement ... 27
3.2 Criteria for effective performance indicators ... 28
3.3 Elements for a ‘good’ performance measure ... 30
3.3.1 Applying the performance record sheet at PL IMS Procurement ... 31
3.3 Conclusion ... 32
4. Designing the PMS ... 34
4.1 Stakeholders ... 34
4.2 Approach ... 35
4.3 The needs and requirements of the stakeholders ... 36
4.3.1 Conclusion ... 39
4.4 The performance indicators of the PMS ... 40
4.4.1 Conclusion ... 57
4.5 Design of the PMS dashboard ... 58
8
4.7 Conclusion ... 60
5. Guideline on how to implement the PMS, and work with it ... 62
5.1 The implementation of the PMS... 62
5.2 The use of the PMS ... 66
5.3 Conclusion ... 67
6. Conclusion and recommendations ... 68
6.1 Conclusion ... 68
6.2 Limitations ... 71
6.3 Recommendations ... 71
References ... 74
9
List of Abbreviations
AP Accounts Payable BOM Bill of Materials
BPE Business process expert
BSS Business Strategic Services CEO Chief Executive Officer
CLOGS Classification of Goods and Services CPO Chief Procurement Officer
CRG Central Reporting Group
E2E End-to-end
eCM Electronic Contract Management F&D Freight & Distribution
FSSC Financial Shared Service Center FTE Fulltime-equivalent
HR&M Human Resources & Mobility IMS Indirect Materials & Services IND Industrial
IT Information Technology KPI Key Performance Indicator
MME Marketing, Media & Events NPS Net Promotor Score
ORU Organizational Reporting Unit
P2P Purchase-to-pay PI Performance indicator PL Philips Lighting
PMS Performance measurement system PO Purchase order
PPG Portal purchase guide
PSSC Procurement Shared Service Center RE Real Estate
10
1.
Introduction
This chapter gives an introduction to the problem setting at the Procurement Department of Philips. Sections 1.1 and 1.2 give an introduction to the company and the Philips procurement organization. Also, the importance of the procurement function in general is highlighted. Section 1.3 describes the research
context, and Section 1.4 explains the actual problem. Section 1.5 explains the research objective, followed by the research scope in Section 1.6. Finally, the research questions and methodology of this research are
explained in Section 1.7.
1.1 Introduction to Royal Philips
Royal Philips N.V., also known as Philips, is a Dutch diversified technology company that serves both
professional and consumer markets. In 1891, Philips was founded in Eindhoven as a lighting company by Gerard Philips and his father Frederik. The company is one of the largest electronics companies in the world, and employs around 108,000 people over more than 100 countries. Philips is divided into three main
branches: Healthcare, Consumer Lifestyle, and Lighting. In 2014, the CEO of the company announced the plan to split Philips into two stand-alone companies to sharpen its strategic focus. Philips will combine its
health care and consumer lifestyle business into a company which continuous under the name Royal Philips, and the lighting business will become a company called Philips Lighting (PL). Both companies will continue to leverage the Philips brand. According to Philips, the separation would make it easier for the lighting
business to enter new markets. The formal separation is planned to be accomplished by February 2016.
1.2 The Philips Procurement Organization
This research is conducted at the Procurement Department of Philips and is performed for PL. Within
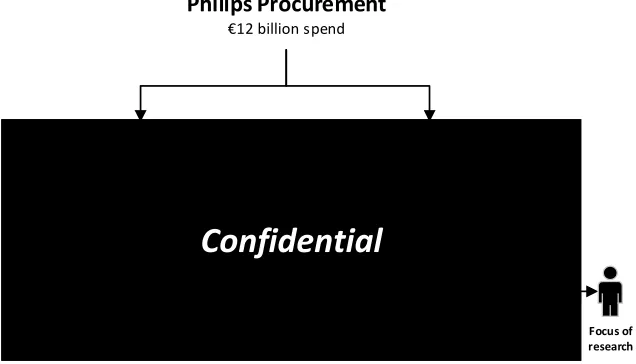
[image:11.595.70.388.531.713.2]procurement, a division can be made between Bill of Materials (BOM) and Indirect Materials & Services (IMS) spend. This research is limited to the IMS Procurement of PL (Figure 2)1, which will be accountable for approximately 1.6 billion euros spend (a forecast based on 2014 spend retrieved from SMART22).
Figure 2 - The Philips procurement organization
1 Officially, this section of PL will be called PL Indirect Material & Governance, but in this research it is still called PL IMS Procurement
2 SMART2 is a reporting tool used by Philips Procurement
Philips Procurement
€12 billion spend
Royal Philips € 7,6 billion spend
Philips Lighting € 4,4 billion spend
BOM € 2,8 billion spend
IMS €1,6 billion spend BOM
€ 4,7 billion spend
IMS €2,9 billion spend
Focus of research
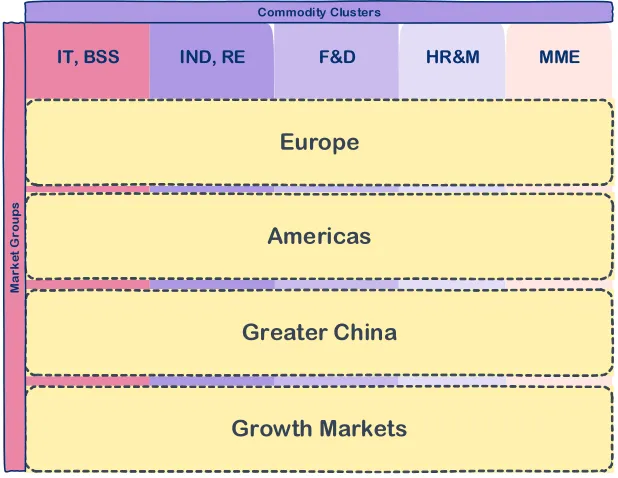
11 Within IMS Procurement, there are two different dimensions: commodity clusters and market groups.
There are seven commodity clusters: Information Technology (IT), Business Strategic Services (BSS). Industrial (IND), Real Estate (RE). Forwarding & Distribution (F&D), Human Resources & Mobility (HR&M),
and Marketing, Media & Events (MME). Basically, every commodity cluster has its own way of working, and uses its own processes and systems. In PL, there will be five commodity cluster leaders, who will be responsible for the seven commodity clusters. Next to the seven commodity clusters, there are four different
market groups in which the approximately 200 Organizational Reporting Units (ORUs) of PL are located: Europe, Americas, Greater China, and Growth Markets3. An ORU is an organizational number of a Philips
entity, and it is the lowest level on which (financial) reporting is done. The link between the two dimensions is visualized in Figure 3.
MME IT, BSS IND, RE F&D HR&M
Growth Markets
Greater China
Americas
Europe
Commodity Clusters
M
ar
k
e
t
G
r
ou
[image:12.595.70.379.247.486.2]ps
Figure 3 - Commodity Clusters and Market Groups
1.2.1 Importance of the procurement function
Procurement as a function is becoming more and more important, and it has been shown that purchasing activities critically influence the financial performance of a firm (Chen, Paulraj, & Lado, 2004; Ellram & Liu,
2002; Hendricks & Singhal, 2003). Despite the growing attention for purchasing, the procurement function within firms can still be at different stages of strategic development, ranging from more administrative to
fully integrative (Cavinato, 1999; Reck & Long, 1988). Batenburg and Versendaal (2008) showed that an organizations’ procurement maturity has a positive and significant effect on procurement performance. In addition, the more advanced and mature the procurement process is, the more time the company can spend
on strategic activities, which are positively correlated with cost savings (Úbeda, Alsua, & Carrasco, 2015). Since purchasing can have a direct impact on the overall company results, the performance should be measured and monitored through an appropriate purchasing performance measurement system (PMS)
(Monczka, Trent, & Handfield, 2004; Perkins & Gunasekaran, 1998; van Weele, 2004). A PMS is a system that measures performance using performance indicators in a consistent and complete way (Lohman et al.,
12 2004). Performance indicators (PIs) are variables that express quantitatively the effectiveness and/or
efficiency of a process or system against a given target (Fortuin, 1988). Previous research has revealed that the implementation of a mature purchasing PMS can be a means to attain even a higher level of functional
strategic integration (Dumond, 1994; Mentzer & Konrad, 1991).
1.3 Research context
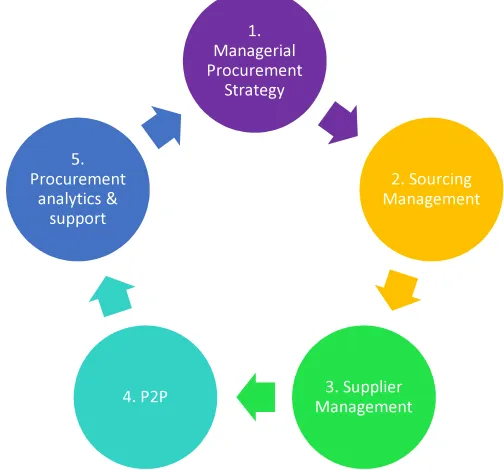
The IMS Procurement Department uses an End-to-End (E2E) process cycle to perform their procurement
activities. The E2E process cycle consists of different stages, which can be seen in Figure 4. Stage one, two three and five cover the strategic purchasing part, whereas stage four covers the transactional purchasing part. In the first step of the cycle, the overall procurement strategy and stakeholders are defined. In this
step, it is also decided that IMS Procurement is treated as a separate organization. During the second step, the commodity cluster strategy is developed.
Step one and two are focused on the long term. The third step concerns supplier management, where the relationship with the supplier, as
well as the performance of the supplier are managed. The fourth step, the transactional purchasing, is called the Purchase-to-pay
(P2P) process, which is also the focus of this research. The P2P process is explained in
more detail in the next section. In the last step of the cycle, analyzes are done on the performance of the procurement process, for
example a spend analysis, and performance reports are sent to the involved employees.
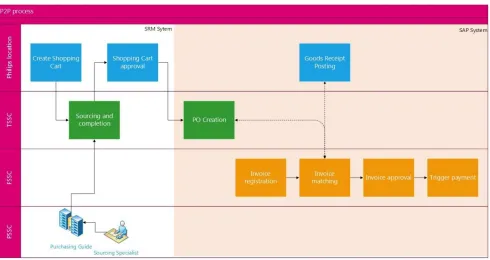
1.3.1 The P2P process
When there is a need for a product, the initiator goes to a requester, which is an employee who is allowed
to create a shopping cart by using the system Supplier Relationship Management (SRM). SRMis a web-based requisitioning and spend approval tool for IMS Procurement. SRM is a SAP application, tightly integrated with all SAP R/3 systems used within Philips. Basically, a shopping cart is a request for a certain product or
service in the SRM system. There are more than 25,000 employees who can create shopping carts, but most of the times, this is done by the secretary. How requesters create a shopping cart is described in more detail in Section 2.1.1. After the shopping cart is created, the system sends it to the Transactional Shared Service
Center (TSSC), which is an external company called ‘Infosys’, located in Poland, which takes care of the transactional part of the P2P process. The TSSC checks if the shopping cart is correct and complete. After
this process, the shopping cart is sent to the persons who need to approve it. These persons are specified persons within Philips, such as the project manager or the plant manager. The number of approvers depends on the total value of the shopping cart. After the shopping cart is approved, the system sends a
purchase requisition to the TSSC, and the TSSC creates a purchase order (PO) and sends it to the selected 1.
Managerial Procurement
Strategy
2. Sourcing Management
3. Supplier Management 4. P2P
5. Procurement
[image:13.595.286.538.271.506.2]analytics & support
13 supplier. The supplier sends the invoice to the Financial Shared Service Center (FSSC), also part of Infosys,
which registers the invoice in the SAP system. Afterwards, the FSSC matches the invoice with the PO, to check if the quantity and value are the same, and additionally, if there is a goods receipt in the SAP-system,
they check if the ordered goods are really delivered. If there is a match, the invoice is approved and paid within 65 days. A simplified version of the P2P process is visualized in Figure 5.
1.4 Problem statement
Currently, the overview on the performance of the P2P process is incomplete and inadequate. There are a lot of aspects of the P2P process that are already measured, for example PO compliance (an indicator of the
spend that went via a PO) and SRM compliance (an indicator of the spend that went via the SRM system). The problem is that all different indicators are tracked by different persons, departments, and
organizations, which makes the overview really fragmented. For example, Infosys creates a dashboard with more than 45 procurement PIs every month, but due to the large number of indicators, it does not become clear how a specific ORU is performing. Quite often, companies have a large number of performance
measures to which they keep on adding based on suggestions of employees and consultants, and fail to realize that performance measurement can be better addressed using a few good metrics (Bhagwat &
Sharma, 2007). On top of that, Infosys only sends this dashboard to the Finance Department and not to the Procurement Department.
Another problem within IMS Procurement is that the definitions of some PIs are not always clear. A small
change or misinterpretation of the definition of a PI can have a large influence on the calculation of that indicator. The program manager of the commodity cluster Real Estate gave an example of ten years ago,
[image:14.595.54.544.157.417.2]14 years’. With all these criteria, it turned out that they already reduced the number of suppliers to 15,000,
which was an acceptable number. This example shows that the definition of a PI can have an influence on the result of that indicator. Within IMS Procurement, there are some PIs that do not have a very clear
definition and are not calculated very accurate. These PIs give a distorted image of the actual performance. For example, the PO and SRM compliance rates for a specific ORU should have a value between 0 and 100%, but in reality the values can even be negative or above 100%, due to the inaccurate calculation. When you
then look at the average percentage of all the ORUs, you get a wrong impression of reality.
Additionally, there are no clear targets for the majority of the current PIs, and also inadequate consequences
when an ORU fails to reach a certain target or performance level. Currently, there is, for example, a PO compliance team that reaches out to the top 20 worst performing ORUs based on the PO compliance rate, which is only 2.5% of the total ORUs. Next to the fact that they only reach out to a very small number of
ORUs, no real actions or improvements arise from these escalations. They only try to discover the cause of the top 10 non-compliant spend with the site, but most of the times it is concluded that it happened by
accident, and therefore no actions are taken.
All these problems together, shown in Figure 6, result in an overall problem statement: the current insight
into the performance of the P2P process is inadequate.
Inadequate insight into the performance of the P2P process
Inaccurate definitions of performance
indicators Inaccurate
calculation of performance
indicators
No real consequences if
performance is low Lack of clear
targets for the performance
indicators
Too many performance
[image:15.595.79.485.379.540.2]indicators
Figure 6 – An overview of the current problems
1.5 Research objective
The core problem that the company is facing is that there is no complete overview of the overall performance of the P2P process. The goal of this research is therefore to create a PMS that PL can use to
continuously control and improve the performanceof the P2P process. The main objective of a PMS is to provide comprehensive and timely information on the performance of business processes. This information
can be used to communicate the performance and the goals of a process to the stakeholders, and to analyze the weaknesses of a business process and take some corrective actions accordingly (Kueng, 2000). In the new company, the commodity cluster leaders will be responsible for all the ORUs in their clusters, therefore
15 The research objective of this research is therefore: develop a performance measurement system that the IMS
Procurement Department of Philips Lighting can use to continuously control and improve the performance of
the P2P process.
1.6 Research scope
The research is conducted on the IMS Procurement Department and is done for the new PL. As stated before, all the ORUs of Philips are assigned to the four different market groups. In order to perform an internal
benchmark to determine the targets of the Key Performance Indicators (KPIs) in the PMS, eight ORUs are selected: the two largest operational plants (with SRM) of PL per market group based on spend in 2014. The number of ORUs for this research is limited to eight, because it will take too much time to benchmark all the
ORUs. Due to the different locations and spend of the ORUs, the selected ORUs give a good representation of all the ORUs. The list of the eight ORUs and their corresponding locations can be found in Appendix I.
As already mentioned, there are seven commodity clusters within IMS Procurement. This research is done looking from the view of the clusters Industrial, which includes the buying of products like dies, molds and other equipment for the production processes, and Real Estate, which includes the lease of real estate and
the buying of facilities management. One of the reasons for this, is that the general purchasing process of PL IMS Procurement within these two clusters is represented best, and they also use the standard ordering system SRM, whereas F&D for example uses its own ordering system. Also, these clusters fit well with the
scope of the eight operational plants, since they have the highest spend at these ORUs. However, this does not mean that the PMS is designed for these clusters only. All the clusters are taken into account when
selecting the KPIs, but the clusters Industrial and Real Estate are the test ground for the PMS.
Because of time reasons, the actual implementation of the PMS is not part of this research.
1.7 Research questions
The research question of this research is: How can insight be created into the overall performance of the P2P
process of Philips Lighting IMS Procurement?
To be able to develop a PMS, and to structure this research, four sub-questions are formulated, which are
described below. Additionally, the methodology to obtain the necessary information is described per sub-question. In this research, both quantitative and qualitative research methods are used.
Sub-question 1
The first sub-question is discussed in Chapter 2, and describes and analyses the current P2P process and its performance measurement.
1. How are the current P2P process and its performance measurement organized? 1.1. How is the current P2P process organized?
1.2. How is the current performance of the P2P process measured?
1.2.1.What PIs are used to measure the performance of the P2P process?
16 1.3. What are the problems/bottlenecks in the current process and performance measurement?
Methodology Sub-question 1
Qualitative research in the form of semi-structured interviews is used to get insight into the current P2P
process and performance measurement. It is used to map and explain the current P2P process in detail, to understand and explain the current PIs and to indicate who is responsible for measuring these indicators. Additionally, the interviews are used to understand and describe the experiences and problems that the
employees encounter with the current process and performance measurement. The people that are being interviewed are the users of the process (e.g. the requesters) and several process experts. In addition, qualitative secondary data is retrieved from information sharing networks and databases, and used to
explain the current PIs of the P2P process in more detail.
Sub-question 2
The second sub-question is addressed in Chapter 3, and performs a literature study to get more insight on PMSs and their applicability, and on criteria for good PIs.
2. How can a PMS be created for the P2P process according to the available academic literature?
2.1. What methods can be used to design a PMS?
2.1.1. What method is most suitable to design the PMS for PL IMS Procurement? 2.2. What are criteria for good PIs?
2.2.1. What criteria should the KPIs of the PMS for PL IMS Procurement meet?
Methodology Sub-question 2
For the literature study of this research, websites like Google Scholar, Scopus and ScienceDirect are used to obtain articles about PMSs and criteria for PIs. A suitable design for the PMS is chosen based on the current situation as described in Chapter 2, as well as a suitable set of criteria for the KPIs in the PMS of PL IMS
Procurement. It might be the case that the set of criteria for the KPIs is not the most optimal one, since not all the knowledge is available yet, as more information is retrieved in the interviews with the stakeholders
in Chapter 4. A short reflection on this is given at the end of Section 4.4.
Sub-question 3
The third sub-question is discussed in Chapter 4, and concerns the design of the PMS using the input from
stakeholders, and taking into account the literature from the second sub-question. 3. How should the PMS for the P2P process be designed?
3.1. What are the needs and requirements of the stakeholders?
3.2. What should the KPIs in the PMS be and how should they be measured? 3.3. What design should be used for the PMS dashboard?
3.4. How can the PMS be verified and validated?
Methodology Sub-question 3
17 interviews, which can be found in Appendix VI. Stakeholders are selected in all the levels of the organization.
The approach of the interviews and the selected stakeholders are discussed in more detail in Section 4.2. The KPIs for the PMS are then chosen and described based on the input from the stakeholders, taking into
account the literature study from the second sub-question. An internal and external benchmark is performed to suggest a target for each KPI (discussed in more detail in Section 3.3.1). For the internal benchmark, data is obtained using data mining techniques and descriptive statistics methods, since the data
needs to be retrieved from the different procurement databases, such as SMART2 and SRM. Microsoft Excel is used to analyze the data. After this, the PMS dashboard is designed with the selected KPIs using Tableau
and Microsoft Excel. When there is no data available for a certain KPI, fictitious values will be used. To verify and test the PMS, the dashboard is shown to the commodity cluster leader of Industrial and Real Estate, as he is responsible for the performance of the ORUs in his clusters and will use the PMS in the future to
monitor this. This is an important step that needs to be taken before actually implementing the PMS, because then it is still relatively easy to make small adjustments. A quantitative test/validation cannot be
executed, since not all data is available yet, and there is no time available to get this data, due to the split of the company, with all employees having other priorities. After the split is realized in February 2016, the PMS can be implemented and tested by the company itself, an implementation plan for this can be found in
Chapter 5.
Sub-question 4
The last sub-question is described in Chapter 5 and provides a guideline on how the PL IMS Procurement
Department should implement the PMS, and work with it, including a timeline and some points of attention. 4. How should PL IMS Procurement implement the PMS, and work with it?
Methodology Sub-question 4
For the last sub-question, qualitative information is used, retrieved from the semi-structured interviews during this research, as well as from our own experience in the company. This last sub-question aims at providing the company with a guideline on how to implement and use the PMS. This is necessary, because
the company is in the middle of a split and cannot implement the solution right away, therefore thoughts are given on the approach that should be used for the implementation and some important remarks are
given on the use of the PMS in the new company. To obtain more information on the implementation of a system in general, a small literature study is performed, using websites like Google Scholar, Scopus and ScienceDirect.
This research is structured according to the questions discussed above, and ends with a chapter with a conclusion and recommendations for the company. The next chapter starts with answering the first
18
2.
Current performance measurement of the P2P process
This chapter gives an answer to the first sub-question: ‘How are the current P2P process and its performance
measurement organized?’ The chapter starts with explaining the current P2P process in detail and continues
to describe the current performance measurement of the process. Both sections end with an overview on
the challenges and bottlenecks that arise from the way that the process and performance measurement are organized right now. The information to describe the challenges and bottlenecks is retrieved from
semi-structured interviews with the requesters and from observations of the available data. The challenges and bottlenecks within the current P2P process are used to give insight into where the company stands concerning the P2P process and more importantly, to emphasize the importance of a PMS. Therefore, this
research does not try to solve these challenges, but instead uses these challenges as input for the PMS to identify key points of attention.
2.1 The P2P process
In Section 1.3.1, the P2P process is already described briefly, but this section continues to explain the process in more detail. The P2P process can be divided into four sub-processes: requisitioning, purchasing,
invoice handling, and payment. The flowcharts of the sub-processes can be found in Appendix II. A production worker who works in the production facility in ORU D and needs a new, regular, hammer (Figure 7) is taken as an example
to describe the sub-processes in detail.
It might be good to remark here, that besides the general purchasing process, the Industrial cluster has another way of purchasing their goods, which is replenishment. Replenishment orders are triggered
automatically in the SAP system when the inventory hits a certain reorder point and therefore the requisitioning process is skipped. All variations of the purchasing process are taken into account in this
research, but are not described any further in this chapter, since this chapter focuses on the more general process.
2.1.1 Requisitioning
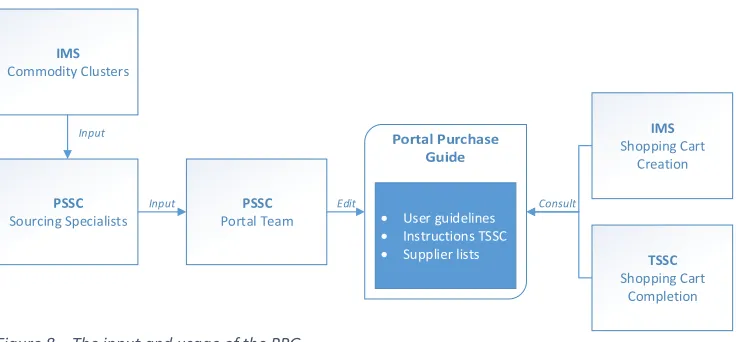
The production worker who needs a new hammer goes to one of the requesters at his site, in this case it is a female requester, and explains her that he needs a new hammer. The requester then goes to the Portal
Purchase Guide (PPG), which is an online guide on how to buy a certain product at a certain site on the Philips intranet, and selects her location and the CLOGS-code of the hammer. A CLOGS-code is a classification code for the products and services that are used within Philips Procurement4. The CLOGS-code
of the hammer is 8HD100, which includes all hand- & machine tools. There is a site-specific guideline for every CLOGS-code in the PPG. The PPG is regularly updated by the Portal Team of the Procurement Shared
Service Center (PSSC), which is part of Philips, and they receive the input from the sourcing specialists of the PSSC and the commodity clusters. In Figure 8, an overview on the input and usage of the PPG is given.
4 On May 2015, Philips IMS Procurement had 137 different CLOGS-codes
19
• User guidelines • Instructions TSSC • Supplier lists
PSSC
Portal Team
PSSC
Sourcing Specialists
Edit
IMS
Commodity Clusters
Input IMS
Shopping Cart Creation
TSSC
Shopping Cart Completion
[image:20.595.73.442.67.238.2]Consult Input
Figure 8 – The input and usage of the PPG
When the requester selects the right location and CLOGS-code, a specific guideline on how to order the
hammer appears. The selection menu of the PPG can be seen in Figure 9. Next to the guideline on how to buy the product, the PPG shows the list of preferred suppliers for this product, as well as work instructions
for the TSSC on how to order and approve a shopping cart for this specific site. Appendix III shows an example of the information of the CLOGS-code of hand- and machine tools that can be found in the PPG.
Figure 9 - Selection menu in the PPG
In the guidelines of this particular CLOGS-code, the requester can read that it is obligatory to use a catalogue (if possible). There are five standard ordering channels that can be used to order a product, which are: • Standard catalogue
• Punch-out catalogue (a vendor catalogue)
• Form catalogue (extension of a catalogue with possibility to add specific data) • Free text (describe the product in a text box yourself)
• Third party ordering tool
After the requester has read the guidelines in the PPG, she goes to the SRM system where she starts to create a shopping cart. The requester should always use one of the preferred suppliers in the PPG. In the case of
the hammer, the requester selects the product from one of the catalogue vendors and adds it to the shopping cart. In addition, the requester has to state where and when the product should be delivered. When all the fields in the SRM system are filled in, the requester can click on ‘proceed’, and the request is automatically
sent to the TSSC. The TSSC checks if the shopping cart is correct and complete. If the shopping cart is incorrect or incomplete, the shopping cart is either sent back to the requester or sent to one of the sourcing specialists of the PSSC. The TSSC can send the shopping cart to the sourcing specialist of the PSSC for
multiple reasons. The first reason can be that the requester used a non-preferred supplier, and the sourcing specialist needs to approve this supplier. The second reason can be that the requester did not assign a
supplier at all. In this case, the sourcing specialist selects an appropriate supplier. Another reason can be
[image:20.595.72.561.346.406.2]20 that the value of the shopping cart is above 50K euros, the shopping cart must then be approved by the
sourcing specialist first.
After the shopping cart is approved by the TSSC, it is sent via an add-in tool of the SRM system to the persons
within Philips for a monetary approval. The approvers are generally pre-specified and the number of approvers depends on the value of the shopping cart. In Tables 1 and 2, the approval levels and corresponding values of the shopping cart can be seen.
[image:21.595.69.353.222.475.2]Table 1 – Number of approvers for a shopping cart
Table 2 - Approval levels
In addition to the monetary approval, there can also be additional approval steps where the commodity leader, a person from Finance & Accounting or someone from the PSSC wants to check and approve the shopping cart. There are no clear rules for these approvals, since it depends on a lot of different variables
(value, uniqueness of the items etc.). When all the approvers have approved the shopping cart, it is sent back to the TSSC. In the case of the hammer, there is no approval needed, because the value of the hammer is lower than 2000 euros. Therefore, the shopping cart can be transformed directly into a PO after the
approval of the TSSC. The creation of the PO is the next sub-process, and is explained in the next section.
2.1.2 Purchasing
The TSSC converts the shopping cart manually into a PO, after which it is sent to the supplier for confirmation. Most of the times, the supplier sends a confirmation to Philips. When the hammer arrives at
the facility, a goods receipt must be booked into the SAP system, so that the FSSC eventually can check if the products really arrived. There are some exceptions for this, because there is not always a goods receipt for services or replenishment orders.
Value of the
shopping cart Approvers < €2,000 No approval < €25,000 Level 1 < €250,000 Level 1,2
< €5,000,000 Level 1,2,3 + level 3 peer > €5,000,000 Level 1,2,3,4 + level 4 peer
Approval level Approvers No approval Requester
Level 1 Cost Center owner or Project Manager Level 2 Plant Manager (can differ per organization)
Level 3 Country Manager (can differ per organization)
Level 4
Executive committee or Group
21
2.1.3 Invoice handling
After the hammer is delivered, the supplier sends the invoice to the FSSC. First, the FSSC checks the invoice
visually, for example if there is a correct name and PO number on it. After this, the invoice is scanned, and it receives a Value Added Tax code. Then, the vendor data on the invoice is checked and compared with the data in the system. If everything is correct, the invoice is posted into the system. If there is no PO number
on the invoice, the invoice is parked for coding and the FSSC has to get back to the site to ask where the invoice belongs to, and on which cost center it should be booked. A cost center is an organizational sub-unit
to which costs may be charged for accounting purposes, but that not directly contributes to the profit of the company. When everything is clear, the invoice is posted into the system as well. After the posting, there is a two- or three-way matching process. Two-way matching means that the FSSC matches the invoice to the
PO, and checks if the values and quantities are the same. In addition, an e-mail is sent to the approvers via an add-in tool of the SAP system, to check whether the goods or services have arrived or not. Three-way matching means that they match the invoice with the PO and the goods receipt (if there is one registered in
the SAP system). Similar to the two-way matching, an e-mail is sent to the approvers to check if the goods or services have arrived or not. If there are no problems, the invoice is unblocked for payment.
2.1.4 Payment
After the invoice is unblocked for payment, it takes on average 65 days before Philips pays the invoice. This period is also called the payment term. Every day, the FSSC does a payment run, which means that they
collect all the payment orders in the SAP system that are due and payable. Then, the banking team of the FSSC checks and approves the payment run. The FSSC sends a remittance advice to the supplier to inform
the supplier that the money will be transferred within five days. After this, the payment instructions are sent to the internal Treasury Department of Philips (also known as the in-house bank). They perform a general vendor check, where they check for example if a vendor is not all of a sudden bankrupt. When the
payment term has passed, the in-house bank sends the invoice instructions to a third party bank, and the bank pays the supplier. This payment date is called the clearing date.
2.1.5 Challenges and bottlenecks
From the semi-structured interviews with multiple requesters, it turned out that several issues arise related
to the P2P process. A significant problem is that most of the requesters do not use the PPG when they order a product. Therefore, the requesters almost always choose for the free-text option, and do not check if there is a catalogue available at a certain supplier. In 2014, the percentage of spend that went via a catalogue was
only 0.81%5. When looking only at the Industrial commodity Industrial Services & Parts, which includes products like safety products, dies and moulds (all very suitable to buy via a catalogue), the percentage in 2014 is only 9.1%6. An additional problem that arises when the requesters do not use the PPG, is that the
preferred suppliers might not be used for a purchase. When a non-preferred supplier is used for a purchase, it costs a lot of extra time and money to register the supplier in the system. Besides that, PL IMS Procurement has a lot of preferred suppliers. When looking at the hand- and machine tools in Turnhout, there are already
5 Retrieved from SMART2, includes only PL IMS
22 54 preferred suppliers for free-text and 3 preferred suppliers for catalogues, of which they used only 29
supplier in the last 12 months7 and additionally, they used more than 11 non-preferred suppliers in this period. All the preferred suppliers in the list have been registered in eCM8, which is a tool that is used for
supplier contract management in IMS Procurement. However in the PPG, there is no contract identification number for most of the suppliers, which indicates that the systems are not linked very well. Another issue that arises, is the fact that there are a lot of CLOGS-codes. When the requester has to order something, she
first has to find the right CLOGS-code, but because there are so many, she chooses the first one that seems appropriate. This problem causes that spend can easily be booked on the wrong CLOGS-code. Because of all
these problems that arise when creating a shopping cart, a lot of the shopping carts are incomplete or wrong the first time when they are sent to the TSSC. According to the Operations Manager of the TSSC, the TSSC processes on average 7500 shopping carts per month, of which a maximum of 40% is complete and correct
the first time9. The processing of a complete shopping cart takes on average 5 minutes, but when a shopping cart is not complete it takes them on average 30 minutes. This means that they spend on average 1,875 extra
hours per month to complete and correct the wrongly filled in shopping carts. This is 22,500 hours per year, which is equal to at least 12 FTE10.
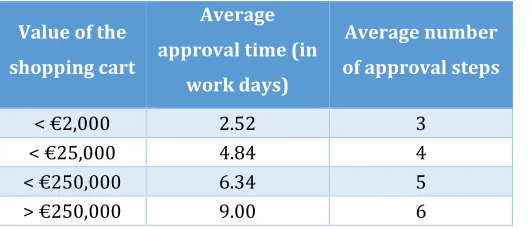
A different problem that some of the requesters brought up, is that it takes a long time before a shopping
cart gets approved. This is due to the relatively large number of approvers. In Table 3, an overview of the average approval times is given based on the value of the shopping cart11. It can be seen from the table that the higher the value of the shopping cart, the more approval steps, and the longer the approval time. On
[image:23.595.72.338.451.565.2]average, it takes more than a week to approve shopping carts with a value above 2000 euros.
Table 3 - Average approval time of a shopping cart
Another problem of the P2P process is that the overall compliance level to the processes is lower than 80%12. When looking at the period of April 2015 until June 2015, the PO compliance rate for PL IMS was
76%, and the SRM compliance rate was 74%. This relatively low level of compliance costs the company a lot of time and money. When an employee does not create a PO, the invoice is often sent to the site and it
needs to be forwarded to the FSSC first, however the FSSC cannot see to which department this invoice belongs to, because there is no PO number and they have to get back to the site again to find out. This costs a lot of extra time. The time between the invoice date and the date on which the invoice is registered in the
7 August 2014 – July 2015
8 Electronic Contract Management
9 Since May 2015
10 Assuming 1 FTE is 1840 hours a year
11 Retrieved from SMART2, based on all the shopping carts created in the period April - July 2015 for PL
12 Consisting of PO compliance and SRM compliance Value of the
shopping cart
Average
approval time (in
work days)
Average number
of approval steps
< €2,000 2.52 3
< €25,000 4.84 4
< €250,000 6.34 5
23 system by the FSSC, takes on average 26 days. Next to that, spend cannot be controlled and authorized when
people do not follow the right procedures. In addition, the Procurement Department can be completely bypassed, which means that IMS Procurement does not have an influence on what is bought, at what price,
and from which supplier.
Another challenge of the P2P process is that the sub-processes belong to two different departments, the requisitioning and purchasing processes belong to the Procurement Department, and the invoice handling
and payment processes belong to the Finance Department. Because there is no ownership for the entire process, no one feels really responsible for the overall performance of the process.
It can be concluded that there are some major challenges in the P2P process, which make it very important to measure and get insight into the overall performance of the process. The next section starts with describing the current performance measurement of the P2P process, and continues to describe some
related challenges and bottlenecks.
2.2 Performance measurement of the P2P process
Within Philips Procurement, there are two main parties that measure PIs. First, there is the Central
Reporting Group (CRG) which is responsible for a number of KPIs from the official KPI dashboard that Philips Procurement is using. CRG is a centralized reporting team of Philips Procurement, part of the PSSC, which makes reports about the purchasing KPIs and prepares other procurement analyzes on demand. Two
of the official KPIs that CRG is measuring are important for the P2P process. These KPIs are ‘Payment Terms’ and ‘Contract Coverage’. Payment terms is the three months weighted average Payment Terms against
spend in the rolling quarter. Contract coverage is the percentage of net spend covered by formally signed contracts. In addition to the official KPIs, CRG also measures SRM and PO compliance. The PO compliance is measured by matching the incoming invoices to the created POs, and see how much spend went via a PO.
The current formula to calculate the PO compliance rate is: 100 %13. The SRM compliance
is measured by the amount of spend that went via a shopping cart in the SRM system. The current formula
to calculate the SRM compliance rate is: 100 %. All ORUs that do not have SRM are excluded from the calculation, because they would always have a SRM compliance rate of 0%. Also, the
replenishment orders that are triggered by the SAP system itself are excluded, because the SRM system is not used for these items.
The second party that measures PIs is Infosys. Infosys creates a dashboard every month with 45 PIs that is
sent to the Finance Department (see Appendix IV). They have four different domains in their report of which P2P is one. Within the P2P domain, they measure 17 different PIs, which are all focused on the financial aspects of the P2P process. The dashboard is requested by the Accounting Operations Department of
Finance, and this department determines the PIs that are in the dashboard and the corresponding targets.
24 Besides the official KPIs, a lot of analysis is done by the commodity clusters for own purposes, based on the
information that can be retrieved from the reporting tool SMART2. SMART2 can create reports on ORU-level about, among others, spend, savings, payment terms, shopping carts and PO creation times. In addition,
a lot of milestones of the P2P process are registered in the system. Analysis based on these dates can be very useful to see which parts of the process take a long(er) time, since this can be an indicator of the low compliance rates.
2.2.1 Challenges and bottlenecks
Because the P2P process consists of two different parts that belong to two different departments, there is a lot of difference in performance measurement as well. The Finance Department has a lot of PIs, whereas the Procurement Department only measures a hand full of PIs. Overall, a lot of things are measured or can be
measured, but it is not clear what is really important. Interviews with persons that measure PIs showed that they are just measuring these PIs because it is part of their job, and the reason behind it is already forgotten. This is partly due to the fact that a large part of the P2P process is outsourced. A related problem
is the fact that sometimes exclusions have to be made for PIs, for example the exclusions of the SRM compliance that are described in Section 2.2. Some of the information to make the exclusions is determined a long time ago, and not updated anymore. This might be, because the people who decided on these
exclusions switched to another job, and the people from the CRG, who make the reports, are not allowed to determine what should be the exclusions or calculations for PIs. If a PI contains wrong exclusions, it can
give a wrong impression of the real values.
As already said, some PIs are measured incorrectly. The example of PO and SRM compliance, which can be a negative value or a value above 100% is already given in the Section 1.4. Another example of this, is the
performance indicator Contract Coverage. The performance indictor is supposed to measure if the contracts that Procurement has with a certain supplier are really used when buying a product from this supplier. The current way of measuring is that the CRG checks if there is a contract for a certain supplier in a certain
market when there is spend recorded for that supplier into the SMART2 system. This way of measuring does not give insight if the spend is really covered by a contract, it only shows if there is a contract with that
supplier in that market, but this contract can be for totally different products. The problem here is that the eCM system has no option to show the contracts on ORU level, SMART2 on the other hand does not show the contract identification numbers corresponding to a certain amount of spend. In short, there is no
alignment between the two systems.
The PIs in the KPI dashboard of Infosys, have targets that are determined by the Accounting Operations
Department of Finance. However, the PIs of Procurement, for example SRM and PO compliance, do not have clear targets. Therefore, you cannot really say when an ORU is performing below level.
Finally, there are many different opinions about the definitions of some of the PIs. When looking at the
25 (unique) preferred suppliers14. If you then ask the commodity clusters what they think a preferred supplier
is, they will say that a preferred supplier is a supplier that has priority rights, and that the supplier is to be preferred over all other suppliers in terms of providing the products or services that they have been
contracted for. Therefore, the term ‘preferred supplier’ should be well defined and accompanied with clear criteria.
2.3 Conclusion
This chapter answered Sub-question 1 ‘How are the current P2P process and its performance measurement
organized?’, and explained the current P2P process in detail as well as the current performance
measurement of the process. Several challenges arose from the current process: • No use of the PPG (by requesters)
• No use of preferred suppliers • No link between systems • A lot of CLOGS-codes
• A lot of time to correct the shopping carts (by TSSC) • Long approval times
• Relatively low compliance level • No process ownership
There are also several challenges that arose from the current performance measurement, which are the
following:
• Unclear what is really important to measure; too many PIs • A lot of not updated exclusions
• Inaccurate calculation of PIs • Lack of clear targets for PIs • Inaccurate definitions of PIs
This research aims at solving the challenges that arise from the current performance measurement, with
the creation of a PMS. The challenges that arise from the current P2P process are used as an insight to see where to company stands, and they confirm the need to create insight into the overall performance of the P2P process. This research will therefore not solve these challenges, but rather uses them as input for the
PIs. On the other hand, the PMS will provide the company with a better picture of the challenges that exist within the current process.
In the next chapter, a literature review is performed on design methods for a PMS, and on criteria for good PIs.
26
3.
Literature review
In this chapter, an overview of the existing literature about PMSs and criteria for good PIs is given. At the same time, this chapter gives an answer to Sub-question 2: ‘How can a PMS be created for the P2P process
according to the available academic literature?’ In the first section, the idea of a PMS and methods to design
a PMS are described, followed by the selection of a method to design the PMS for PL IMS Procurement. In Section 3.2, criteria for good PIs are described, and a selection is made of the criteria that the KPIs of PL IMS
Procurement have to meet. Finally, Section 3.3 explains a method on how to describe the KPIs for the PMS.
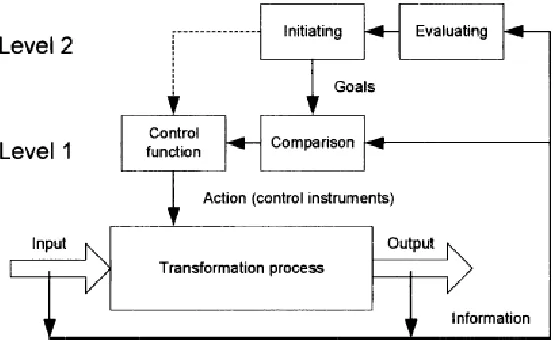
3.1 Performance measurement system
This idea of a PMS is illustrated in Figure 10. There are two levels of control on an organization. At level 1,
the operational level, the input and output is compared with the predefined goals. If there is a discrepancy between the actual value and the desired value, an appropriate action has to take place. Level 2 is the more strategic or tactical level, where the control loop is used to evaluate and adapt the operational level, by for
example changing the goals (Lohman, 1999).
3.1.1 Designing a performance measurement system
The complex process of designing a PMS requires structure and methodology. There exist multiple generic
methods to design a PMS, for example the model of Wisner and Fawcett (1991), Andersen and Fagerhaug (2002), and Cousins et al. (2008). All these design methods are quite similar and consist of a number of
steps that should be executed in order to design an effective PMS. The steps should rather be seen as a guideline, since the number and interpretation of the steps can vary by company (Andersen & Fagerhaug, 2002). Wisner and Fawcett (1991) propose a nine-step process, which places great emphasis on the firm’s
mission and strategic objectives. They underline the need for a firm to re-evaluate the appropriateness of the established PMS in view of the current competitive environment. Andersen and Fagerhaug (2002) created an eight-step process based on their experiences with a number of organizations. The method of
Cousins et al. (2008) consists of seven steps, and places great emphasis on feedback mechanisms of the system to undertake corrective actions when the performance is unfavorable. As already said, the model of Wisner and Fawcett (1991) strongly emphasizes on the firm’s mission and strategic objectives, and since
[image:27.595.74.351.329.501.2]27 prefer the other two models. Since the other two models are quite similar, the model of Andersen and
Fagerhaug (2002) is maintained in this research. A description of the steps of the three different models can be found in Appendix V.
The method of Andersen and Fagerhaug (2002) consists of an eight step methodology to create a PMS, which are discussed in more detail below:
1. Understand and map business structures and processes: consider and reflect on the organization
and its environment, its competitive position, and the existing business processes. This can even be a good opportunity to revisit some of the strategic issues of the company.
2. Develop business performance priorities: the PMS should support the requirements of the stakeholders from the organizational strategy to the business processes. It is important to have a clear view on the priorities before starting to design the PMS.
3. Understand the current PMS: a lot of companies have already some kind of measurement system in place, therefore you can either choose to introduce a new system to replace the old one, or to
redesign the existing system.
4. Develop performance indicators: select the set of PIs that will be used to measure the performance of the organization and business processes by combining a top-down and a bottom-up approach.
5. Decide how to collect the required data: it is important to know if and how you can collect the data that is required to calculate the chosen PIs in order to prevent selecting indicators that can never actually be measured.
6. Design reporting and performance data presentation formats: decide how the PIs will be presented to the users, who will have access to the data, and how users can use the data for management, monitoring, and improvement.
7. Test and adjust the PMS: test the system extensively and adjust the elements that do not work as planned. It does not mean that the PMS is perfect after this step; the system should always be
reviewed and updated to strive for perfection.
8. Implement the PMS: put the system to use, manage the user access, and provide training courses.
3.1.2 The PMS design method for PL IMS Procurement
The method of Andersen and Fagerhaug (2002) is used as a guideline for the design of the PMS for PL IMS Procurement. All the steps of the method can be linked to the sub-questions of this research and are shown
in Figure 11. Additionally, the figure explains what steps are actually taken in this research.
Step three of the method is changed from ‘Understand the current PMS’ into ‘Understand the current
28
3.2 Criteria for effective performance indicators
[image:29.595.68.401.65.677.2]This section provides a set of criteria for PIs, as well as elements to describe a good PI to be able to perform step four of the design method of Anderson and Fagerhaug (2002), where the PIs are developed.
Figure 11 - Link between design steps and research questions
Understand and map business structures and processes
• Sub-question 1.1: How is the current P2P process organized?
• Describe and reflect on the current P2P process.
Develop business performance priorities
• Sub-question 3.1: What are the needs and requirements of the stakeholders?
• Describe the requirements of the stakeholders for the new PMS.
Understand the current performance measurement
• Sub-question 1.2: How is the current performance of the P2P process measured?
• Describe how the performance of the P2P process is currently measured.
Develop performance indicators
• Sub-question 3.2: What should the KPIs in the PMS be and how should they be
measured?
• Select and describe the PIs for the PMS based on the requirements of the stakeholders,
taking into account the literature in Chapter 3.
• Sub-question 3.2: What should the KPIs in the PMS be and how should they be
measured?
• Describe how the data for the PIs should be collected.
Design reporting and performance data presentation formats
• Sub-question 3.3: What design should be used for the PMS dashboard?
• Decide on how the PIs will be presented in the PMS. How the users should use the PMS
is described in the step: ‘Implement the PMS’.
• Sub-question 3.4: How can the PMS be verified and validated?
• The PMS will not be tested extensively, but it will be examined if the PMS provides a
good overview of the overall performance of an ORU on the P2P process. The dashboard will be shown to the commodity cluster leader of IND & RE, as he needs to use the PMS to see if the ORUs within his clusters are performing according to the standards.
• Sub-question 4: How should PL IMS Procurement implement the PMS, and work with it?
• The implementation of the PMS is not in the scope of this research. Therefore, a
guideline is provided on how the company should implement the PMS and how the users should work with the system.
Implement the PMS
Decide how to collect the required data
29 One of the first articles about criteria for PIs is from George T. Doran (1981). Doran (1981) introduced
S.M.A.R.T. goals in performance measurement, which was an acronym that stood for:
• Specific – target a specific area for improvement and create specific goals that will tell you what is expected, why it is important, who is involved, where it is going to happen, and which attributes are important;
• Measurable – formulate concrete criteria to measure the progress in achieving the target; • Assignable – specify who will do it, since it will not be measured otherwise;
• Realistic – determine a state that can be achieved realistically, given the available resources; • Time-related – specify when the results can be achieved, mainly to establish a sense of urgency
(Meyer, 2003).
Doran made two important notes: not all objectives must be measured across all levels of management, as
in some instances the focus should rather be on the action plan for achieving the objective, and not every objective will meet all five criteria, but they should be rather seen as guidelines (Doran, 1981). The SMART acronym is one of the most used in businesses.
In the following years, a lot of literature was done on performance measures. Neely et al. (1997) created a list of 22 recommendations with regard to the design of performance measures based on an extensive
literature review on ten different papers and books about performance measurement . The 22 recommendations are the following:
1. Performance measures should be derived from strategy (Azzone et al., 1991; Dixon et al., 1990;
Fortuin, 1988; Goold, 1991; Kaplan & Norton, 1992; Lynch & Cross, 1991; Maskell, 1991);
2. Performance measures should be simple to understand (Azzone et al., 1991; Fortuin, 1988; Goold,
1991; Goold & Quinn, 1990; Lea & Parker, 1989; Lynch & Cross, 1991; Maskell, 1991);
3. Performance measures should provide timely and accurate feedback (Dixon et al., 1990; Fortuin, 1988; Globerson, 1985);
4. Performance measures should be based on quantities that can be influenced, or controlled, by the user alone or in co-operation with others (Fortuin, 1988; Globerson, 1985; Lynch & Cross, 1991); 5. Performance measures should reflect the “business process” – i.e. both the supplier and customer
should be involved in the definition of the measure (Fortuin, 1988; Globerson, 1985; Lynch & Cross, 1991);
6. Performance measures should relate to specific goals (targets) (Fortuin, 1988; Globerson, 1985; Goold & Quinn, 1990);
7. Performance measures should be relevant, i.e. referring to aspects that are controllable (Azzone et
al., 1991; Fortuin, 1988; Lynch & Cross, 1991);
8. Performance measures should be part of a closed management loop (Globerson, 1985; Kaplan &
Norton, 1992);
9. Performance measures should be clearly defined (Fortuin, 1988; Globerson, 1985); 10. Performance measures should have visual impact (Fortuin, 1988; Lea & Parker, 1989);
30 12. Performance measures should be consistent (in that they maintain their significance as time goes
by) (Fortuin, 1988; Lynch & Cross, 1991);
13. Performance measures should provide fast feedback (Fortuin, 1988; Maskell, 1991);
14. Performance measures should have an explicit purpose (Globerson, 1985);
15. Performance measures should be based on an explicitly defined formula and source of data (Globerson, 1985);
16. Performance measures should employ ratios rather than absolute numbers (Globerson, 1985); 17. Performance measures should use data which are automatically collected as part of a process
whenever possible (Globerson, 1985);
18. Performance measures should be reported in a simple consistent format (Lynch & Cross, 1991); 19. Performance measures should be based on trends rather than snapshots (Lynch & Cross, 1991);
20. Performance measures should provide information (Fortuin, 1988);
21. Performance measures should be precise – be exact about what is being measured (Fortuin, 1988);
22. Performance measures should be objective – not based on opinion (Fortuin, 1988).
We selected 18 out of the 22 recommendations for the KPIs in the PMS for the P2P process of PL IMS Procurement based on the current situation as described in Chapter 2. These 18 recommendations are in
line with the strategy at PL IMS Procurement. The recommendations that are not taken into account are: • Recommendation 5: this research focuses on an internal process of Philips, therefore, the view of
the supplier is not taken into account, since it can be contradicting to the view of Philips.
• Recommendation 12: the recommendation states that the performance measures should maintain their significance as time goes by, however, because of the dynamic environment in which the company is currently operating, and the current underperformance of the P2P process, some of the selected KPIs for the PMS might be less relevant in the future, when the performance of these KPIs
remains optimal, and is less important to monitor continuously.
• Recommendation 17: this is quite difficult for PL IMS Procurement, since they are using a lot of different systems, which makes it very hard to automatically collect data as part of the process. The data should probably be downloaded and uploaded to the system manually (which is currently also done for the Infosys KPI dashboard).
• Recommendation 19: this recommendation is not taken into account, because snapshots can also give insight in the current status of an ORU at a certain time. Although trends provide more information about the performance of an ORU, snapshots might be relevant and interesting as well.
These recommendations are excluded to make sure that PIs that might be relevant for the company, are not excluded beforehand. This does not imply that the final KPIs will fulfill all the excluded recommendations. Also, the recommendations that are excluded had only one source and did not support the performance
measurement sheet, which is discussed in the next section.
3.3 Elements for a ‘good’ performance measure
In addition to the list of recommendations for performance measures, Neely et al. (1997) introduced a