Jasmin Sophie Bigga
Email: [email protected] Studentnumber: 1521381
June 2018
University of Twente, Enschede, Netherlands
Faculty of Behavioural, Management and Social Sciences Department of Cognitive Psychology & Ergonomics
First Supervisor: Prof. Dr. F. van der Velde Second supervisor: Dr. M. Schmettow
Conceptual Learning:
1
Table of Contents
Abstract ... 3
1. Introduction ... 4
2. Theoretical framework ... 4
2.1. Where do we know what we know? Localizing semantic representation in the brain ... 4
2.2. Mapping semantic selectivity – The study of Huth et al. (2016) ... 6
3. Does the way in which people categorize concepts resemble their semantic representation in the brain?: The current research ... 7
3.1. Open Multilevel Card Sorting ... 8
3.2. Likert-scale questionnaire ... 8
4. Method ... 9
4.1. Participants ... 9
4.2. Materials ... 9
4.3. Procedure ... 10
4.4. Data Analysis ... 10
5. Results and Discussion ... 12
5.1. The Card sorting experiment ... 12
5.2. The questionnaire ... 17
5.2.1. Item fit in the category ‘social’ ... 19
5.2.2. Item fit in the category ‘mental’... 20
5.2.3. Item fit in the category ‘violence’ ... 21
5.2.4. Item fit in the category ‘person’ ... 22
5.2.5. Item fit in the category ‘time’ ... 23
6. General Discussion ... 24
6.1. Strengths and Limitations of the current study ... 26
6.2 . Practical implications ... 27
6.3. Conclusion ... 28
7. References ... 29
8. Appendices ... 31
3 Abstract
Semantic cognition is an essential skill that enables us to make sense of and bring meaning to verbal and non-verbal experiences around us. There are several theories about where semantic information is represented in the brain, among which the hub-and-spoke theory, which suggests system of modality-specific spokes that are in constant communication with a polymodal hub in the anterior temporal lobe (ATL) area. However, there is little research about the relation
between semantic representation in the brain and how this conceptual knowledge is used. The current study aimed to examine this relation by comparing the categories of the semantic map of Huth, de Heer, Griffiths, Theunissen & Gallant, 2016 with how participants grouped the
concepts during a card sorting experiment. Even though some groups showed similarities with the categories discovered by Huth et al. (2016) none of the groupings could be replicated one-on-one, which suggests that semantic representation in the brain as found by Huth et al. (2016) is not equal to the use of conceptual knowledge in an open card sorting task.
4 1. Introduction
“Friend or foe?”, “edible or poisonous?”. Semantic cognition is an essential vital skill that enables
us to make sense of and bring meaning to verbal and non-verbal experiences around us (Lambon Ralph, Sage, Jones & Mayberry, 2010; Maddox & Ashby, 2004). The term semantic cognition broadly refers to the “ability to use, manipulate and generalize knowledge that is acquired over
the lifespan” (Lambon Ralph, Jefferies, Patterson, & Rogers, 2016, p.42) which makes humans capable of engaging in context-appropriate behavior and provides the basis for everyday behavioral acts (Lambon Ralph et al., 2010; Lambon Ralph et al., 2016).
The current paper will focus on where semantic knowledge is represented in the brain and whether this presentation can predict the use of this conceptual knowledge. Since there are different theories about concept representation that partly contradict each other, only one of the most influential theories, the ‘hub-and-spoke theory’ as proposed by Rogers et al. (2004), will be discussed in more detail. Furthermore, semantic representation will be discussed in the light of the research of Huth, de Heer, Griffiths, Theunissen and Gallant (2016), who developed a “semantic atlas” by comparing the brain activation of seven subjects who listened to different short stories.
The current research is directly based on the outcomes of this study and is focused on the question whether the semantic categories as found by Huth et al. (2016) can adequately resemble the way people categorize concepts during a card sorting task. For a more elaborate discussion of the current research, the interested reader is referred to section three.
2. Theoretical framework
2.1.Where do we know what we know? Localizing semantic representation in the brain
There are several views on where semantic information is represented in the brain. Some theories opt for a “distributed-only” system, which entails that semantic information is represented
5 As the ‘distributed only’ view, the hub-and-spoke model assumes a multimodal system that is distributed across wide areas of the cortex (Rogers et al., 2004; Lambon Ralph et al., 2016). Multimodal verbal and nonverbal information that is provided through the senses is thereby encoded in modality specific cortical areas (i.e. the visual cortex in the occipital lobe), the so-called ‘spokes’. However, the hub-and -spoke model runs counter the ‘distributed only’ view by
further assuming that the cross-modal interactions between the ‘spokes’ are mediated by a central trans-modal hub (Hoffman & Lambon Ralph, 2011; Chiou, Humphreys, Jung & Lambon Ralph, 2018). The hub thus acts as a central structure which integrates the sensory-, verbal-, and motor information (information about motion and complex movements) from the unimodal spokes and transforms it into deep, coherent and generalizable concepts (Chiou et al., 2018; Hoffman, Evans & Lambon Ralph, 2014). Because of the polymodal nature of the hub these generated representations are also modality independent and therefore involved in the conceptualization for all types of categories (Pobric, Jefferies & Lambon Ralph, 2010).
A large body of neuroimaging research suggests that this central hub is located in the ventrolateral anterior temporal lobe area (vATL). For example, studies with patients with semantic dementia (which is associated with an atrophy in the vATL area) showed that participants had severe deficits in integrating different stimuli dimensions into one coherent concept and could only judge single stimulus dimensions in an odd-one out task. (Hoffman et al., 2014). In this task the subjects were presented with seven stimuli, three identical pairs and one ‘odd’ stimulus that did not match any of the other cards. When the ‘odd’ stimulus differed on one dimension, for example,
when it had different shape than the stimuli on the other cards, subjects with semantic dementia were able to ‘odd out’ the correct stimulus. However, when the odd stimulus was different on more
6
2.2. Mapping semantic selectivity – The study of Huth et al. (2016)
Although the neural basis of the semantic system has been widely studied, little is known about the semantic selectivity of the structures involved, as not enough information has been gathered to provide a general framework (Huth et al., 2016).
The study of Huth et al. (2016) aimed to create a map of semantic selectivity by having seven subjects listen to stories of the “Moth Radio Hour” for two hours, while recording their brain
blood-oxygen (BOLD) levels through functional magnetic resonance imaging (fMRI). Huth and his colleagues analyzed more than 10,470 words based on the Radio hour stories and most common English words, using a voxel-wise modelling technique*, which is regarded an effective method for analyzing complex stimuli (Huth et al., 2016). From this analysis twelve distinct semantic categories could be identified as shown in Table 1.
Table 1.
Categories proposed by Huth et al. (2016)
ID Category name
1 tactile
visual numeric locational
abstract temporal (time)
7 Professional (Person) violence communal
mental emotional
social
2 8
3 9
4 10
5 11
6 12
7 A principal component analysis (PCA) of the categories further revealed four dimensions within the semantic space. The first dimension relates to concepts of social interaction and perceptual descriptions including the categories social, violence (social interaction) and visual, locational and tactile (perceptual descriptions). The second dimension seems to be related to perceptual as well as non-perceptual concepts (Huth et al. 2016), including the categories visual, tactile (perceptual) and mental and temporal (non-perceptual). The third and fourth dimension however could not be categorized as well as the first two and remain at a rather broad level.
3. Does the way in which people categorize concepts resemble their semantic
representation in the brain?: The current research
The semantic map developed by Huth et al. (2016) suggests that semantic representation involves a broad neural network that covers large regions of the cortex, with a focus on broad regions of the prefrontal cortex (PFC), the lateral and ventral temporal cortex (VTC), and lateral and medial parietal cortex (LMPC). Furthermore, this pattern of semantic selectivity seems to be generalizable across individuals, which suggests a unitary semantic system. However, it remains unclear whether individuals categorize concepts as it is suggested by the semantic map, since categorization was accessed in terms of (increased) blood-oxygen levels in the brain and not on verbal reports. Therefore, the following research question is posed:
Does the way in which people categorize concepts resemble their semantic representation in the
brain?
8 underlying category (as found in Huth et al., 2016). As not all readers may be familiar with the mentioned methods, they will be elaborated on further in the following sections.
3.1. Open Multilevel Card Sorting
Card sorting tasks are a common method in fields such as user interface design, to elicit and identify mental models of participants (Wood & Wood, 2008; Schmettow & Sommer, 2016). The card sort employed in this study is an example of an open multilevel card sorting technique. As already mentioned, in this form of card sorting, participants are entirely free to create own categories and assign as much items to them as they regard as suitable. During the process, participants are encouraged to further divide the formed categories into subcategories to create a hierarchical structure, hence this technique is also referred to as ‘hierarchical card sort’
(Schmettow & Sommer, 2016; Hudson, 2005). The grouping structures that emerge from the card sorting are then used to calculate the similarity between items and to construct a three-dimensional similarity matrix, which displays the semantic proximity between any two tested items (Schmettow & Sommer, 2016). To identify clusters in the similarity matrix a hierarchical cluster analysis (HCA) is often performed, which stepwise merges items that display the highest similarity. The results of the HCA are typically presented in form of a tree diagram (also called dendrogram) that also convey the merging steps in addition to the clusters. Another form of presentation is an ordered heatmap that indicates the clusters through color coding and which has the advantage of displaying ambiguities of items, that cannot be seen in the dendrogram (Schmettow & Sommer, 2016).
3.2. Likert-scale questionnaire
Likert scales are one of the most widely used psychometric tools in social sciences research (Joshi, Kale, Chandel & Pal, 2015). The scale is primarily used to measure participant’s attitudes
9
4.1. Participants
In total 20 participants took part in the study with 65% (13) being female, 30 % (6) male and 5%(1) identifying as other than female or male. The age ranged from 18 years to 53 years with a mean age of 23,25 years (SD 7,14). The participants were recruited through convenience sampling and all stemmed from the personal network of the researcher. All subjects participated on a voluntary basis and signed an informed consent. Furthermore, none of the participants were native speakers, but had sufficient knowledge of the English language to complete the study.
4.2. Materials
For deriving the stimuli, five of the twelve categories found by Huth et al. (2016, see table 1 for an overview of the categories) were selected as starting point. These categories were:
violence, social, person, time and mental. For each of the categories two voxels were chosen from the semantic brain atlas of Huth et al. (2016), selecting one voxel in the left and one voxel in the right hemisphere when possible. As not all parts of the brain are equally strongly activated during categorization, only voxels with a model performance of at least ‘not bad, pretty reliable’ were
selected. From this first selection, 50 items (approximately 10 items per category) were selected for the final stimulus set (see Appendix A). In addition, 20 ‘filler’ items were chosen from the other categories of the semantic atlas (visual, number, bodypart, outdoor, tactile and place).
For the card sorting task 50 paper flash cards were prepared with one item on each card. Furthermore, paper labels with different numbers were prepared to be able to indicate the number of groups (and subgroups) made by the participants.
10
4.3. Procedure
As already mentioned, to study the categorization of the described concepts, a combination of an open card sorting task and a Likert-scale questionnaire was employed. After signing the informed consent participants were presented with 50 cards with the different concepts. The participants were then asked to carefully read all cards and group concepts together that seemed related in their opinion. To avoid leading participants in a certain direction, the researcher refrained from clarifying ambiguous or unfamiliar items. Instead, participants were asked to leave the unfamiliar items out of the sorting process. For the first round, participants were instructed to categorize the items at a rather broad level to leave room for further divisions in the upcoming rounds. Furthermore, participants were free to end the sorting process before Round 3 and refrain from a further division of groups when not feasible in their opinion. After each round completed, all formed (sub-)groups were provided with numerical labels and photographed for later analysis.
After completing the card sorting procedure, participants were placed in front of a laptop provided by the researcher and were asked to fill in the questionnaire. For each of the 70 concepts participants were asked to indicate the degree to which it represented the given category in their opinion, ranging from 1 (not at all related) to 5 (very strongly related). One example of a question was:
“Please indicate the extent to which each pair of concepts is related in your opinion: "sometime" and "mental".
After having filled in the questionnaire, participants were given room for questions about the study and feedback and were thanked for their participation.
4.4. Data Analysis
As pointed out by Schmettow and Sommer (2016), Card Sorting is an exploratory technique that entails qualitative as well as quantitative aspects. The sorting process itself is qualitative, however the similarity scores that are calculated between the items are quantitative of nature.
11 one another. It is constructed by counting the number of groups that both items (X and Y) are part of and then dividing this score by the number of groups to which either of the items belong (Schmettow & Sommer, 2016).
Instead of a hierarchical cluster analysis, which was mentioned earlier as a common method for construction of the clustered heatmap and the dendrogram, the current study used the vector approach for the analysis of the clusters. The vector approach was chosen, because it is more in line with Huth et al. (2016), as concepts are also represented as vectors in the semantic map (each voxel represents a component of the vector of a given concept). Furthermore, the vector approach has the advantage that every step of the analysis is based on the comparison of all data points (or items), instead of merely one data point (the item/concept pair with the highest score at the given step), making the analysis more complex (Van der Velde, 2018). The basic assumption of the vector approach hereby is that if two concepts are strongly (semantically) related with each other, they should score similar in other clusters (i.e. if item X seems to be only weakly related with item Z, item Y is also expected to be weakly related with Z). The relation between items is defined by the Euclidian distance of their two vectors (their summarized scores with the other items).This distance measure is calculated by summarizing the squared differences of both vectors and then taking the square root of the sum. The lower this Euclidean distance score is, the stronger the relationship between two items is. From these calculated distances the dendrogram and the heatmap were constructed.
12 5. Results and Discussion
5.1. The Card sorting experiment
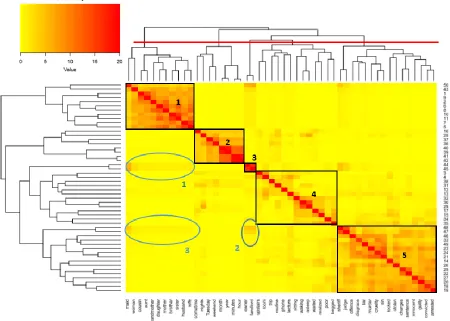
13 Figure 1. Heatmap of the combined groupings of the 20 subjects
14 Table 2.
Summarized concept clusters of all card sorts (N = 20)
Cluster 1 Cluster 2 Cluster 3 Cluster 4 Cluster 5
maid woman cousin aunt grandmother daughter mother brother sister husband wife sometime nights tuesday weekend month year minutes hour owner landlord upstairs room trip routine phone lecture sitting waking asleep waited realized poor begged sheriff judge offence disgrace liar murder cruelty sin locked stolen charges sentence innocent guilty convicted arrested
As indicated by the bold words in Table 2, the first cluster shows large overlap with the category social that was found by Huth and his colleagues (2016, see table x for an overview), with eight items matching the named category. However, subjects did not fully replicate the proposed category, as the items maid, woman and mother are not part of the category social.
When looking at the items, it can be seen that almost all items are related to an overarching concept that could be named familyas the items represent different family members. It therefore seems logical that subjects grouped them together in the card sorts. The grouping of the items
woman and maid seem less straightforward at the first glance, however they also fit the category well. For example, a grandmother is also a woman. Furthermore, a maid could also be regarded as part of the family in a broader sense, which could explain why the concept maid was grouped together with family members.
15 possible explanation for this finding is that both items have hardly any semantic overlap with the concept of family, which is why these items do not seem to fit this cluster well.
As the first cluster to the category social, the second cluster bears resemblance with the category ‘time’ that was proposed by Huth et al. (2016, see Table 3) with five of ten items being
identical to this category (see table x). However, the three concepts sometime, nights and hour that were grouped with these items do not appear in the category that Huth et al. (2016) suggested. This seems odd in the light that the concept all of these concepts have a strong semantic overlap with ‘time’.
In addition to the already mentioned differences, the category of Huth et al. (2016) comprises items as phone, room and sitting (view Table 3 for the full list) that were not regarded as semantically similar to time by the subjects. One could argue that a concept like sitting for example could fit the category in a broader sense, by explaining that sitting can be measured in terms of time spent sitting. However, this might not be the first intuition when thinking about the relation between sitting and time. Since the subjects were asked to group the concepts according to their first intuition, this might be a possible explanation why the category of Huth et al. (2016) was not completely replicated by the subjects.
The third cluster comprises the two items landlord and owner which are both part of the category person (Huth et al. 2016, see Table 3). These items seem to have a special semantic relation as they depend on each other (to be a landlord, one must be the owner of the house). Furthermore, the cluster carries ambiguities as indicated by the bleeding spot in the heatmap (1). This bleeding spot shows that the concepts landlord and owner are also associated with the items in the first cluster. This is not surprising, as this cluster is formed by concepts that not only represent roles within a family but also persons. Furthermore, a second ambiguity shows a relation between the two mentioned concepts and the concept sheriff (as indicated by the blue circle with the number 2). This is in line with the findings of Huth et al. (2016) who found a semantic relation between all three concepts.
Apart from the mentioned similarities between the groupings, the category ‘person’ also
16 that both mentioned items strongly point to a criminal context, which is why this association might have been stronger in participants than the association between convicted and stolen and the concept person.
The fourth cluster consists of items found in both the category time and mental (Huth et al., 2016, see Table 3). This cluster has a special role, since the grouping looks to be rather arbitrary in comparison with other clusters as no obvious relation between the concepts seems to exist. Therefore, it is hard to give an interpretation to the differences between the cluster and the category
mental thatHuth and colleagues (2016) proposed.
The fifth cluster shows the largest overlap with the findings of Huth et al. (2016, see Table 2 and 3). Except for the concept poor all concepts of the category violence appear in this cluster. In addition to that, the cluster comprises the items sheriff, locked, stolen, convicted and arrested.
Even though these items are not part of the category that was proposed by Huth and his colleagues (2016), their grouping with the items of the category ‘violence seems logical.
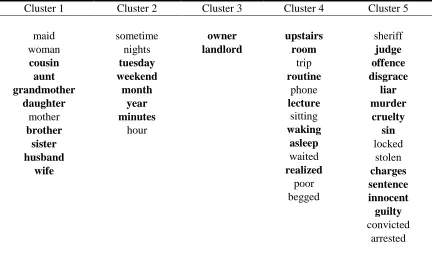
17 Table 3.
Items per category as found by Huth et al. (2016)
Category 1 (social) Category 2 (time) Category 3 (person) Category 4 (mental) Category 5 (violence) arrested aunt sister husband wife daughter begged grandmother cousin brother weekend year month Tuesday trip room phone sitting waited minutes mother landlord sheriff maid owner convicted stolen woman waking asleep nights realized sometime hour lecture locked upstairs routine charges innocent offence judge poor cruelty disgrace sentence sin liar guilty murder
5.2. The questionnaire
18 Table 4.
Mean scores per category
N M SD
Social 20 2.83 .77
Mental 20 2.21 .66
Violence 20 3.73 .56
Person 20 3.59 .61
Time 20 3.68 .47
Note. Social (arrested, aunt, sister, husband, wife, daughter, begged, grandmother, cousin, brother). Time (weekend, year, month, Tuesday, trip, room, phone, sitting, waited, minutes). Mental (waking, asleep, nights, realized, sometime, hour, lecture, locked, upstairs, routine). Person (mother, landlord, sheriff, maid, owner, convicted, stolen, woman). Violence (charges, innocent, offence, judge, poor, cruelty, disgrace, sentence, sin, liar, guilty, murder)
Table 4 gives an overview of the overall fit of the different categories. The categories violence,
19
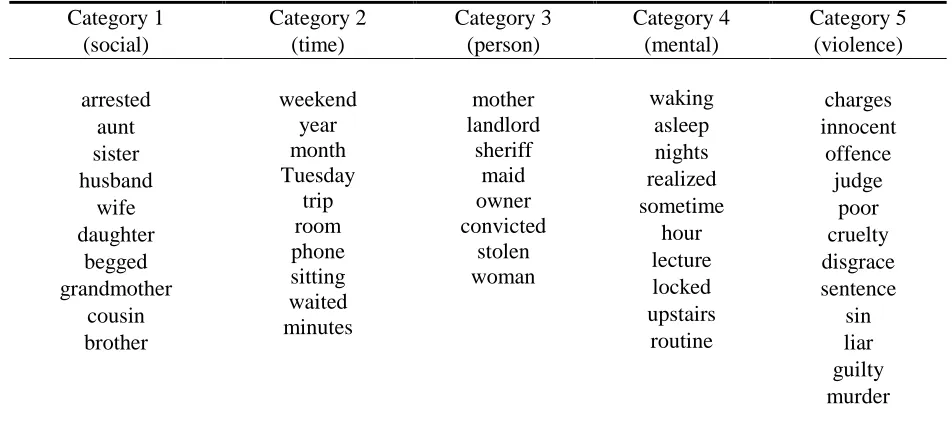
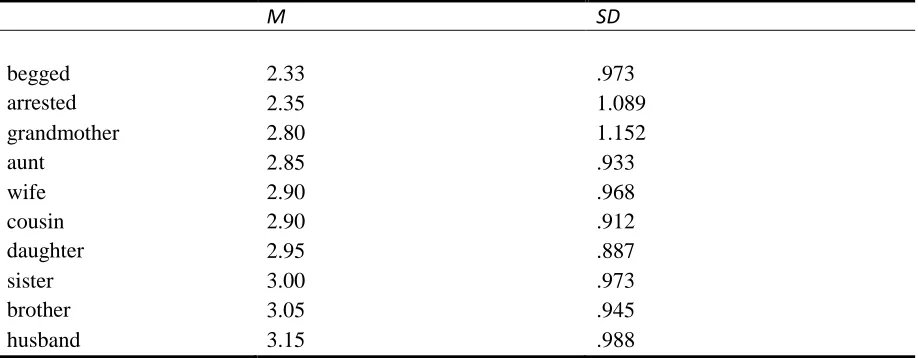
[image:20.612.74.533.183.362.2]5.2.1. Item fit in the category ‘social’
Table 5.
Mean scores and standard deviations of the items in the category ‘social’
M SD
begged 2.33 .973
arrested 2.35 1.089
grandmother 2.80 1.152
aunt 2.85 .933
wife 2.90 .968
cousin 2.90 .912
daughter 2.95 .887
sister 3.00 .973
brother 3.05 .945
husband 3.15 .988
20
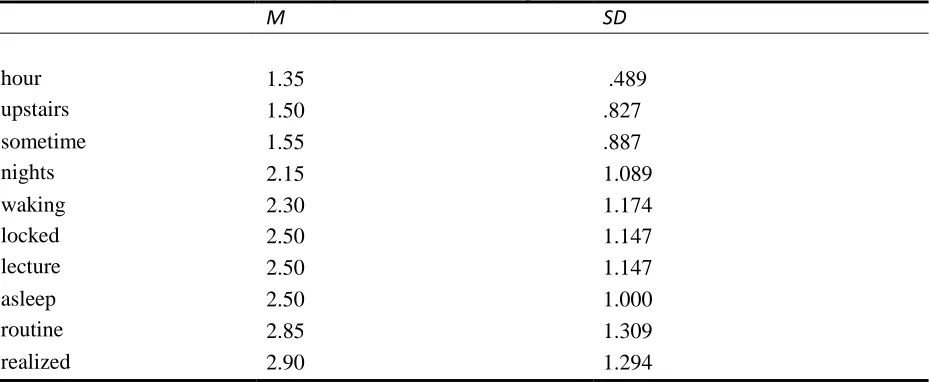
[image:21.612.77.542.153.344.2]5.2.2. Item fit in the category ‘mental’
Table 6.
Mean scores and standard deviations of the items in the category ‘mental’
M SD
hour 1.35 .489
upstairs 1.50 .827
sometime 1.55 .887
nights 2.15 1.089
waking 2.30 1.174
locked 2.50 1.147
lecture 2.50 1.147
asleep 2.50 1.000
routine 2.85 1.309
realized 2.90 1.294
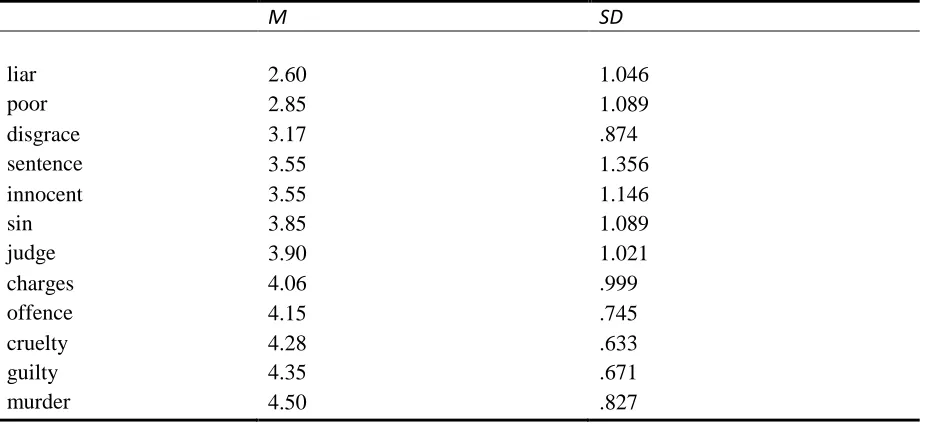
21 Table 7.
Mean scores and standard deviations of the items in the category ‘violence’
M SD
liar 2.60 1.046
poor 2.85 1.089
disgrace 3.17 .874
sentence 3.55 1.356
innocent 3.55 1.146
sin 3.85 1.089
judge 3.90 1.021
charges 4.06 .999
offence 4.15 .745
cruelty 4.28 .633
guilty 4.35 .671
murder 4.50 .827
22
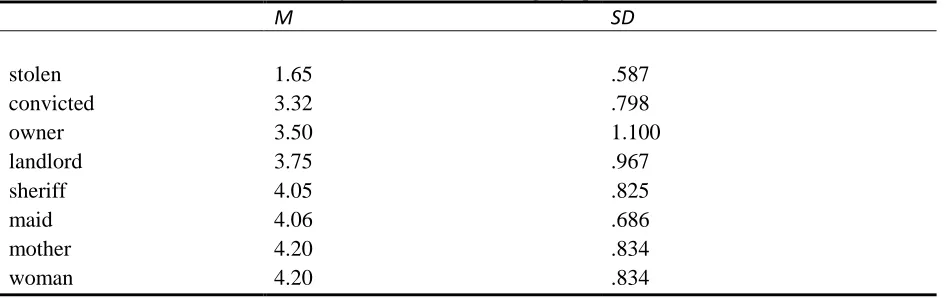
[image:23.612.73.548.153.302.2]5.2.4. Item fit in the category ‘person’
Table 8.
Mean scores and standard deviations of the items in the category ‘person’
M SD
stolen 1.65 .587
convicted 3.32 .798
owner 3.50 1.100
landlord 3.75 .967
sheriff 4.05 .825
maid 4.06 .686
mother 4.20 .834
woman 4.20 .834
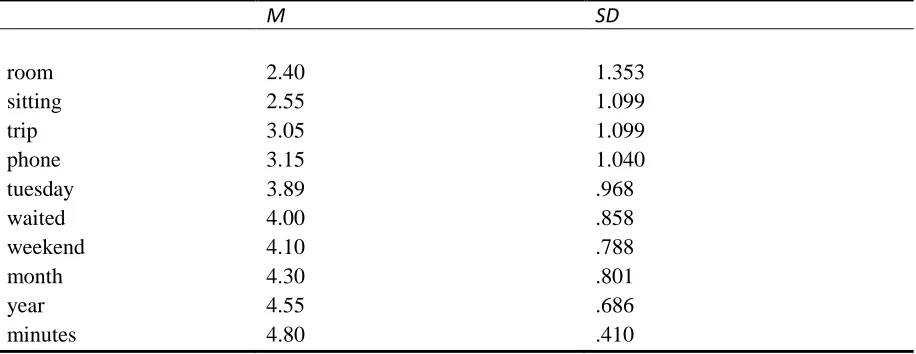
23 Table 9.
Mean scores and standard deviations of the items in the category ‘time’
M SD
room 2.40 1.353
sitting 2.55 1.099
trip 3.05 1.099
phone 3.15 1.040
tuesday 3.89 .968
waited 4.00 .858
weekend 4.10 .788
month 4.30 .801
year 4.55 .686
minutes 4.80 .410
24
6. General Discussion
The aim of the current study was to answer the question whether the way people categorize concepts resemble their semantic representation in the brain. As mentioned earlier, Huth and his colleagues (2016) found brain activation across wide areas of the cortex, that cover the superior and inferior prefrontal cortex (SPFC, IPFC), lateral and ventral temporal cortex (LTC, VTC), and lateral and medial parietal cortex (LPC, MPC). The results further suggest that a large portion of the mentioned areas hold semantic information about specific semantic concepts. Both findings are in line with the ‘Hub-and-Spoke’ theory by Rogers et al. (2004), which assumes the central structures of the ‘semantic system’ in the cortical areas were Huth et al. (2016) found the brain
activation.
From the analysis of the experimental data, Huth et al. (2016) derived twelve categories that summarize the semantic selectivity of the different voxels. These categories were then used to construct the semantic map to visualize where they appear in the semantic space. As it was not feasible to integrate all twelve categories from Huth et al. (2016) in the current study, a selection of five categories was made. For each category, two related voxels were extracted as a sample from different areas of the cortex in the semantic map for constructing the dataset for the card sorting experiment and the questionnaire.
The summarized structure of the twenty card sorts showed similarity with the concepts from the chosen voxels. For example, with the exception of one item, all concepts extracted from the two voxels related to the category violence (as shown in Table 3 in the results section) were consistently placed in one group by the subjects across card sorts. This indicates that these concepts were highly congruent with the subjects’ mental model of this category. However, no category
25 for this hypothesis is provided by the results of the questionnaire which show that subjects indeed rated the concept arrested as only weakly related to the category social. This finding is also in line with the research of Coxon (1999) who points out that categories are defined in terms of exemplars that are most representative of the category. As the concept arrested can be regarded as a rather atypical example of the category social, it seems not surprising that the item arrested did not appear together with other concepts of the category social in the groupings of the card sorts.
As the card sorting data, the results of the questionnaire partly contradict the findings of Huth et al. (2016). The analysis revealed that the semantic similarity between the concepts and the overarching category was rated as high for the categories time, violence and person. This suggests a strong overlap with the subjects’ mental model of these three categories. The categories
social and mental by contrast scored relatively low on the perceived semantic similarity. Especially for the category social this seems odd, as this category showed large overlap with the category as proposed by Huth et al. (2016, see table x). However, a possible explanation for this finding could be that this category (as well as the category mental) is relatively abstract in comparison with earlier mentioned categories and might therefore be less obvious and intuitive. This hypothesis is again supported by Coxon’s (1999) findings that categories are defined in terms of highly
representative exemplars. For example, the concept grandmother might be seen as more representative for the category person (since it is obvious that a grandmother is a person) as opposed to the category social which is more abstract and therefore less obvious. Therefore, the connection between grandmother and person might be more intuitive than the connection between
grandmother and social what would explain the lower scores of this concept on semantic similarity with the category social.
26 As mentioned earlier, knowledge about modality-specific features relies on the spokes that are distributed across the cortex, while coherent concepts are formed through the communication of both the polymodal hub and the modality-specific spokes (Pobric, Jefferies, & Lambon Ralph, 2010; Rogers et al., 2004). In addition to that, a second executive system located in the left frontoparietal area, mediates the selection of task-relevant knowledge from the semantic network to generate appropriate behavior in verbal and nonverbal contexts (Chiou et al., 2018; Lambon Ralph, 2014). Thus, semantic representation and the use of this semantic knowledge appear to be two different things, which provides another explanation for the differences found between the results of Huth et al. (2016) and the findings of the current study.
6.1. Strengths and Limitations of the current study
A strong aspect of the current study is the simplicity of the procedures. Both the questionnaire and the card sorting were straightforward and easy to understand, even for subjects who were unfamiliar with these research methods. Therefore, participant errors that might have affected the results are less likely. Another strength is the nature of the card sorting procedure. The current study employed an open hierarchical technique, which has the advantage being more flexible and more profound than single level and closed card sorts. (Schmettow & Sommer, 2016). Hereby, a more accurate representation of the mental models of subjects for comparison with the semantic map (Huth et al., 2016) could be obtained.
However, apart from the strong aspects the current study also has several limitations. One major limitation is related to an error made by the researcher during the construction of the questionnaire. Originally it was planned to include 20 filler items extracted from other voxels (not related to the five experimental categories) and assign arbitrary category names from the experimental items to these filler items. It was expected that the filler items with the fake category names would score significantly lower on perceived similarity than the experimental items. However, the researcher failed to provide the filler items with these arbitrary names and included them in the questionnaire with the original category names. The purpose of the filler items was hereby defeated and the items therefore could not be used for analysis.
27 grouped the items ‘arrested’ (from the category social) and ‘guilty’ (from the category violence)
together in the card sort he or she might be less inclined to view them as belonging to two different categories when presented with the items in the questionnaire.
A last aspect that can be considered a limitation of the current study, as it might have influenced categorization is the language in which the current study was conducted. Unlike in the study of Huth and his colleagues, none of the participants in the current study had English as native language but were subordinate bilinguals, people that learned English as a foreign language. Research (e.g. by De Groot, 1992 & Pavlenko, 1999) suggests that people who were not raised bilingual but acquired the second language at a later age, often link concepts in the foreign language to concepts in their native language. However, concepts across different languages do not always overlap completely (De Groot, 1992). Even though all participants were fluent in English, it cannot be ruled out that the differences between the categories from the Huth et al. (2016) study and the clusters from the card sorts are merely a result of differences in categorization between native speakers and participants with English as second language.
6.2. Practical implications
28
6.3. Conclusion
29 Bertram, D. (n.d.). Likert scales[Topic report]. Retrieved from:
https://www.scribd.com/document/305340149/Topic-Dane-Likert
Chiou, R., Humphreys, G. F., Jung, J., & Lambon Ralph, M.A. (2018). Controlled semantic cognition relies upon dynamic and flexible interactions between the executive “semantic control” and hub-and-spoke “semantic representation” systems. Cortex. Elsevier Ltd. http://doi.org/10.1016/j.cortex.2018.02.018
Coxon, A. P. M. (1999). Sorting Data. Thousand Oaks, CA: Sage.
De Groot, A. M. B. (1992). Bilingual Lexical Representation: A Closer Look at Conceptual Representations. Advances in Psychology, 94(C), 389–412. http://doi.org/10.1016/S0166-4115(08)62805-8
Hoffman, P., Evans, G. A. L., & Lambon Ralph, M.A. (2014). The anterior temporal lobes are critically involved in acquiring new conceptual knowledge: Evidence for impaired feature integration in semantic dementia. Cortex, 50(1), 19–31.
http://doi.org/10.1016/j.cortex.2013.10.006
Hoffman, P., & Ralph, M. A. L. (2011). Reverse concreteness effects are not a typical feature of semantic dementia: Evidence for the hub-and-spoke model of conceptual representation.
Cerebral Cortex, 21(9), 2103–2112. http://doi.org/10.1093/cercor/bhq288
Hudson, W. (2005). Playing your cards right: Getting the most from card sorting for navigation design. Interactions, 12(5), 56–58. http://doi.org/10.1145/1082369.1082410
Huth, A. G., Heer, W. A. De, Griffiths, T. L., & Gallant, J. L. (2016). Nature, 532(7600), 453– 458. http://doi.org/10.1038/nature17637.Natural
Joshi, A., Kale, S., Chandel, S., & Pal, D. (2015). Likert Scale: Explored and Explained. British Journal of Applied Science & Technology, 7(4), 396–403.
http://doi.org/10.9734/BJAST/2015/14975
Lambon Ralph, M. A., Sage, K., Jones, R. W., & Mayberry, E. J. (2010). Coherent concepts are computed in the anterior temporal lobes. Proceedings of the National Academy of Sciences,
107(6), 2717–2722. http://doi.org/10.1073/pnas.0907307107
Lambon Ralph, M. a. (2014). Neurocognitive insights on conceptual knowledge and its breakdown. Philosophical Transactions of the Royal Society B: Biological Sciences,
369(1634). http://doi.org/10.1098/rstb.2012.0392
30 Maddox, W. T., & Ashby, F. G. (2004). Dissociating explicit and procedural-learning based
systems of perceptual category learning. Behavioural Processes, 66(3), 309–332. http://doi.org/10.1016/j.beproc.2004.03.011
Nielsen, J. (2004). Card sorting: How many users to test. Retrieved from: https://www.nngroup.com/articles/card-sorting-how-many-users-to-test/
Olsen-Landis, C. (2017). Card sorting: a powerful, simple research method. Retrieved from: https://medium.com/design-ibm/card-sorting-a-powerful-simple-research-method-9d1566be9b62
Patterson, K., Nestor, P. J., & Rogers, T. T. (2007). Where do you know what you know? The representation of semantic knowledge in the human brain. Nature Reviews Neuroscience,
8(12), 976–987. http://doi.org/10.1038/nrn2277
Pavlenko, A. (1999). New approaches to concepts in bilingual memory. Bilingualism: Language and Cognition, 2(3), S1366728999000322. http://doi.org/10.1017/S1366728999000322 Pobric, G., Jefferies, E., & Lambon Ralph, M. A. (2010). Specific versus Category-General Semantic Impairment Induced by Transcranial Magnetic Stimulation. Current Biology, 20(10), 964–968. http://doi.org/10.1016/j.cub.2010.03.070
Rogers, T. T., Lambon Ralph, M. A., Garrard, P., Bozeat, S., McClelland, J. L., Hodges, J. R., & Patterson, K. (2004). Structure and Deterioration of Semantic Memory: A
Neuropsychological and Computational Investigation. Psychological Review, 111(1), 205– 235. http://doi.org/10.1037/0033-295X.111.1.205
Schmettow, M., & Sommer, J. (2016). Linking card sorting to browsing performance – are congruent municipal websites more efficient to use? Behaviour and Information Technology, 35(6), 452–470. http://doi.org/10.1080/0144929X.2016.1157207
Schmidtke, K. (2002). Cognitive Procedural Learning in Patients With Fronto-Striatal Lesions.
Learning & Memory, 9(6), 419–429. http://doi.org/10.1101/lm.47202
Velde, F. Van Der, Wolf, R. A., Schmettow, M., & Nazareth, D. S. (2015). A Semantic Map for Evaluating Creativity. Proceedings of the Sixth International Conference on Computational Creativity, (June), 94–100.
Velde, F. Van Der. (2018). Vector analysis in R of concept clusters based on Card Sorting
Wood, J. R., & Wood, L. E. (2008). Card Sorting: Current practices and beyond. Journal of Usability Studies, 4(1), 1–6. Retrieved from:
31
Appendix A: Chosen stimulus items per category
Category Items Voxelnr./locatie
Social
arrested
[17,74,24]
right posterior parietal cortex, aunt sister husband wife daughter [22,35,40]
right posterior frontal cortex begged grandmother cousin brother Time weekend [14,88,65]
left posterior parietal cortex year month tuesday trip room [17,72,24]
right posterior parietal cortex phone sitting waited minutes waking [20,75,28]
right posterior parietal cortex asleep
32
Mental sometime
hour
[12,17,35]
right ventral anterior frontal cortex lecture locked upstairs routine Person mother [15,81,29]
right posterior parietal cortex landlord sheriff maid owner convicted [25,50,63]
left anterior parietal cortex stolen Charges (violence) woman Violence innocent [24,25,54]
left medial frontal cortex offence judge poor cruelty disgrace sentence [8,57,76]
left medial temporal cortex sin liar guilty murder Filler items Weight (number) voxel [23,34,35] right parietal cortex suit (visual)
Jeans (visual) Inch (number)
Thin (tactile)
voxel [19,66,78] left parietal cortex Thick (tactile)
Soft (tactile)
Airport (place) voxel [15,89,61]
left posterior parietal cortex parking (place)
drive (place)
33 voxel [20,23,34]
right frontal cortex Destination (outdoor)
atmosphere (outdoor) exploring (outdoor) meditating (outdoor)
Male (bodypart) voxel [18,82,69]
left posterior parietal cortex voxel [13,78,66]
left tempo-parietal cortex female (bodypart)
Purse (bodypart) Bracelet (bodypart)
Appendix B: Informed consent form
Informed Consent Form – Conceptual Learning
‘I hereby declare that I have been informed in a manner which is clear to me about the nature and method of the research. My questions have been answered to my satisfaction.
I agree of my own free will to participate in this research. I reserve the right to withdraw this consent without the need to give any reason and I am aware that I may withdraw from the experiment at any time. If my research results are to be used in scientific publications or made public in any other manner, then they will be made completely anonymous. My personal data will not be disclosed to third parties without my express permission. If I request further information about the research, now or in the future, I may contact Jasmin Bigga ([email protected])
Signed in duplicate:
……… ………
34 I have provided explanatory notes about the research. I declare myself willing to answer to the best of my ability any questions which may still arise about the research.’
……… ………
Name researcher Signature
Appendix C: Questionnaire
Conceptual Learning
Q2 ‘I hereby declare that I have been informed in a manner which is clear to me about the nature and method of the research. My questions have been answered to my satisfaction. I agree of my own free will to participate in this research. I reserve the right to withdraw this consent without the need to give any reason and I am aware that I may withdraw from the experiment at any time. If my research results are to be used in scientific publications or made public in any other manner, then they will be made completely anonymous. My personal data will not be disclosed to third parties without my express permission.
If I request further information about the research, now or in the future, I may contact Jasmin Bigga ([email protected]).
o
I understand this and wish to proceed (1)35 "arrested" and "social"
o
not at all related (1)o
weakly related (2)o
moderately related (3)o
strongly related (4)o
very strongly related (5)36 Q7 "thin" and "tactile"
37
o
not at all related (1)o
weakly related (2)o
moderately related (3)o
strongly related (4)o
very strongly related (5)Q9 "sentence" and "violence"
o
not at all related (1)o
weakly related (2)o
moderately related (3)o
strongly related (4)o
very strongly related (5)38 Q11 "weight" and "number"
o
not at all related (1)o
weakly related (2)o
moderately related (3)o
strongly related (4)o
very strongly related (5)39
o
not at all related (1)o
weakly related (2)o
moderately related (3)o
strongly related (4)o
very strongly related (5)Q14 "grandmother" and "social"
o
not at all related (1)o
weakly related (2)o
moderately related (3)o
strongly related (4)o
very strongly related (5)40 "sometime" and "mental"
o
not at all related (1)o
weakly related (2)o
moderately related (3)o
strongly related (4)o
very strongly related (5)41
o
not at all related (1)o
weakly related (2)o
moderately related (3)o
strongly related (4)o
very strongly related (5)42 Q19 "airport" and "place"
o
not at all related (1)o
weakly related (2)o
moderately related (3)o
strongly related (4)o
very strongly related (5)43
o
not at all related (1)o
weakly related (2)o
moderately related (3)o
strongly related (4)o
very strongly related (5)44 Q23 "weekend" and "time"
o
not at all related (1)o
weakly related (2)o
moderately related (3)o
strongly related (4)o
very strongly related (5)Q24 "sister" and "social"
o
not at all related (1)o
weakly related (2)o
moderately related (3)o
strongly related (4)o
very strongly related (5)45
o
not at all related (1)o
weakly related (2)o
moderately related (3)o
strongly related (4)o
very strongly related (5)46 Q27 "sheriff" and "person"
o
not at all related (1)o
weakly related (2)o
moderately related (3)o
strongly related (4)o
very strongly related (5)47
o
not at all related (1)o
weakly related (2)o
moderately related (3)o
strongly related (4)o
very strongly related (5)48 Q31 "brother" and "social"
o
not at all related (1)o
weakly related (2)o
moderately related (3)o
strongly related (4)o
very strongly related (5)49
o
not at all related (1)o
weakly related (2)o
moderately related (3)o
strongly related (4)o
very strongly related (5)50 Q35 Please indicate the extent to which each pair of concepts is related in your opinion ( i.e. 1 = not related at all or 5= strongly related) "parking" and "place"
o
not at all related (1)o
weakly related (2)o
moderately related (3)o
strongly related (4)o
very strongly related (5)51
o
not at all related (1)o
weakly related (2)o
moderately related (3)o
strongly related (4)o
very strongly related (5)52 Q39 "female" and "bodypart"
o
not at all related (1)o
weakly related (2)o
moderately related (3)o
strongly related (4)o
very strongly related (5)53
o
not at all related (1)o
weakly related (2)o
moderately related (3)o
strongly related (4)o
very strongly related (5)54 Q43 "aunt" and "social"
o
not at all related (1)o
weakly related (2)o
moderately related (3)o
strongly related (4)o
very strongly related (5)Q44 "month" and "time"
o
not at all related (1)o
weakly related (2)o
moderately related (3)o
strongly related (4)o
very strongly related (5)55
o
not at all related (1)o
weakly related (2)o
moderately related (3)o
strongly related (4)o
very strongly related (5)56 Q47 "woman" and "person"
o
not at all related (1)o
weakly related (2)o
moderately related (3)o
strongly related (4)o
very strongly related (5)57
o
not at all related (1)o
weakly related (2)o
moderately related (3)o
strongly related (4)o
very strongly related (5)58 Q51 "destination" and "outdoor"
o
not at all related (1)o
weakly related (2)o
moderately related (3)o
strongly related (4)o
very strongly related (5)59
o
not at all related (1)o
weakly related (2)o
moderately related (3)o
strongly related (4)o
very strongly related (5)Q54 "drive" and "place"
o
not at all related (1)o
weakly related (2)o
moderately related (3)o
strongly related (4)o
very strongly related (5)60 "bracelet" and "bodypart"
o
not at all related (1)o
weakly related (2)o
moderately related (3)o
strongly related (4)o
very strongly related (5)61
o
not at all related (1)o
weakly related (2)o
moderately related (3)o
strongly related (4)o
very strongly related (5)62 Q59 "year" and "time"
o
not at all related (1)o
weakly related (2)o
moderately related (3)o
strongly related (4)o
very strongly related (5)63
o
not at all related (1)o
weakly related (2)o
moderately related (3)o
strongly related (4)o
very strongly related (5)64 Q63 "realized" and "mental"
o
not at all related (1)o
weakly related (2)o
moderately related (3)o
strongly related (4)o
very strongly related (5)Q64 "waited" and "time"
o
not at all related (1)o
weakly related (2)o
moderately related (3)o
strongly related (4)o
very strongly related (5)65 "landlord" and "person"
o
not at all related (1)o
weakly related (2)o
moderately related (3)o
strongly related (4)o
very strongly related (5)66 Q67 "cousin" and "social"
o
not at all related (1)o
weakly related (2)o
moderately related (3)o
strongly related (4)o
very strongly related (5)67
o
not at all related (1)o
weakly related (2)o
moderately related (3)o
strongly related (4)o
very strongly related (5)68 Q71 "lecture" and "mental"
o
not at all related (1)o
weakly related (2)o
moderately related (3)o
strongly related (4)o
very strongly related (5)69
o
not at all related (1)o
weakly related (2)o
moderately related (3)o
strongly related (4)o
very strongly related (5)Q74 "daughter" and "social"
o
not at all related (1)o
weakly related (2)o
moderately related (3)o
strongly related (4)o
very strongly related (5)70 How would you rate your proficiency in English?
o
Extremely good (1)o
Moderately good (2)o
Slightly good (3)o
Neither good nor bad (4)o
Slightly bad (5)o
Moderately bad (6)o
Extremely bad (7)Q76 What is your age?
0 10 20 30 40 50 60 70 80 90 100
years ()
71
o
Dutch (1)o
German (2)o
Other (3)Q79 Thank you for taking the time to participate in this study about conceptual learning! If you are interested in the results of the study or if you have questions, please do not hesitate to contact me via the following mail: [email protected] or by filling in the following form.
Have a nice day!
Q80 Questions/Notes?
________________________________________________________________
________________________________________________________________
________________________________________________________________
________________________________________________________________
________________________________________________________________
Appendix D: R script for the Analysis of the Card sorting data
# Call these libraries. They need to be installed as packages library(gplots) library(RColorBrewer)
72
data <- read.csv("")
# Transform data in numerical format mat_data <- data.matrix(data[,1:ncol(data)])
# Define colors of heatmap: red for high numbers
my_palette <- colorRampPalette(c("yellow","red"))(n = 299)
# Call heatmap function (from gplots), with these arguments: