University of Warwick institutional repository: http://go.warwick.ac.uk/wrap
A Thesis Submitted for the Degree of PhD at the University of Warwick
http://go.warwick.ac.uk/wrap/1054
This thesis is made available online and is protected by original copyright. Please scroll down to view the document itself.
Supply Function Equilibrium
Analysis for Electricity Markets
Prepared by
Andreas G. Petoussis
A Thesis submitted for partial fulfilment of the
requirements for the degree of Doctor of Philosophy
University of Warwick, School of Engineering
Abstract
The research presented in this Thesis investigates the strategic behaviour of generating firms in bid-based electricity pool markets and the effects of control methods and network features on the electricity market outcome by utilising the AC network model to represent the electric grid. A market equilibrium algorithm has been implemented to represent the bi-level market problem for social welfare maximization from the system operator and utility assets optimisation from the strategic market participants, based on the primal-dual interior point method. The strategic interactions in the market are modelled using supply function equilibrium theory and the optimum strategies are determined by parameterization of the marginal cost functions of the generating units. The AC power network model explicitly represents the active and reactive power flows and various network components and control functions. The market analysis examines the relation between market power and AC networks, while the different parameterization methods for the supply function bids are also investigated.
The first part of the market analysis focuses on the effects of particular characteristics of the AC network on the interactions between the strategic generating firms, which directly affect the electricity market outcome. In particular, the examined topics include the impact of transformer tap-ratio control, reactive power control, different locations for a new entry’s generating unit in the system, and introduction of photovoltaic solar power production in the pool market by considering its dependency on the applied solar irradiance. The observations on the numerical results have shown that their impact on the market is significant and the employment of AC network representation is required for reliable market outcome predictions and for a better understanding of the strategic behaviour as it depends on the topology of the system.
Table of contents:
Page no.
Table of contents i
List of Figures vi
List of Tables vii
List of Acronyms and Abbreviations x
Acknowledgements xi
Declaration xii
Chapter 1: Introduction to the electricity markets
1.1 Introduction 1
1.2 History and evolution of electricity markets 3
1.3 Liberalisation and deregulation of the electricity markets 5
1.4 From perfect competition to oligopoly 7
1.5 Electricity market types: contracts and centralised trading 8
1.6 Pricing of electrical energy 11
1.7 Electricity from renewable energy sources 14
1.8 The issue of market power 15
1.9 Assessment and mitigation of market power 16
1.10 Structure of the Thesis 18
Chapter 2: Electricity market equilibrium
2.1 Supply - demand equilibrium 22
2.2 The concept of economic surplus 23
2.3 Nash equilibrium 25
2.4 Oligopolistic electricity market equilibrium models 27
2.4.1 Cournot competition 27
2.4.2 Bertrand competition 31
2.4.3 Supply function equilibrium 33
2.4.4 Stackelberg and multi-leader-follower games 36
2.4.5 Conjectural variations method and conjectured supply
functions 38
2.4.6 Choosing the most appropriate method for electricity
market analysis 39
2.5 General SFE models 40
2.6 The linear SFE model 44
2.7 Parameterization of linear supply functions 46
2.8 Deadweight loss in SFE oligopolistic markets 51
2.9 Electrical network representation and SFE market modelling 52
2.10 Contract markets in linear SFE models 58
2.12 Existence and multiplicity of pure equilibria in linear SFE models 60
2.13 Stochastic optimisation with linear supply function bidding 64
2.14 Numerical methods for SFE solutions 66
Chapter 3: Methodology and implementation of the electricity
market SFE algorithm
3.1 The work in this Thesis 71
3.2 The primal-dual interior point method 76
3.3 Applications of the primal-dual interior point method 81
3.4 Introduction to the implemented market equilibrium algorithm 83
3.5 Modelling of the electricity network 84
3.5.1 Representation of the transmission line branch 84
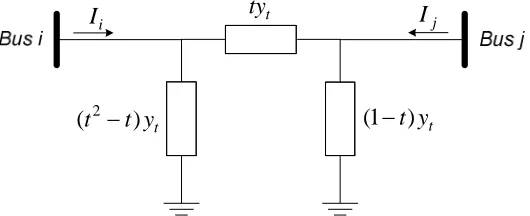
3.5.2 Representation of the transformer 86
3.5.3 Formulation of the power flow and power mismatch
equations 89
3.6 Electricity market assumptions and ISO obligations 90
3.7 The optimisation problem of the ISO 94
3.8 The optimisation problem of the generating firms 95
3.9 The solution for the SFE market problem 95
3.9.1 Reformulation of the ISO optimisation problem 96
3.9.2 Introduction of the complementarity constraint 98
3.9.3 Formulation of the combined optimisation problem for the
SFE solution 99
3.9.4 Linearization of the market problem’s KKT system 102
3.9.5 Formulation of the Newton matrix equation 105
3.10 Implementation issues for the primal-dual interior point algorithm 109
3.11 Conclusions for Chapter 3 112
Chapter 4: The impact of transformer tap-ratio control on the electricity
market equilibrium
4.1 Introduction to transformer control 114
4.2 Modelling of the transformer control in the electricity market
equilibrium analysis 115
4.3 Introduction to the analysis of the impact of transformer tap-ratio
control on the electricity market equilibrium 118
4.4 Numerical results on the 5-bus test system 119
4.5 Numerical results on the IEEE 30-bus test system 123
4.6 Discussion on the impact of transformer tap-ratio control based on
the numerical results of Cases 1 to 10 125
4.7 Investigation of the impact of transformer tap-ratio control in
congested transmission networks 126
4.8 Discussion on the impact of transformer tap-ratio control in
congested transmission networks based on the numerical results of
Cases 11 to 18 130
Chapter 5: The impact of reactive power and voltage control on the
electricity market equilibrium
5.1 Introduction to the analysis of reactive power control in the
electricity market equilibrium model 133
5.2 Investigation of the voltage control on generator buses 134
5.2.1 Voltage control: 3-bus system results 134
5.2.2 Voltage control: IEEE 14-bus system results 137
5.2.3 Voltage control: IEEE 118-bus system results 138
5.2.4 Discussion on the impact of voltage control based on the
numerical results of Cases 1 to 8 139
5.3 Investigation of the reactive power generation and absorption
limits 140
5.3.1 Reactive power generation limits: 3-bus system results 141
5.3.2 Reactive power generation and absorption limits: IEEE
14-bus system results 142
5.3.3 Reactive power generation limits: IEEE 118-bus system
results 146
5.3.4 Discussion on the impact of limitations on the reactive power generation and absorption based on the numerical
results of Cases 9 to 17 147
5.4 Investigation of the load power factor adjustments 148
5.4.1 Load power factor adjustments: 3-bus system results 148
5.4.2 Load power factor adjustments: IEEE 14-bus system results149
5.4.3 Load power factor adjustments: IEEE 118-bus system
results 151
5.4.4 Discussion on the impact of load power factor adjustments
based on the numerical results of Cases 18 to 26 153
5.5 Conclusions for Chapter 5 154
Chapter 6: Choosing the location for the generating unit of a new entry in
the electricity market
6.1 Introduction to the investigation of the locations of new entries in
the electricity market 156
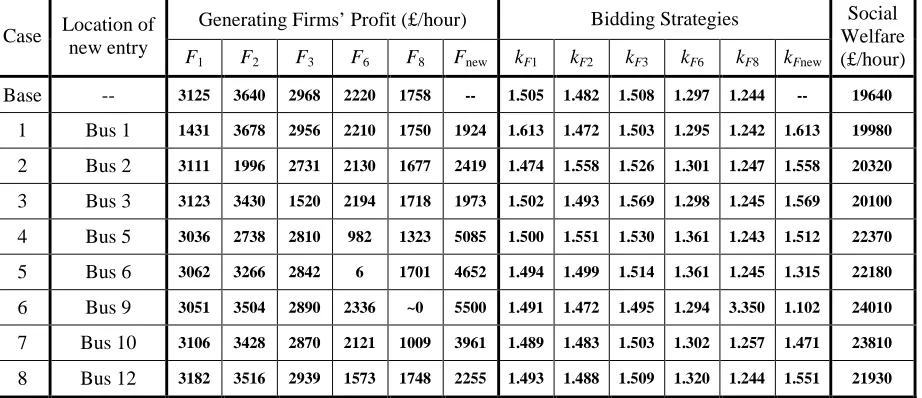
6.2 Numerical results: the choice for the best location of a new entry’s
generating unit 157
6.2.1 The interactions between the new firm and the existing
firms 160
6.2.2 The choice for the best location for the new generating unit 161 6.2.3 The effects of the new entry on the nodal prices and the
social welfare 162
Chapter 7: Modelling of grid-connected photovoltaic systems in the
electricity market equilibrium algorithm
7.1 Introduction to photovoltaic (PV) technology 165
7.2 Modelling the economic aspects of grid-connected PV systems in
the electricity market model 167
7.3 Numerical results using the PV systems economic model 168
7.4 Discussions on the PV economic model 172
7.5 Modelling the operational aspects of grid-connected PV systems in
the electricity market model, in terms of active and reactive PV
power output 173
7.5.1 Experimental PV equipment 174
7.5.2 Processing the data collected from the experimental PV
park 174
7.5.3 Modelling the PV output performance in the electricity
market algorithm 176
7.6 Numerical results using the economic-operational PV systems
model: the effect of the solar irradiance-dependent PV active and
reactive power generation on the electricity market 177
7.6.1 Numerical results on the 5-bus system 178
7.6.2 Numerical results on the IEEE 57-bus system 183
7.6.3 Discussion on the impact of solar irradiance on the electricity market equilibrium and the significance of PV
reactive power modelling 185
7.7 Conclusions for Chapter 7 186
Chapter 8: Parameterization of supply functions in AC electricity market
equilibrium models
8.1 Introduction to the comparison of the different SFE
parameterization methods 189
8.2 Description of the SFE electricity market algorithm for the
different parameterization methods 190
8.3 Introduction to the analysis of the market solution behaviour for
the different SFE parameterization methods 194
8.4 Numerical results on the 3-bus test system 194
8.5 Numerical results on the 5-bus test system 197
8.6 Discussion on the different market solutions from the four
parameterization methods based on the numerical results of Cases
1 to 8 200
8.7 Numerical results on the IEEE 30-bus system 202
8.8 Numerical results on the IEEE 57-bus system 204
Chapter 9: Convergence characteristics of the electricity market SFE
algorithm
9.1 Introduction to the computational performance characteristics of
linear SFE models 208
9.2 Analysis of the convergence characteristics of the proposed
electricity market SFE algorithm 210
9.2.1 Convergence for the IEEE 14-bus system 211
9.2.2 Convergence for the IEEE 118-bus system 212
9.2.3 Discussions on the convergence of the algorithm 214
9.3 Investigation of the computational performance of the different
parameterization methods 215
9.4 Factors that enhance the computational performance of the
algorithm 217
9.5 Conclusions for Chapter 9 219
Chapter 10: Epilogue
10.1 Concluding remarks 220
10.2 Evaluation of the presented work 221
10.3 The major contributions of this Thesis 223
10.4 Suggestions for further research 224
References 226
Appendices:
Appendix I: Contribution of the transformer formulation in the
electricity market equilibrium algorithm 235
Appendix II: Derivative terms for the elements of the transformer
List of Figures:
Page no.
Figure 1:Supply-demand equilibrium 23
Figure 2:The consumers’ and producers’ surpluses 24
Figure 3:Examples of supply function bids 34
Figure 4:Distortion of social welfare in SFE oligopolistic markets 52
Figure 5: Π-equivalent circuit for modelling the transmission line branch 85 Figure 6:The single-line diagram for the transformer 87
Figure 7:The equivalent circuit for the transformer 88
Figure 8:The ISO market process for one time interval 93
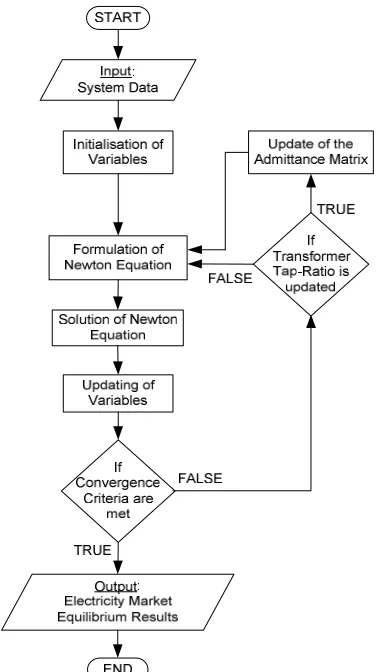
Figure 9:Flowchart of the solution procedure for the SFE algorithm 110
Figure 10:The 5-bus test system 120
Figure 11:The 3-bus test system 135
Figure 12:Nodal prices for Cases 22 to 24 150
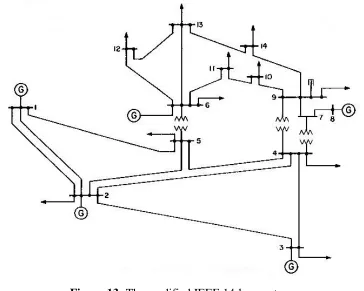
Figure 13:The modified IEEE 14-bus system 158
Figure 14:Best fit representation of the PV active power output vs.
normalised solar irradiance 176
Figure 15:Best fit representation of the PV reactive power output vs.
normalised solar irradiance 176
Figure 16:The 5-bus test system for the PV analysis 178
Figure 17:Cases 5 to 13 for PV systems: Strategic firms’ profits (no
congestion) 179
Figure 18:Cases 14 to 22 for PV systems: Strategic firms’ profits
(congestion) 181
Figure 19:The 3-bus test system for the parameterization analysis 195
Figure 20:The 5-bus test system for the parameterization analysis 197
Figure 21:Maximum absolute active/reactive power mismatches for the
convergence of the IEEE 118-bus system test cases 213
Figure 22:Complementary gap minimisation for the convergence of the
IEEE 118-bus system test cases 213
Figure 23:Maximum absolute active/reactive power mismatches for the
convergence of the different parameterization methods 216
Figure 24:Complementary gap minimisation for the convergence of the
List of Tables:
Page no. Table 4.1:Cases 1 to 8 for the 5-Bus Test System: Nodal Prices, Bidding
Parameters, Firms’ Profits and Social Welfare 120
Table 4.2:Cases 1 to 8 for the 5-Bus Test System: System Parameters 120
Table 4.3:Cases 9 to 10 for the IEEE 30-Bus System: Bidding Parameters,
Firms’ Profits, Power Distribution and Social Welfare 124
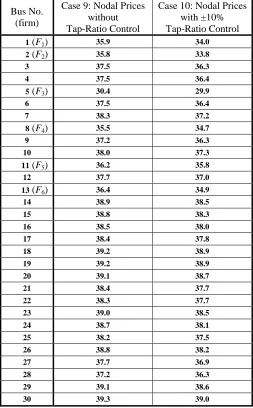
Table 4.4:Cases 9 to 10 for the IEEE 30-Bus System: Comparison of
Nodal Prices 124
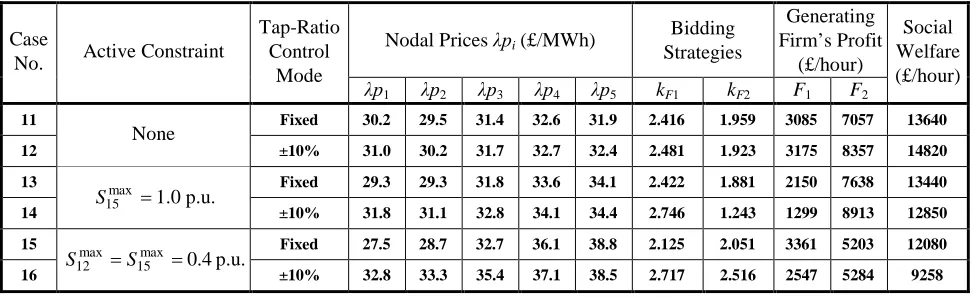
Table 4.5:Cases 11 to 16 for the 5-Bus Test System: Nodal Prices,
Bidding Parameters, Firms’ Profits and Social Welfare 126
Table 4.6:Cases 11 to 16 for the 5-Bus Test System: System Parameters 127
Table 4.7:Cases 17 to 18 for the 5-Bus Test System: Market Outcome
and System Parameters 127
Table 5.1:Cases 1 to 4 for the 3-Bus Test System: Nodal Prices, Bidding
Parameters, Firms’ Profits and Social Welfare 135
Table 5.2:Cases 1 to 4 for the 3-Bus Test System: Power Distribution in
the Network 135
Table 5.3:Cases 5 to 6 for the IEEE 14-Bus System: Bidding Parameters,
Firms’ Profits, Power Distribution and Social Welfare 137
Table 5.4:Cases 5 to 6 for the IEEE 14-Bus System: Comparison of
Nodal Prices 137
Table 5.5:Cases 7 to 8 for the IEEE 118-Bus System: Results for
Comparison 138
Table 5.6:Cases 7 to 8 for the IEEE 118-Bus System: Power Distribution
and Social Welfare 139
Table 5.7:Cases 9 to 10 for the 3-Bus Test System: Nodal Prices,
Bidding Parameters, Firms’ Profits and Social Welfare 141
Table 5.8:Cases 9 to 10 for the 3-Bus Test System: Power Distribution
in the Network 141
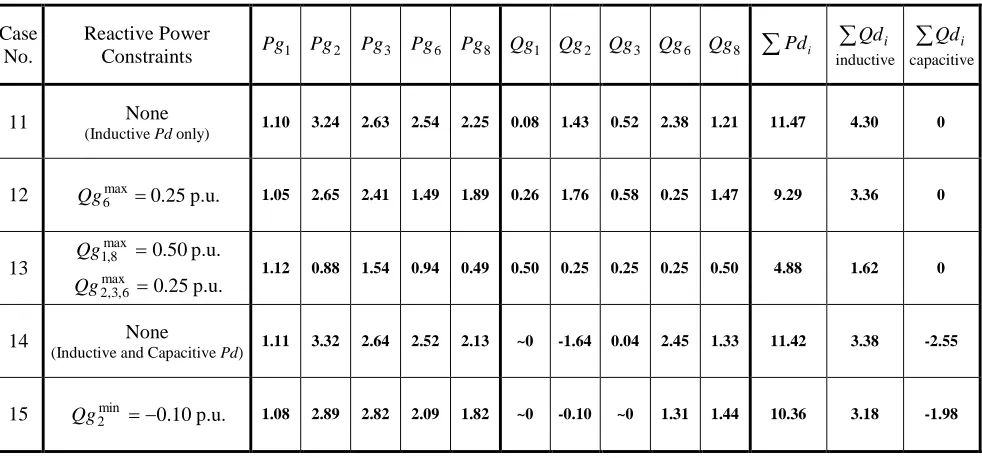
Table 5.9:Cases 11 to 15 for the IEEE 14-Bus System: Firms’ Profits,
Bidding Parameters and Social Welfare 143
Table 5.10:Cases 11 to 15 for the IEEE 14-Bus System: Power
Distribution in the Network 143
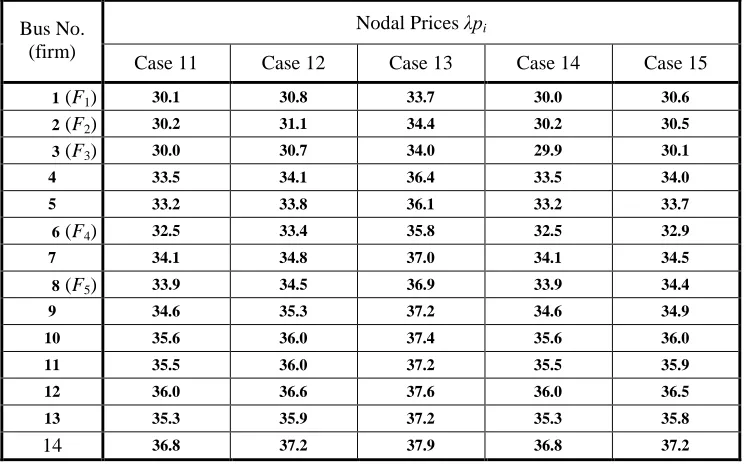
Table 5.11:Cases 11 to 15 for the IEEE 14-Bus System: Comparison of
Table 5.12:Cases 16 to 17 for the IEEE 118-Bus System: Results for
Comparison 146
Table 5.13:Cases 16 to 17 for the IEEE 118-Bus System: Power 146 Distribution and Social Welfare
Table 5.14:Cases 18 to 21 for the 3-Bus Test System: Market Outcome 148
Table 5.15:Cases 22 to 24 for the IEEE 14-Bus System: Firms’ Profits,
Bidding Parameters and Social Welfare 149
Table 5.16:Cases 22 to 24 for the IEEE 14-Bus System: Power
Distribution in the Network 150
Table 5.17:Cases 25 to 26 for the IEEE 118-Bus System: Results for
Comparison 152
Table 5.18:Cases 25 to 26 for the IEEE 118-Bus System: Power
Distribution and Social Welfare 152
Table 6.1:Numerical Results for the Power Distribution in the Network 159
Table 6.2:Numerical Results for the Firms’ Profits, Bidding Strategies
and Social Welfare 160
Table 6.3:Selected Nodal Prices 160
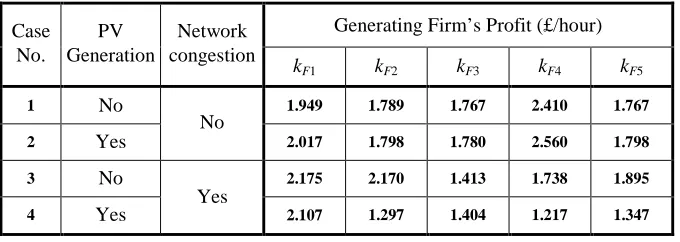
Table 7.1:Cases 1 to 4 for PV Systems: Firms’ Profits, Power Distribution
and Social Welfare 170
Table 7.2:Cases 1 to 4 for PV Systems: Firms’ Bidding Strategies 170
Table7.3:Cases 1 to 4 for PV Systems: Nodal Prices 170
Table 7.4:Cases 5 to 13 for PV Systems: Nodal Prices (No Congestion) 180
Table 7.5:Cases 5 to 13 for PV Systems: Power Distribution and
Social Welfare (No Congestion) 180
Table 7.6:Cases 14 to 22 for PV Systems: Nodal Prices (Congestion) 182
Table 7.7:Cases 14 to 22 for PV Systems: Power Distribution and
Social Welfare (Congestion) 182
Table 7.8:Market Outcome for Cases 23 to 27 for PV Systems (No
Congestion) 184
Table 7.9:Market Outcome for Cases 28 to 32 for PV Systems
(Congestion) 184
Table 8.1:Results for the 3-bus System: Market Solutions for
Cases 1 to 3 195
Table 8.2:Results for the 5-bus System: Market Solutions for Cases
4 to 6 ( |V|±5% ) 198
Table 8.3:Results for the 5-bus System: Market Solutions for Cases 7 to
8 ( |V|±3% ) 198
Table 8.4:Results for the IEEE 30-bus System: Market Solutions for
Table 8.5:Results for the IEEE 57-bus System: Market Solutions for
Cases 12 to 13 204
Table 9.1:CPU Times for the Linear SFE Models Reported in the
Literature 209
Table 9.2:Convergence Characteristics for the IEEE 14-bus System 211
Table 9.3:Convergence Characteristics for the IEEE 118-bus System 212
Table 9.4:Convergence Characteristics for the Different
List of Acronyms and Abbreviations:
CP - Complementarity Problem
CSF - Conjectured Supply Function
EPCC - Equilibrium Program with Complementarity Constraints
EPEC - Equilibrium Program with Equilibrium Constraints
EPIA - European Photovoltaic Industry Association
EU - European Union
HHI - Herfindalh-Hirschman Index
ISO - Independent System Operator
KKT - Karush-Kuhn-Tucker
LCP - Linear Complementarity Problem
MPCC - Mathematical Program with Complementarity Constraints
MPEC - Mathematical Program with Equilibrium Constraints
MWh - MW-hour
NCP - Nonlinear Complementarity Problem
NLP - Non-Linear Programming
OPF - Optimal Power Flow
PC - Perfect Competition
p.u. - per-unit
PV - Photovoltaic
RES - Renewable Energy Sources
Acknowledgements:
I would like to thank my academic supervisor Dr. Xiao-Ping Zhang and express my gratitude for his continuous support and guidance throughout my PhD studies. His valuable supervision and encouragement over my postgraduate and also undergraduate studies have given me the opportunity to expand my field of knowledge and broaden my academic horizons.
My sincere thanks to my second supervisor Prof. Keith Godfrey for his constant help and support during my time in the University of Warwick. His helpful comments and discussions on my work are much appreciated.
My deepest gratitude is expressed to my family for their continuous encouragement, emotional support and patience over the 7 years of my studies at the University of Warwick. In particular, I would like to thank my brother Savvas for always being there for me.
Declaration:
Parts of the work presented in this Thesis have been published or submitted for publication to scientific journals and conferences:
1. S. G. Petoussis, X.-P. Zhang, A. G. Petoussis and K. R. Godfrey, “The
impact of reactive power on the electricity market equilibrium,” Panel
session paper, Proc. IEEE PES Power System Conference & Exposition
(PSCE), Atlanta, Georgia, USA, pp. 96-102, Nov. 2006.
2. A. G. Petoussis, S. G. Petoussis, X.-P. Zhang and K. R. Godfrey, “Market
equilibrium in congested transmission networks with transformer tap-ratio
control,”Proc. IEEE PES Power Tech Conference, Lausanne, Switzerland,
pp. 949-954, July 2007.
3. S. G. Petoussis, A. G. Petoussis, X. P. Zhang and K. R. Godfrey, “Impact
of the transformer tap-ratio control on the electricity market equilibrium,” IEEE Trans. Power Syst., vol. 23, no. 1, pp. 65-75, Feb. 2008.
4. A. G. Petoussis, S. G. Petoussis, X. P. Zhang and K. R. Godfrey, “New
entries in the electricity market: choosing the best location for a new
generating unit,” Panel session paper, Proc. IEEE on Electric Utility
Deregulation and Restructuring and Power Technologies (DRPT) 3rd
International Conference, Nanjing, China, pp. 61-65, April 2008.
5. S. G. Petoussis, A. G. Petoussis, G. E. Georghiou, X. P. Zhang and K. R.
Godfrey, “Grid-connected photovoltaic power plants: the effect on the
electricity market equilibrium,” Proc. IEEE on Electric Utility
Deregulation and Restructuring and Power Technologies (DRPT) 3rd
International Conference, Nanjing, China, pp. 457-462, April 2008.
6. A. G. Petoussis, X. P. Zhang, S. G. Petoussis and K. R. Godfrey,
“Electricity market equilibrium of nonlinear power systems with reactive power control,” submitted toElectric Power Systems Research, Dec. 2007.
7. A. G. Petoussis, S. G. Petoussis, X. P. Zhang, G. E. Georghiou, M.
Patsalides, G. Makrides and K. R. Godfrey, “Electricity market modelling with photovoltaic active and reactive power generation,” accepted for
presentation at the IFAC Symposium on Power Plants and Power Systems
Control (PP&PSC), Tampere, Finland, July 2009.
8. A. G. Petoussis, X. P. Zhang, S. G. Petoussis and K. R. Godfrey,
Chapter 1:
Introduction to the electricity markets
1.1
Introduction
In recent years electricity market reform has taken place all over the World, with the objective of replacing the existing monopolistic structure by a more competitive one giving the opportunity to new participants to enter the electric power trading sector. However, the electricity market has been proven to have a tendency to oligopolistic behaviour due to a number of factors, such as the entry barriers caused by the unique nature and operational complexities of the electrical power systems, the potential market power of the participating generating firms related to locational and other characteristics of the electrical grid, and the distinctive requirements for the transmission and distribution of
electrical power. The resultant deregulated market structure and the
establishment of independent generating firms in a liberalised environment have brought forward the development of economic tools for the investigation and analysis of the function of electricity markets. Among the variety of the different methods proposed, the concept of market equilibrium analysis has received considerable attention, since it is an appropriate tool for exploring the oligopolistic strategic behaviour that characterises the restructured electricity sector being able to provide meaningful predictions for the market outcome.
The research on the subject has contributed to the literature in several ways by
the proposition of employing different economic approaches for the
advantages over the choice of the other relevant methods. In addition to the diversity of the applicable economic principles, various numerical methods have been suggested for the implementation of appropriate algorithms for computing the electricity market solution. The evolution in the area of mathematical programming has provided the ability of improving the computational performance and precision of the proposed numerical methods, enabling more advanced and comprehensive investigations.
The work presented in this Thesis proposes an electricity market equilibrium model based on supply function theory applied to bid-based pool markets, for the investigation of market power and the interactions between the strategic generating firms. The analysis explores topics that have not be addressed well in the literature, including investigations of the impact of control methods and network constraints on the market equilibrium related to the nonlinearities of AC systems, the effects of new generating units of conventional nature and grid-connected photovoltaic sources, and the different methods in which a profit-maximising supply function strategy can be constructed by parameterizing the marginal cost of generation. The numerical algorithm for the market solution is implemented based on primal-dual interior point optimisation, which has been proven to be very efficient.
and concluding remarks are provided in Chapter 10. Further details on the structure of the Thesis are given in the last section of this chapter.
1.2
History and evolution of electricity markets
The electricity industry has existed for more than 130 years, in which time major changes in structure and regulations have occurred. Alterations due to continuous technical and economic developments have been experienced, resulting in an overall transformation of the electricity sector.
In the very beginning, the infancy of the electricity industry was dictated by
privately owned companies, experiencing brutal competition and high
inefficiencies. The transmission grid development was very limited and almost no regulation existed. Initially in the USA, Thomas Edison has offered a replacement to gas lighting using DC technology, around 1878, charging by the number of light bulbs installed on the site. In the following years, suppliers that were also providing the electricity infrastructure were taking advantage of areas of dense load, such as cities and industrial sites. For example, between 1887 and 1893 there were 24 power companies within the city of Chicago, with overlapping lines and enormous costs, subject to fierce competition [1].
In the following years, the states in many countries tried to guide the electricity industry, regarding electrical power as an everyday necessity, instead of a luxury commodity. Further developments on the transmission grid had been observed, but there was a lack of interconnection between individual networks and also inadequate network control. This resulted in uncertain supply and large losses during the transmission of electrical power [2]. After World War II, it has been addressed that in many countries, mainly in Europe and Latin America, the electricity industry was integrated into a single nationalised company, for strategic reasons. Such state ownerships led to new problems, since some governments were unable to invest in generation to cover the high-pace demand growth [3]. Meanwhile, economic concepts were employed in the electricity sector in order to deal with the negative economic behaviour. The increasing economics of scale prevailed and the transmission and distribution grids were nearing completion. Eventually, almost all governments in Europe considered the electricity sector as a natural monopoly and small producers were merged into single nation-wide monopolies, placed under public ownership to prevent oligopolistic behaviour; France initiated this in 1946, while Italy, in 1962, was the last one. In many countries new entries into the electricity sector were forbidden by law, with the exception of Spain that had no entry barrier laws and some local competition also existed [2]. During the following years, it was well accepted that the electricity industry is principally of a monopolistic nature [4].
electricity from “qualified facilities”, such as cogenerators and small power producers [6]. However, improvements in transmission, which were done mainly for reliability purposes, were responsible for removing the natural monopoly character of the wholesale market, rather than changes in generation technology. Development in high voltage networks over long distances made possible the trading of electricity from producers located away from the consumers [1].
The pioneer in introducing some competition in the electricity market was Chile in 1982, by allowing large consumers to choose their suppliers and negotiate the prices. This was followed by the establishment of market mechanisms for the determination of generators’ dispatch and the wholesale price of electricity, permitting competition between generators. In 1990, the England and Wales market established the pool market mechanism for the first time in the history of the electricity power sector, by privatising the electricity supply industry [7,8]. The following year Norway also adopted a competitive electricity pool scheme creating the Nord Pool, which was afterwards extended to include Sweden in 1996, Finland in 1998 and Denmark in 1999 [9]. The Nord Pool is the only multinational exchange for trading electric power, while it is the first that permitted all end-users to choose their supplier. By that time the European Union (EU) directive on the internal electricity market [10] has allowed large purchasers of electricity to choose their suppliers freely from throughout the EU, introducing full competition amongst generating firms. During the 1990s several other countries, including Argentina, Colombia, Canada and Australia, created regulated pool markets for electrical power, while competition in various forms was introduced in most countries [6]. These actions initiated the era of deregulation and liberalisation of the electricity market.
1.3
Liberalisation and deregulation of the electricity markets
of the industry operations and the introduction of competition. However, besides the unbundling of most branches of the electricity sector in the restructured power systems, the transmission ownership is still considered, in general, as a monopoly element not subject to competition [11].
The electricity markets around the World, following the liberalisation trend during the 1990s, were undergoing major reforms, as the governments were privatising and restructuring the initially monopolistic state-owned, or private state-regulated, electricity utilities. The competitive part of the former utility companies, mainly the electricity generation sector, was separated from the natural monopolies, such as the ownership of the grid for transmission and partly the distribution of electrical power [6]. While many countries associated the liberalisation of the electricity market with direct privatisation of the existing utilities, some of the leading European energy companies, such as EDF in France [12] and Vattenfall (translated as Waterfall) in Sweden [13], remained partially or completely in government ownership. Market forces were gaining control over the electricity business environment as government regulations were withdrawn during the liberalisation process, shifting the decision making from the state to the market and giving choice to the consumers. The main reasons that led to extensive deregulation of the electricity sector were that new technologies reduced the optimal size of generators, mainly due to the development of combined cycle gas turbines, and that the competitive global economy required lower input costs. The existing state-owned utilities were unable to respond to these economic and technological changes as quickly as private owners, while advances in communications made possible the exchange of large information needed for the management of electricity markets [2,3].
system. Certain rules must be established by the operator regarding the energy and ancillary services markets, the management of the transmission system, the market risks and the monitoring of the system for the elimination of any sources of market power. Among others, the ISO responsibilities include monitoring of ancillary services auctions if in effect, for example spinning reserve, and congestion management [14].
1.4
From perfect competition to oligopoly
The main objective of deregulation was to achieve efficiency through competition. Competition provides strong minimising incentives for the suppliers in terms of labour savings, efficient maintenance, reduced construction costs for new plants, wiser investment choices and flexibility in new projects, such as distributed generation and renewable energy sources. It also encourages real-time pricing, which is considered to be more accurate [1]. In a monopolistic environment where the electrical power generation, transmission and distribution are bundled, the monopolist can set prices above the cost of production, while competition in a deregulated environment can bring the market price down to marginal cost of generation levels [3]. Although many attempts have been made all over the World to increase the degree of competition in the electricity markets, especially at the wholesale level, perfect competition conditions have not been established [15].
The requirements for successful perfect competition in the short-run in a deregulated environment are that the market participants act as price takers, the traders have adequate information including the electricity market price to be publicly known, and the costs are well-behaved. Long-run perfect competition conditions include the above, while the production costs should not allow natural monopoly conditions to emerge, and the competitors must be able to freely enter the market with no entry barriers [1].
The lack of each of the aforementioned requirements for the existence of perfect competition will result in oligopolistic conditions, such as the ability of particular participants for exercising market power leading to high prices, or in other forms of economic deficiencies. An oligopolistic market is characterised by a small number of producers of significant size where the action of one has an influence on the overall market, and the prices and payoffs are influenced by the behaviour of the producers. The main reasons for the electricity market to be an oligopoly rather than a perfect competition market are the limited number of producers, the transmission constraints and congestion that isolates consumers from some generators, the transmission losses that discourage consumers from distant producers, and the entry barriers for new competitors, such as the large investment size [17]. Considering these circumstances, which result from the unique nature of the power generation, transmission and distribution, perfect competition is very difficult to be established in the deregulated electricity markets, and therefore the traditional assumptions of a perfect competitive market in the economic sense should be replaced with those of the more realistic oligopolistic approach, as far as the electricity sector is concerned [15].
1.5
Electricity market types: contracts and centralised trading
transmission services from the transmission owner or system operator. If retail competition is allowed, the generating firms can also directly contract with the consumers [3]. All the transactions are announced to the operator to verify if the transmission capacity is sufficient to complete the transaction and maintain the transmission security, but it determines the feasibility of the contract without knowing the prices agreed. This trading approach has the advantage of being extremely flexible, while its disadvantages stem from the high cost of negotiating for the contracts and the risk of creditworthiness of counterparties [14]. Nonetheless, the implementation of bilateral contracts minimises the role of the system operator [1].
Certain contracts require immediate delivery, while the terms and conditions of others may be fixed in advance. A forward contract states the agreed price and defines the location for the delivery of an asset at a specified time in the future, without any payment until the time of delivery. Any differences between the current market price and the contract price at the time of delivery, represents a profit or loss for the contractors [18]. A secondary market may exist, in which producers and consumers buy and sell forward contracts, called future contracts, in order to manage their exposure to fluctuations in the spot price. Other parties apart from generating firms, retailers and consumers may participate, such as speculators who want to buy a future contract hoping of being able to sell it later at a higher price [16].
seller bids too high it may not be able to sell, and if a buyer bids too low it may not be able to purchase [14]. The ISO implements the economic dispatch, usually based on a social welfare maximisation or a costs minimisation scheme, and sets the market clearing price based on the submitted bids, the demand levels and the supply quantities. A standard procedure is that the ISO chooses first the generators with the lowest bids and the customers with the highest offers in order, until the load demand is met. The scheduled producers and customers are represented by the intersection of the supply and demand curves (see Section 2.1). Trading outside the pool, as in a bilateral agreement, may avoid the general management costs created by centralised coordination shared by all market participants, but as the pool market price is publicly known, significant savings result by avoiding the need to discover prices. A poolco market is more efficient than a market based on bilateral contracts because most market participants are scheduled and tracking agreements between pairs of traders is not necessary [3]. Furthermore, a pool market gives incentives to small consumers to have an active part in the electricity market, while, since the pool reduces the scheduling risk, the generating costs will be less [16].
In the case were the market participants are obliged to trade only through a centralised market and bilateral agreements are not allowed, they may choose to enter into contracts for differences in order to reduce their exposure to price risks. In a contract for differences the parties agree on a strike price and an amount of power. Once the trading through the centralised market is complete, if the strike price is higher than the centralised market price, the buyer pays the seller the difference between the two prices times the amount agreed, or if the strike price is lower than the market price, the seller pays the buyer the price difference times the specified amount [16].
the most important reason for the simultaneous existence of bilateral trades and pool market is to ensure the reliability of the system. Since the actual demand is never exactly equal to the value forecasted and unpredictable problems may prevent generators to deliver the contracted amount of power, a pool-type market mechanism is used to settle the imbalances between supply and demand at every moment. Such a market for imbalances is often called a spot market, since power is delivered immediately and the buyer pays on the spot. Even if bilateral trading represents the main market mechanism in a wholesale environment, a spot market can be implemented as a balancing mechanism, by pooling all available surplus generation, in a similar manner as in the poolco type market. A spot market for handling the supply-demand imbalances has the advantage of immediacy, but the spot prices tend to change quickly depending on the load demand, and are essentially unpredictable [16].
In addition to energy prices and quantities for selling and buying electrical power, the ISO in a pool type market may require other information associated with the generating units to be provided with the submitted bids by the competing producers. These may include start-up prices, offered capacities, ramp up and down rates or rate limits, minimum and maximum generation levels, minimum up and down times, and regulation band for automatic generation control, depending on the specifications and regulations of the particular market [19]. Note that, in some markets the operators run appropriate competitive processes or establish joint markets for energy and ancillary services, such as spinning reserve, reactive power control, frequency control and black start capability services. Depending on the service procured, bids may be required to be submitted or flat rates may be applied for each service. However, these issues are not discussed here as they are beyond the scope of this Thesis.
1.6
Pricing of electrical energy
effect, flat rates were defined annually or monthly, based mainly on expected costs. By the time that electricity deregulation was a close target the spot pricing method has emerged. The spot prices, that were recalculated every hour (or every fixed time interval), were dependent on the variation of generation fuel costs and capacities, the transmission losses and capacities, and the demand patterns. The average spot price was proven to be lower than the corresponding annual flat rate [20].
As far as the deregulated environment is concerned, the most common method to set prices in auction-type electricity markets is the uniform pricing approach. For each bidding interval, all the market participants pay or receive the same system-wide pool price that equals the bid of the last generator scheduled, and there are no transmission price differences. Therefore, a firm can receive profit even by bidding its marginal cost. Such an approach could be particularly appropriate for well connected networks with no congestion problems [3]. Since the choice of setting the uniform price at the last bid accepted is regarded as a process that does not reveal costs, another alternative, which is considered to be more efficient, is to set the uniform market price at the first bid rejected [21].
expected total revenue under uniform pricing is larger than under pay-as-bid pricing when the firms compete in prices. Then it proves that, under elastic demand, the expected demand served for the pay-as-bid scheme is more and the expected total revenue less than for uniform pricing.
Despite the fact that some markets charge for the electrical energy using a uniform price, the energy prices differ by location because it is cheaper to produce energy in some locations, and transmission is limited [1]. The pricing of electricity is affected by the transmission line capacities and losses, the energy balance constraint, and the power flows, which cannot directly be allocated among transmission lines. For more accurate pricing, the network characteristics should be reflected in the price of electricity at different locations and times. A methodology was developed in [26] for pricing network transmission losses and constraints in real time, which was the foundation for the locational spot pricing analysis.
An alternative to nodal pricing is the zonal pricing, in which nodes are grouped into zones bounded by potential constraint interfaces and each zone has a spot price. This method encourages generators to locate within high-priced zones and focuses on relieving flow constraints in the congested interfaces between zones. In such a market, the boundaries must be updated from time to time to accommodate the generation and transmission expansion [3].
1.7
Electricity from renewable energy sources
Apart from the conventional generating units that utilise fossil fuels, such as coal, heavy fuel oil and natural gas, and nuclear generators, investment in other developing technologies for generating electricity is taking place. The EU is currently in the process of promoting the exploitation of the available Renewable Energy Sources (RES) by its Member States for the production of electrical energy. The directive of the European Parliament and Council [28] issued in January 2008 proposes that an overall binding target of a 20% share of RES in energy consumption must be achieved by the Member States by the year 2020. One of the principal aims of this effort is to mitigate the climate change effects
by reducing greenhouse gas emissions, such as CO2. Furthermore, as the
increasing dependence on energy imports threatens the EU supply security and implies higher electricity prices, the boosting of investment in energy efficiency, renewable energy and new technologies is expected to exhibit wide-reaching benefits, since RES are largely indigenous. It is anticipated that the broad usage of RES will contribute to growth and jobs in the EU, as they constitute a key element of a sustainable energy future [28].
an overall 20% share. The primary RES that are expected to be largely exploited in the EU apart from the hydroelectric energy are the solar and wind energies. Other notable RES include geothermal, wave, tidal and biomass. Further details on RES and solar energy are provided in the introductory section of Chapter 7.
1.8
The issue of market power
Market power is the antithesis of competition [29]. Several definitions have been proposed, for example, market power is the ability of one or more market participants to maintain prices profitably above competitive levels for a significant period of time [29]. More generally it is defined as the ability of the market participants to manipulate the market in their own favour [15].
The generating firms may be able to exercise market power due to several reasons. Global market power may exist in the market due to the relative size of the competitors [15]. In a market with a small number of competitors, a producer with a large share can raise the market price by asking for a higher price, or by withholding output that could be produced profitably at the market price [1]. In addition, especially in electricity markets, entry barriers prevent new competitors to enter the market, acting as a source of market power. The entry barriers may be created by existing market participants, e.g. by predatory pricing where the product is available in very low prices that will also drive other producers out of the market [18], but typically entry barriers exist due to the high investment costs and the cost in obtaining permission to build generation [1]. In the case where the electricity market is still vertically integrated in some degree, vertical market power may be exercised from a single firm that controls domains in the generation, transmission and distribution sectors [3].
participants will give rise to market power [16]. Early investigations have shown that transmission costs isolate generators from competition with distant producers [30]. Large firms may increase their production in order to lower some prices, exploiting the network constraints to foreclose competition from others [31]. On the contrary, a firm may reduce its output to congest transmission into its area of dominance, in order to remain the sole local supplier [32]. Similarly, firms can buy physical transmission rights and choose not to use them to enhance their market power by artificially reducing the transmission capacity into their area [16]. Load pockets, such as cities that require more power than that they can import may give rise to the ability of exercising extreme market power during peak hours. In some cases, certain generators may be declared must-run, mainly for the need of reactive power instead of their active production, enhancing their market power [1]. Furthermore, as the level of transmission congestion directly relates to the load, the demand behaviour will affect market power abilities [33], while a slow response of the consumers to lower-price supply options favours market power [34].
1.9
Assessment and mitigation of market power
Any attempt of a player to exercise any form of market power interrupts the proper function of competition. In addition to higher prices, the consequences of market power by the suppliers include higher profits for all firms due to the higher market price, transfer of wealth from consumers to producers and higher economic inefficiency in the form of deadweight welfare loss [1].
potential for market power during peak-load hours, but this may affect the market efficiency. If the market prices are persistently high, certain market rules, such as price caps or bid caps in bid-based pool markets, can be established in order to limit the prices. Such measures should only be used after careful study of the current economic signals, because it may not be possible to prove that the high prices result from market power abuse [17]. Regarding this, the firms may be restraining prices in order to deter new competitors or to avoid substantial regulatory actions taking place [35].
For the elimination of local market power due to transmission congestion, expansion on the network can take place. However, this is a less popular approach due to the opposition of the market participants, based on the fact that this will affect the overall power flow operation of the system and, consequently, dramatically change the electricity market [17]. The study in [34] argues whether it will be more profitable to provide new transmission capacity by augmenting the existing system, altering the operating procedures or building new lines, or by constructing additional nearby generating capacity. For the case where transmission capacity expansion is not attractive, the incentives to develop
distributed generation by implementing smaller scale technologies are
highlighted. Furthermore, distributed generation can serve as a price hedging mechanism during peak load periods [36].
The main methods that have been developed to detect the presence of market power in the electricity market can be categorised in the following:
- market concentration analysis
- estimation of pricing behaviour
- oligopoly equilibrium analysis.
simulation analysis is a better approach, in which the market clearing price can be estimated by studying the optimal bidding strategies of the market participants and then be compared with the perfect competition price, or ex-post analysis using historical data can take place to measure the margin between the market price and the marginal cost of generation. A retrospective method that assesses the market price level is the application of the Lerner Index, which is defined as the difference between the actual market price and the marginal cost divided by the market price [17]. However, these methods have the disadvantage that marginal costs and perfect competition prices cannot be easily revealed, while retrospective analysis is only a way of ex-post assessment [15].
The most effective method for evaluating the sources and degree of market power in the electricity market is the oligopolistic equilibrium analysis, in which the equilibrium market prices are calculated. This analysis is based on the modelling of specific markets in terms of operational, physical and market constraints, and the simulation of the strategic behaviour of the generating firms [15]. The main oligopolistic competition types applied in such electricity market models are the Cournot, Bertrand and Supply Function Equilibrium (SFE) competitions, which are discussed in detail in the next chapter. The SFE competition, which is considered as the most appropriate for modelling the electricity market, is the main topic of the research presented in this Thesis.
1.10 Structure of the Thesis
The structure of the remainder of this Thesis is organised as follows:
- Chapter 2:
with discussions on the parameterization methods employed for the strategic bid, the representation of the electrical network and the numerical methods applied.
- Chapter 3:
The proposed work for this Thesis is analytically presented with justifications for the chosen methodology, identifying the major contributions to the literature. The primal-dual interior point method is outlined with a brief review on relevant applications, pointing out its advantages. The mathematical formulation for the implemented equilibrium market model is presented, accounting for the AC network representation and the iterative process of the algorithm.
- Chapter 4:
The contribution of the mathematical formulation of modelling the transformer power flows, losses and tap-ratio control in the electricity market algorithm is described. Numerical results are presented for test cases with and without transformer tap-ratio control to demonstrate its appreciable impact on the electricity market outcome for different operating conditions. The analysis extends to cases with congested transmission networks, illustrating the significance of modelling such control functions in the electricity market equilibrium algorithms.
- Chapter 5:
This chapter investigates the impact of reactive power control on the electricity market equilibrium. The examined control methods include voltage control using different regulation modes, variations of the reactive capabilities of the generating units in terms of reactive power generation and absorption, and load power factor adjustments. The analysis employs a wide range of test systems with networks from 3 to 118 buses, to show the effects on the market outcome of larger power systems.
- Chapter 6:
social welfare and nodal prices. It is shown that the new firm receives profits of substantial difference depending on the location chosen across the network, showing the importance of employing the AC meshed network constrained market model.
- Chapter 7:
The modelling of grid-connected photovoltaic (PV) systems in terms of economic and operational aspects is integrated into the electricity market algorithm, in order to represent a diverse market able to accommodate power generated from conventional sources and RES. The modelling of the PV unit output performance that explicitly represents the solar irradiance-dependent active and reactive PV power components is based on statistical analysis on experimental data recorded in a PV test facility. The importance of modelling the dependency on the solar irradiance and the nonlinear characteristics of PV reactive generation in the market model is highlighted.
- Chapter 8:
The different parameterization methods for obtaining the SFE strategic bids from the generating firms and the interrelation between the corresponding market solutions are investigated. The analysis focuses on the examination of the different market outcomes for the available parameterization methods under different levels of network congestion, showing that the parameterization impact on the market depends on the level of network stress and on the system size. Possible reasons for the convergence problems encountered in large systems for the arbitrary parameterization of linear supply function bids are established.
- Chapter 9:
- Chapter 10:
The last chapter of the Thesis provides concluding remarks on the main contributions of the presented research and evaluation of the analysis and numerical studies performed. The opportunity for integrating other network components and control functions in the electricity market model for a more precise and versatile market analysis and the possibility for further work on related research topics are discussed.
- Appendix
Chapter 2:
Electricity market equilibrium
2.1
Supply - demand equilibrium
In a competitive electricity market the total cost of generation of each unit is directly related to the supply. The operating cost can be represented by a variable quadratic expressionCthat depends on the quantityqproduced, such that:
2
2 1
q q
C (2.1)
whereαandβare the generation coefficients that reflect the characteristics of the various forms of costs involved. The corresponding utility function for the consumers, i.e. the consumers’ willingness to pay, also termed as the consumers’
benefit, depends on the load demand d for each market period. This can be
defined as the following quadratic inverse demand functionD:
2
2 1
d d
D (2.2)
whereγandδare the load demand cost coefficients.
In a centralised market the bidding process supervisor, such as an ISO, may ask the market participants to reveal the quantities they are willing to buy or sell over a range of prices for a given time period. The supply and demand curves can be used to graphically represent quantities as a function of price. In a perfect competition market for electricity, the marginal cost of generation and the linear inverse demand function can be used as the supply and demand curves. The marginal cost of generation is given by:
q q
C
MC
(2.3)
and is defined as the change in total cost for a unit change in quantity produced. The linear inverse demand function, given by:
d d
D
MD
shows the change in willingness of the consumers to pay for a unit change in the load demand. Figure 1 shows a typical supply-demand relationship. If the buyers and the sellers are both satisfied with the market outcome, the supply and demand curves intersect at the market equilibrium point (q*, p*). At this point, whereMCequalsMD, there is no shortage or excess of supply. The supply curve has a positive slope because as the price becomes higher the firms are more willing and able to produce power, and the demand curve has a negative slope since the willingness of the customers to pay is restrained at higher prices.
Figure 1:Supply-demand equilibrium.
2.2
The concept of economic surplus
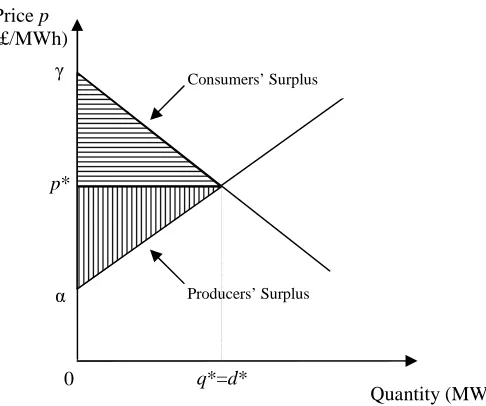
A basic tool for classical economic analysis is the theory of economic surplus. The social surplusSS, i.e. the surplus to economy, is divided between buyers and sellers as consumers’ and producers’ surplus. The producers’ surplus is the difference between the market price and the marginal cost of production summed over the output that benefits the producer, and the consumers’ surplus is the benefit that the consumers have by purchasing at a lower price than that which they were willing to pay [3]. The surpluses are graphically presented in Figure 2, for a market in perfect competition equilibrium. The horizontally shaded triangle is the consumers’ surplusCS and the vertically shaded triangle is the producers’ surplusPS. The corresponding mathematical expressions are:
Supply curve
Demand curve Market equilibrium point Pricep
(£/MWh)
p*
q* =d* 0
α γ
* *) (
2 1 *) (
*
0 MD p dd p d
CS
d (2.5)* ) * ( 2 1 ) * (
*
0 p MC dq p q
PS
q (2.6)* ) ( 2 1
*
0 *
0 MD dd MC dq q
PS CS
SS
d
q (2.7) [image:39.595.184.427.229.432.2]where p* q* d* at the perfect competition equilibrium point. The expressions for oligopolistic markets can be worked out using integration.
Figure 2:The consumers’ and producers’ surpluses.
The producers’ surplus PScorresponds to the sum of the profits of all suppliers,
which can be defined as the revenues minus the true generating costs C. For a
market that employs uniform pricing, the profit is given by:
2
2 1 *
*q C p q q q
p
(2.8).
The social surplus SS is also termed the social welfare. From (2.7), the social welfareSWis given by the consumers’ benefit, i.e. the inverse quadratic demand functionD, minus the true production costsC, such as:
]
2 1 [
] 2 1
[ d d2 q q2
C D
SW (2.9).
The social welfare is at its maximum when a competitive market is allowed to operate freely and the market price equals the perfect competition equilibrium price at the intersection of the supply and demand curves, as shown in Figure 1. If, due to a reduction in the traded amount caused by a price distortion, the
Consumers’ Surplus
Producers’ Surplus Pricep
(£/MWh)
p*
0
γ
α
market price is set to a different value, a reduction in the social welfare will occur and the remaining surplus will be redistributed among the consumers and producers depending on the occasion. A price distortion may occur due to several causes; for example it may be of the form of price caps that will benefit the consumers, or of minimum price settings that will be in favour of the producers [16]. However, neither the producers nor the consumers enjoy the lost surplus. This is called the deadweight loss and is a representation of the loss to economy of a market failure. In the case of the oligopolistic market, strategic producers able to exercise market power may attempt to transform more consumers’ surplus into profit, and this will result in a deadweight loss [3]. This is discussed further in Section 2.8.
If transmission expenses are included into the market structure, the transmission rights owner claims the cost for the transportation of the product, such as in the case of the electricity market where the market operator or a separate entity collects the transmission congestion rent. For this case, the social welfare consists of the sum of the consumers’ and producers’ surplus and the transmission congestion rent. If the consumers are paying for the transmission costs, the congestion rent CR for different locations l can be calculated by the difference between the total consumers’ payment and the total producers’ income, such that:
l l
q p d
p
CR ( * ) ( * ) (2.10).
In the electricity market modelling in this Thesis it will be assumed that the congestion rent is detained by the ISO.
2.3
Nash equilibrium
player’s strategy is an optimal response to the other players’ strategies is defined as a Nash equilibrium. Nash equilibria may be defined by pure strategies or as mixed strategies, in which the players choose from a set of strategies based on associated probabilities. In a bid-based electricity market equilibrium model, a Nash equilibrium results if none of the market participants has an incentive to unilaterally change its bid. The equilibrium point of an electricity market for a given market period can be defined as the set of prices at different nodes, profits of the generating firms, social welfare, power generation output, power distribution in the electrical network and load demand at each node.
Nash equilibria are consistent predictions of the outcome of the game in the sense that if all the market players are able to predict that a particular Nash equilibrium will occur, then no player will have an incentive to change its strategy. This will occur if all the players predict a particular Nash equilibrium point and also predict that their opponents will predict it. A prediction that any fixed non-Nash profile of strategies will occur, implies that at least one player will make a mistake in predicting its rivals’ strategies or in optimising its payoff [39].
2.4
Oligopolistic electricity market equilibrium models
Several equilibrium models have been proposed for the simulation and investigation of markets that exhibit oligopolistic behaviour, such as the emerging deregulated electricity markets, which vary in terms of competition and market assumptions. Some of the most popular models include the Cournot, Bertrand, and Supply Function competition, while other approaches, such as the Stackelberg competition and the conjectural variations method, have also been used for electricity market analysis. These models are described below.
2.4.1 Cournot competition
The Cournot competition model has been proposed by Augustin Cournot in 1838 [42]. This is an oligopolistic, non-collusive economic model, which assumes that all the firms that participate in the market act strategically and choose the quantities that they are willing to produce simultaneously, which they will then sell at the market clearing price. In Cournot’s original model the price mechanism was not specified, but the market clearing price can be thought as being determined by an auctioneer that equates the total supply and demand. Suppliers maximise profits under the assumption that all the other players will keep their output fixed and all the market participants are assumed to have the same information for their rivals’ cost functions and the load demand. An equilibrium point for this game can be determined by the condition that all the firms will choose strategies that are best responses to the anticipated actions of their opponents. This will be a Nash equilibrium of the Cournot game and none of the firms will benefit by changing its output quantity, given the output levels of the rival firms [39].
application of the Cournot model in the electricity markets is that a power generation market is a type of supply-curve competition and not a quantity-based one. Such applications may provide inconsistent or non-realistic estimates for the market outcome, or misinterpret the ability of a firm to exercise market power. Other shortcomings arise from the fact that demand elasticity in the electricity markets is unknown [1]. The Cournot competition model suggests that the strategic generating firms should be able to sustain prices above marginal cost levels with the difference determined by the price elasticity of demand. The Cournot results for the market outcome are very sensitive to this elasticity and the equilibrium prices calculated by Cournot models tend to be higher than the prices observed in practice because the electricity markets have very low elasticity [16]. For instance, the investigation on the England and Wales market in [35] reports that the actual market prices observed were higher than the marginal costs, but not nearly as high as the theoretically calculated prices. Nevertheless, applications of the Cournot model have contributed in the literature in many distinct ways and this method is still used for investigating numerous subject matters concerning the electricity markets. Some notable applications include the following.
Based on the arguments in [44], the investigations in [45,31] have applied Cournot competition in linearized DC power networks to show the interactions of geographical and electric topology of the network and identify sources of market power other than capacity withholding for raising prices. The representation of network loop flows has illustrated that firms may increase their production in order to block transmission of competitive power supply to increase their profits. The firms may foreclose competition by even producing below marginal costs [46] and this action will affect the nodal prices across the whole network.
The model proposed in [32] shows that transmission constraints affect pure Cournot equilibria, demonstrating that limited transmission capacity may give a producer incentive to restrict its output in order to congest transmission into its area. The analysis in [47] investigates the existence and uniqueness of Cournot equilibria in looped transmission constrained systems and shows that a pure strategy equilibrium may cease to exist when a transmission constraint is introduced, even if the limit is higher than the flow in the unconstrained equilibrium. In addition, the existence and uniqueness of Nash-Cournot equilibria in cooperative games are investigated in [48].
prices compared with a design for separate markets where transmission rights are allocated by auctions.
Following the models proposed in [45,49], other Cournot competition studies have also employed numerical methods to calculate equilibrium solutions for more realistic systems. The model in [54] incorporates generation and transmission constraints to calculate long-term Cournot equilibria for markets in which the generators commit their output to customers through long-term contracts. A more comprehensive numerical model was proposed in [55], where the DC power network representation is implemented. Bilateral and poolco markets are simulated and unique Cournot solutions are computed. An extension of this model that considers forward contracts and accounts for the interactions with pollution emission permits markets was provided in [56], while [57] presented a modification of the DC network Cournot model that includes nonlinear losses, phase shifters and controllable DC lines. A more advanced Cournot analysis that considers nonsmooth demand functions, price caps and joint constraints incorporated in the producers’ optimisation problem, such as bounds on the proportion of transmission capacity allocated to each producer, is provided in [58].