AUGUST 18, 2017
INTERFACE CONCEPT FOR
GEO-BASED 3D PLANNING
SOFTWARE
BACHELOR THESIS
Thérèse S.L. Bergsma
interface (GUI) for a geo-based 3D planning software named Win3D, which is developed by the company ROM3D. The software can place objects in a virtual 3D landscape to visualise situations before some-thing is built in real life. In the past, employees of the company would prepare these visualisations for clients, but clients have requested ac-cess to the software themselves, which has been granted. The soft-ware, however, was never built for new users, which lead to new users quitting or needing extensive help. The challenge of this bachelor the-sis is to redesign the GUI for both user groups, with a focus on new users, where users do not quit the program or need extensive help. The research question of this thesis is: how to build a graphical user interface concept for a geo-based 3D planning software?
A good GUI should be easy and intuitive to use. It should not cost the user much effort to accomplish their tasks and a user should never feel lost. Design principles (e.g. visibility, affordance, feedback) are exam-ined to use as guidance during the design process to achieve a good GUI. The current GUI is mapped in its entirety and a list of functions that should reappear in the new GUI is produced.
Contents
1 Introduction 6
1.1 Background. . . 6
1.2 Problem. . . 6
1.3 Research question . . . 7
1.4 Challenge . . . 7
1.5 Language . . . 7
1.6 Project . . . 8
1.7 Outline . . . 8
2 Background research 9 2.1 Definition of a good graphical user interface . . . 9
2.2 Importance of a good graphical user interface . . . 10
2.3 Design principles. . . 10
2.3.1 Visibility . . . 11
2.3.2 Affordance . . . 11
2.3.3 Feedback . . . 11
2.3.4 Constraints and consistency . . . 11
2.3.5 Other principles . . . 11
2.4 Menus. . . 12
2.4.1 Flat menu. . . 12
2.4.2 Drop-down . . . 12
2.4.3 Hierarchical or cascading. . . 12
2.4.4 Breadth and depth. . . 12
2.4.5 Simultaneous and sequential . . . 13
2.4.6 Pop-up . . . 13
2.4.7 Contextual . . . 13
2.5 Human-centered design. . . 13
2.5.1 Designing for users with different expertise . . . 13
2.5.2 Participatory design . . . 15
2.6 Aspects of interviews . . . 15
2.6.1 Structured interview . . . 15
2.6.2 Flexible or unstructured interview . . . 16
2.6.3 Semi-structured interview . . . 16
2.6.4 Atmosphere . . . 16
2.6.5 Leading questions. . . 17
2.6.6 Data gathering . . . 17
3 State of the art 18 3.1 Geographic information system (GIS) . . . 18
3.1.1 Google Maps. . . 18
3.1.2 GeoServer . . . 18
3.1.3 GRASS GIS . . . 19
3.2 Virtual globe . . . 19
3.2.1 Google Earth . . . 20
3.2.2 World Wind . . . 21
3.2.3 WorldWide Telescope . . . 21
3.3.1 2D software . . . 22
3.3.2 Windfarm. . . 22
3.3.3 VisAsim. . . 23
3.4 Games . . . 24
3.4.1 The Sims . . . 25
3.4.2 Cities: Skylines. . . 25
3.5 Conclusion . . . 26
4 Interface analysis 27 4.1 New user experience . . . 27
4.1.1 Reception . . . 28
4.1.2 Guidelines for exploration . . . 28
4.2 Mapping behaviour and layout of the interface . . . 28
4.2.1 Mapping documents . . . 29
4.3 Important workings and modules of the current interface 30 4.3.1 Main menu . . . 31
4.3.2 Tegelvenstermodule . . . 31
4.3.3 Camera navigation . . . 32
4.3.4 Loadable 3D objects . . . 32
4.3.5 Placable 3D objects . . . 32
4.3.6 Scenario module. . . 32
4.3.7 Drag and drop module . . . 33
4.3.8 Tekenentab . . . 34
4.3.9 Ecosysteemmanagermodule. . . 36
4.4 Overview of remaining modules of the current interface. 36 4.4.1 Atmosferische effectenmodule . . . 37
4.4.2 Bomenmodule. . . 37
4.4.3 Datalaagmanagermodule . . . 37
4.4.4 Geocoding module . . . 37
4.4.5 Grid module . . . 37
4.4.6 Materialenvenstermodule . . . 37
4.4.7 Navigatiepaneelmodule . . . 38
4.4.8 Plattegrond module . . . 38
4.4.9 Render module. . . 38
4.4.10 Scenario-evaluatiemodule . . . 39
4.4.11 Snelmenumodule . . . 39
4.4.12 Terreineditormodule . . . 39
4.4.13 Terreineditortwo module . . . 40
4.4.14 Windmolenconfiguratormodule . . . 40
4.4.15 Windmolenverlichtingmodule . . . 41
4.4.16 Zonnepanelenconfiguratormodule. . . 41
4.5 List with functions . . . 41
4.5.1 Categories . . . 42
4.6 Analysis on the current interface and design principles . 43 4.6.1 Visibility . . . 43
4.6.2 Affordance . . . 45
4.6.3 Feedback . . . 46
4.6.4 Constraints . . . 46
4.6.5 Consistency . . . 47
4.6.6 Recovery . . . 48
5 Interviews and concept 49 5.1 Methods . . . 49
5.2 First three interviews . . . 49
5.2.1 Purpose . . . 49
5.2.2 How and where to start . . . 50
5.2.3 How to move around . . . 51
5.2.4 Categories . . . 51
5.3 First concept . . . 52
5.3.1 Overall layout and buttons . . . 52
5.3.2 Upon starting the program . . . 53
5.3.3 Toolboxes . . . 53
5.3.4 Placing a wind turbine . . . 54
5.3.5 Key layout help. . . 55
5.4 Second three interviews. . . 55
5.4.1 Maintaining a clear screen . . . 55
5.4.2 Object example . . . 56
5.4.3 Sorting objects. . . 56
5.4.4 Adaptable quick buttons . . . 57
5.4.5 Overall reception. . . 57
5.4.6 Changes to the first concept . . . 57
6 Main concept design 58 6.1 Main concept design explanation . . . 58
6.1.1 Main menu . . . 58
6.1.2 Category selection . . . 63
6.1.3 Objectencategory and toolbox. . . 64
6.1.4 Veldencategory and toolbox . . . 67
6.1.5 Terreincategory and toolbox . . . 70
6.1.6 Eigenschappencategory and toolbox . . . 71
6.1.7 Animatiecategory and toolbox. . . 73
6.1.8 Object menu . . . 74
6.2 Implemented design principles . . . 74
6.2.1 Visibility . . . 75
6.2.2 Affordance . . . 75
6.2.3 Feedback . . . 75
6.2.4 Constraints . . . 75
6.2.5 Consistency . . . 76
7 Implementation 78 7.1 Invision . . . 78
7.2 Choosing what to test . . . 78
7.3 Preparing images . . . 79
7.4 Linking everything together . . . 79
7.4.1 Templates . . . 80
7.5 End result . . . 81
7.5.1 The main menu . . . 81
7.5.2 Inside theobjectencategory . . . 81
7.5.3 Inside theveldencategory . . . 81
7.5.4 Inside theeigenschappencategory . . . 82
7.5.5 Access to the prototype. . . 82
8 Testing 83 8.1 Error testing . . . 83
8.2 Testing procedure . . . 84
8.3 First test - new users . . . 85
8.3.1 Main menu . . . 85
8.3.2 Objectencategory . . . 86
8.3.3 Veldencategory . . . 87
8.3.4 Eigenschappencategory . . . 88
8.3.5 Remarks and overall reception . . . 88
8.4 Test - experienced users . . . 89
8.4.1 Suggestions and remarks. . . 89
8.4.2 Overall impression. . . 90
8.5 Adjusting the prototype . . . 90
8.6 Second test - new user . . . 90
8.6.2 Three categories. . . 91
8.6.3 Overall reception. . . 91
8.7 Changes . . . 91
8.7.1 Saving . . . 91
8.7.2 Additions to the help window. . . 92
8.7.3 Two additionaleigenschappentoolbox buttons . 92 8.7.4 Other . . . 92
9 Conclusion 94 9.1 Evaluation . . . 94
9.1.1 Testing . . . 94
9.1.2 Employees . . . 94
9.2 Conclusion . . . 95
9.3 Recommendation for future work . . . 95
9.4 Acknowledgement . . . 96
10 Bibliography 97
A Word list 99
B Mapping documents 101
C Text document 113
D List with functions 126
E Concept sketches 130
F Concept description 147
Chapter 1
Introduction
The focus of this bachelor thesis is on the redesign of a graphical user interface (GUI) for a geo-based 3D planning software named Win3D. Win3D is software created by the Dutch company ROM3D. The soft-ware was built in 2011 and started out as a tool to visualise wind tur-bines in a 3D virtual landscape.
1.1
Background
Future clients saw possibilities in Win3D and started to approach ROM-3D for ROM-3D visualisations. However, some clients requested other uses for Win3D that were not included in the software. ROM3D accepted these requests and added new modules (e.g. solar energy, water, agri-cultural) to the initial software. What started as a small program evolved into a complex program with different modules and a variety of func-tions.
Until recently it was ROM3D who made the visualisations in Win3D. These visualisations would then be presented in information meetings for clients and possible other interested parties. Clients could also request a workshop, where they could create together with ROM3D a virtual landscape.
Recently the province of Overijssel requested full access to the soft-ware, instead of ROM3D doing the visualisations for them, since the province wants to stimulate the transition toward sustainable energy. The province plans to involve many people and the province believes that this can be best achieved by giving these people access to the ac-tual planning software. ROM3D accepted the request of the province of Overijssel, also because ROM3D recognises similar interests from other parties, and the project started in January 2017. Employees of different municipalities and companies can now access and use the software.
1.2
Problem
GUI grew larger and more complicated with each module adding new buttons, menus and icons. However, the employees of ROM3D evolved with the program. Because they have known the program from the start, and have had the ability to adjust to the changes in incremental steps, they still understand the program and find it logical to use. A new user, on the other hand, misses this learning process and insights of previous versions, making the software illogical and not intuitive to them.
An example is the closing of a pop-up window on the screen. There was no symbol ‘X’ in a top corner of the window to close it, nor would clicking outside the window work. The window would only close by pressing the escape button on the keyboard. The employees of ROM3D knew that they must press the escape key to close pop-up windows, but this is not knowledge that is available to a new user. A new user would expect a symbol ‘X’ or something with a red colour to give an indication on how to close the pop-up window. Without a hint, a new user would have to guess what to do, making the software more dif-ficult to use. ROM3D resolved this issue by placing the symbol ‘X’ in the upper right-corner of a pop-up window which users could click to close the window. However, many similar examples, both small and large, remain that should be resolved.
Because such issues exist and because the software was never built to be intuitive and usable for other users than ROM3D employees, it is more efficient to redesign a new GUI for new users than to build further on the current GUI. This bachelor thesis will therefore focus on restructuring and redesigning the entire Win3D planning method, which will result in a concept design for a new GUI.
1.3
Research question
The main research question of this bachelor thesis is stated as follows. How to build a graphical user interface concept for a geo-based 3D planning software?
By researching and answering this question, guidelines will be provided for building a GUI for current or future geo-based planning software.
1.4
Challenge
There are multiple challenges to redesigning a GUI for a geo-based 3D planning software. ROM3D does not have an overview of functions of the software. Therefore, a method must be found to map and order all the current functions. Another method must be discerned for building up the structure of the new interface and for visualising the concept. An evaluation method is also needed to validate the concept.
1.5
Language
names, text on buttons) will be used in this thesis and a translation to English will be given the first time a new Dutch term is encounted. A full list of Dutch words and their English meaning can also be found in appendixA.
1.6 Project
The new GUI should in the end facilitate various users (e.g. employ-ees of the Ministry of Economic Affairs (The Netherlands), the Min-istry of Infrastructure and the Environment (The Netherlands), Kada-ster, municipalities, developers of wind and solar projects). However, this bachelor thesis will focus, due to its scope, on the current users of Win3D; public servants of different municipalities. The expectation is that this user group will have different expertise regarding knowledge on topics (e.g. wind, water, agricultural) and different expertise in com-puter skills. The input received from interviews from this group will give insights in how the current GUI is perceived and what the expectations are for a new GUI. Their input combined with a literature study on GUI design will lead to a first concept. This concept is discussed with other interviewees consisting of public servants from municipalites, leading to a main concept design. This concept will need further validation, and is therefore recreated into a prototype. This prototype is tested with new and experienced users.
1.7
Outline
Chapter 2
Background research
Before designing a GUI it is important to know what qualities make a GUI good and why it is important for a GUI to be good. This chap-ter explores these principles by comparing papers on the definition and importance of GUI design. This chapter also discusses the im-portance of design principles and the differences between menu types and between interview methods. Further attention is given to human-centered design, with a focus on designing for different types of users and participatory design.
2.1
Definition of a good graphical user interface
There are different factors that determine if a GUI is a good GUI. Re-searchers do not seem to contradict each other in what those factors are, however, they often do appoint a different factor as the most im-portant factor for a GUI. Stoneet al.[1] claims that a good GUI has three core abilities: (i) the interface is easy to use and understand, making the user almost forget that they are using a computer, (ii) the interface supports the user to carry out their tasks and (iii) the interface will meet the needs of the intended user. The determining factor to reach these abilities is the usability of the interface. Usability is defined by Stone et al.as:
The extent to which a product can be used by specified users to achieve specified goals with effectiveness, effi-ciency and satisfaction in a specified context of use.
Effectiveness is determined by how much the interface allows users to complete their tasks accurately. Efficiency is defined as how much effort it costs users to complete their tasks. Satisfaction entails how easily users accept the interface and if they are comfortable with using it.
Although menus are an existential part of an interface, they are often also accompanied by several icons and toolbars. These menus, icons and toolbars increase in complexity when a program becomes more elaborate. This increase might cause the interface to become complex and hard to organise, as parts become useless to the user or invisible. This is called by some researchers ‘creeping featurism’ or ‘bloated soft-ware’ [4]. Al-Omar and Rigas [5], and Park and Han [6] agree that a good GUI avoids this cluttering of options at all costs.
Although researchers often appoint a different factor as the most defin-ing factor for leaddefin-ing to a good GUI design, they all agree to what a good GUI should entail. A good GUI should be easy and intuitive to use. It should not cost the user much effort to accomplish their tasks and a user should never feel lost.
2.2
Importance of a good graphical user interface
Although the definition of a good GUI is now better understood, the question remains open as to why it is important for a GUI to be good. George Saadé and Alexandre Otrakji [7] state that the interface is the determinative factor for a user to decide if it will adopt the application, and therefore the GUI must be good, where they define a good interface as resulting in no cognitive overload and a well oriented user. Conse-quences for a user that experiences disorientation are frustration, less efficiency and a loss of interest. Similar computer-related distress in the workplace may lead to an increase in mistakes, irrational beliefs or decreases in performance. Stoneet al.name similar results for a bad GUI, but also list the benefits a good GUI can bring to the work-place, like higher staff productivity, lower staff turnover and higher job satisfaction. A good GUI would also require less training, leading to a financial benefit for businesses.
An increasingly large portion of computer users has no specialist knowl-edge of computers, which increases the importance of having a good GUI [1], [7]. A well-designed interface supports the tasks people want to do, by being easy to use and understand, enabling users to reach their goals without becoming frustrated. A good GUI will therefore make a program more attractive to a larger group of users.
There are no conflicting opinions about the importance of a good GUI, instead researchers only strengthen each other’s opinions. A good GUI will decide adaptation of the application, be beneficial in the workplace and allows a larger population of end-users to use the application.
2.3
Design principles
Design principles are used by designers to guide them during the de-sign process and to aid their thinking [8]. Design principles can also be used to evaluate and critique the design ideas of prototypes [9]. The principles are abstract and broad and are more generalizable abstrac-tions then specific rules. They are based on the experience of other designers.
2.3.1 Visibility
Examples of highly visible controlling devices are knobs, buttons and switches. An example of an invisible controlling device is the activation zone people must pass by to let a faucet run with water. When such an activation zone is out of sight and first encountered, then it is more difficult for people to find out how to use the device [8]. It is therefore encouraged to make design visible, because it increases the chance that users can achieve their goal [1].
2.3.2
Affordance
Affordance is designing something so it affords the right response. ‘Affording’ can be interpreted here as ‘to give a clue’ [10]. By giving the right clue as a designer you can inform a user on what to do without using a picture or instructions [1]. Norman [11] distinguishes to kinds of affordance: (i) perceived affordance and (ii) real affordance. Real affordance applies to physical objects, like the affordance of a chair to sit on it or the affordance of a lever to pull it. According to Norman screen GUIs do not have real affordance because a GUI is not a physical object. GUIs must be conceptualised as having perceived affordance, which are basically learned conventions.
2.3.3 Feedback
Feedback is the information that is send back to the user in response on an action performed by the user [8]. Keeping the feedback consis-tent will give the user a feeling of control [9]. An example of feedback is going back a page after pushing the arrow pointing to the left in a browser.
2.3.4 Constraints and consistency
Benyonet al.and Sharpet al.agree on adding two more to this list: (i) constraints and (ii) consistency. Constraints are used to restrict users in their behaviour. The main advantage of constraints is that they pre-vent users from making errors. It also becomes more visible for the user what their possible choices are. A well-known example of con-straints in a GUI are the options in a menu that are shaded grey if they cannot be used. Consistency in design should lead to similar opera-tions to do similar tasks. A GUI will become more easy to learn and use when it is consistent [8]. However, being consistent becomes in-creasingly difficult with the increase of complexity of a GUI.
2.3.5 Other principles
Figure 2.1:An active drop-down menu.
Figure 2.2:Example of a hierarchical or cascading menu.
Figure 2.3:A deep and narrow struc-ture.
Figure 2.4:A shallow and broad struc-ture.
both stylish and attractive to users. (vii) Conviviality; make a GUI polite and avoid aggressive messages.
2.4 Menus
Menus are used in a GUI to organise and store the available commands [9]. A user can perform an action by selecting a command from a menu list. Menus are often used as the main navigation method for a GUI, although they are in most cases accompanied by tool bars and com-mand buttons. Menus should be kept simple to improve ease of use. However, it might become difficult to do so if a GUI has many and com-plex commands. Choosing a fitting menu type can help to keep menus simple.
2.4.1
Flat menu
A flat menu is the most basic option for a menu style. It displays all the options a menu has on to the screen. Flat menus are often discarded by designers due to the space they take up in a GUI.
2.4.2 Drop-down
A drop-down menu, see figure2.1, is one item when it is inactive. If this item is pressed and becomes active, more items will appear. This type of menu is the most common [1]. A drop-down menu may lead to a roll-up menu. These menus can be rolled up, leaving only the top function visible.
2.4.3 Hierarchical or cascading
Hierarchical or cascading menus, see figure2.2are menus that start with a primary menu, which is often also a drop-down menu. By hover-ing over a primary menu item in the primary menu a secondary menu is displayed with menu items belonging to the hovered over item. Hover-ing over a secondary menu item may then lead to a tertiary menu, and so on. A downside to this type of menu is the precise mouse control that is needed by a user due to the hovering action required [1], [8]. Still, this downside does not prevent it from being one of the most common used expanding menus in GUIs. Especially its ability to show more op-tions on a single screen than would be possible with a single flat menu list, makes it popular with designers [8].
2.4.4 Breadth and depth
Figure 2.5:An example of a pop-up menu.
2.4.5 Simultaneous and sequential
In a hierarchical menu, items are presented in a sequential manner when going through the different menus. However, the possible choices inside a menu do not need to be themselves in a hierarchical order [12]. For example, a hierarchical menu on a recipe website lets a user first choose an ingredient, then the type of meal and next the difficulty of preparing the meal. This is not the order in which these questions must be asked, making the questions themselves non-hierarchical. These options could also be presented in a simultaneous menu, making it possible to select any of these three options at any given time. Simulta-neous menus are more often used for complex tasks while sequential menus are preferred for simpler tasks.
2.4.6
Pop-up
A pop-up menu, is, as the name invokes, a menu that pop-ups some-where on the screen. See figure2.5for an example. This window is not attached to another menu or panel and is floating over the other parts of a GUI. It often closes by using a standard method for closing a panel or by clicking on a menu item inside the pop-up menu. The precise menu items of a pop-up window often depend on the location where the pop-up menu was called upon. The item beneath the cursor is what responds with the menu items inside the pop-up menu [1]. This attribute make it also a contextual menu.
2.4.7 Contextual
A contextual menu will vary in accordance to what invoked the menu. They try to help a user with their task by suggesting appropriate com-mands. An example of a contextual menu is the menu a user can see when right-clicking on an image in a browser. This gives the user op-tions like saving the image or opening it in a new window. Due to the location of the cursor of the user, namely the image, the browser de-duces that the user wants to do something with the image, giving it therefore a contextual menu that limits its menu items to actions re-garding the image.
2.5
Human-centered design
A human-centered design focuses on what people want to do, instead of what it is that the technology can do [9]. Focusing on humans and their needs requires designs that include diversity and that involves people during the design process. These requirements can be fulfilled by designing for users with different expertise and by including partic-ipatory design.
2.5.1
Designing for users with different expertise
designer should become familiar with the psychological characteris-tics, cultural background, physical attributes (i.e. age, vision or hear-ing) and level of experience of the user [13]. This informs the designer of the breadth of their users and can aid in deciding the limitations of a GUI design.
Studies agree that satisfying users with different backgrounds can best be achieved by offering a personalised GUI [3], [5], [14], [15]. This pro-vides users with the possibility to hide functions they do not use while highlighting the functions that they do use, making the GUI more effi-cient by providing clarity and structure [15] There are three approaches to personalising a GUI: (i) adaptive customisation, (ii) adaptable cus-tomisation and (iii) mixed-initiative cuscus-tomisation. An adaptive GUI will adapt to its user. The application decides how and what it will change and will base its decisions on earlier behaviour of the user. An adapt-able GUI is also adapt-able to change. However, it is the user who is in control regarding what will change when. A mixed-initiative GUI combines the approaches of an adaptive and an adaptable GUI. Therefore, both the system and the user can control some of the interaction. The opposite of a personalised GUI is a static GUI.
Gajoset al.[14], Findlater and McGrenere [15], Parket al.[3] and Al-Omar and Rigas have performed studies where they researched the different approaches of personalisation. Gajoset al.focused on differ-ent forms of adaptive GUIs in comparison to a static GUI. Remarkably they did not include an adaptable GUI, although their literature research showed that adaptable design is often better appreciated. Findlater and McGrenere compared a static, adaptive and adaptable GUI, Parket al.conducted an experiment with a static, two adaptive and an adapt-able GUI and Al-Omar and Rigas investigated the use of different forms of adaptive, adaptable and mixed-initiative GUIs. An overview of the different focusses can be seen in table2.1.
static adaptive adaptable mixed
Gajoset al. X X
Findlater and McGrenere X X X
Parket al. X X X
Al-Omar and Rigas X X X
Table 2.1:Overview of focusses of four studies.
de-sign might be best to satisfy all users. Only Al-Omar and Rigas in-cluded mixed-initiative design in their experiments, but they admitted that there was a drawback in their menu design, which might have been the reason why mixed-initiative design did not perform better than adaptable design for their experiment. Therefore, they recommend fur-ther experimentation to examine the mixed-initiative design against the adaptable design.
Another option to accommodate a broad group of users is by provid-ing ‘self-trainprovid-ing’ modules [7]. These modules can help users to acquire specific information quickly which enables users to learn and use new technologies fast. Users can determine themselves what they find im-portant, making it accessible to a group of users with different exper-tise.
In summary, three options were found to assist in making a GUI more personalised: (i) learning the characteristics of the different users, (ii) using one of the different approaches to personalise an interface, where a mixed-initiative and adaptable interface are favoured, and (iii) by pro-viding ‘self-training’ modules.
2.5.2
Participatory design
Participatory design (also called co-operative design or co-design) is a design philosophy that takes into consideration the needs and pref-erences of users [12]. This philosophy is aware that designers are not end-users and that designers should understand the requirements of the actual users [9]. Participatory design therefore includes users to enable designers to become aware of the needs and preferences of users. User inclusion can exist of interviews, observing users, focus groups, workshops, etc. Including users can inform designers on cur-rent problems users have and can give designers an understanding of the requirements that are needed for a design. A design created with participatory design can lead to a higher satisfaction and a better work process for users [16].
2.6
Aspects of interviews
Design choices will be based on literature research and interviews. There are different methods and rules to interviewing users. Three main types of interview can be discerned: (i) a structured interview, (ii) a flexible or unstructured interview and (iii) a semi-structured interview [1]. Other aspects of interviewing are also important, like maintaining a good atmosphere, avoiding leading questions and choosing a suitable form of data gathering.
2.6.1 Structured interview
and Preece state that there should be no room for deviations from the questions or their order. Lazar, Feng, and Hochheiser reasons that de-viating would interfere with the core motivation of using a structured interview, namely ensuring that the same questions are asked to all the interviewees. Advantages of using a structured interview are that they are relatively easy to analyse and are easy to carry out due to their pre-determined structure that the interviewer should follow [9], [12]. Struc-tured interviews are also more easy to carry out for interviewers with less experience and skills in doing interviews [12]. Disadvantages are, as mentioned earlier, having to give up on exploring unexpected an-swers and topics and acquiring less extensive data.
2.6.2
Flexible or unstructured interview
A flexible or unstructured interview has a list with topics established beforehand, but can change the order or the specifics of questions and can dive further into unexpected answers [1]. They resemble con-versations in a way and often go into considerable depth [8]. The in-terview often starts with an initial open question and the inin-terviewer will see where the interview will go from there. The interviewee can choose where to focus on regarding topics that they find important, giving them the ability to steer the conversation in a specific direction. This is a benefit of flexible interviews and it should therefore be avoided that an interviewer imposes too much structure [12]. Another benefit is the rich amount of data that can be acquired from flexible interviews [8]. However, that is also where the disadvantage lies of a flexible inter-view. The data is often complex and unstructured, making it a difficult and time-consuming task to analyse. A balance should therefore be found between checking that the main topics of an interviewer are cov-ered during the interview, but that there is sufficient room maintained to explore new lines of enquiry [8].
2.6.3 Semi-structured interview
A semi-structured interview combines the features of a structured and an unstructured interview. It has often a similar list of questions as used for a structured interview, however, during a semi-structured in-terview, interviewers can probe for more information after a question has been answered or can allow the conversation to go where it may [12]. The order in which the questions are may also vary. Semi-structured interviews are most often used by designers [9].
2.6.4 Atmosphere
2.6.5 Leading questions
An interviewer should avoid asking leading questions that might guide the answer of an interviewee in a specific direction [1], [8], [12]. Ques-tions should not encourage interviewees to give answers they think the interviewer wants to hear. Interviewers should be extra alert for these responses when talking about a design of which the interviewee knows that the interviewer designed it [12]. Body language should also be kept neutral by the interviewer, because smiles and frowns can be in-terpreted as an approval or disapproval of a question or answer, which in turn might influence the response or interpretation of the interviewee [8].
2.6.6
Data gathering
Chapter 3
State of the art
Win3D is a hybrid between a virtual globe and a geographic information system (GIS). Both terms will be explained in this chapter and software belonging to these groups wil be discussed. Furthermore, similar soft-ware to Win3D will be shown for the most extensive module of Win3D; the wind module. No similar software has been found that provides multiple modules with 3D visualisations. Games that use object place-ment in landscapes will also be discussed.
3.1
Geographic information system (GIS)
A geographic information system is ‘a computer system capable of in-tegrating, storing, editing, analysing, sharing and displaying geographically-referenced information’ [17]. In a broader sense, it is a tool that enables users to create interactive queries, to analyse spatial information, to edit data, to edit maps and that can present these results to the user. Since geo-spatial information refers to almost anything, GIS are ubiq-uitous distributed systems.
3.1.1 Google Maps
The most well-known GIS is Google Maps, a web mapping service de-veloped by Google [18]. A screenshot of Google Maps can be seen in figure3.1. The software is free to use. The software makes use of satellite imagery to provide street maps [19]. The more high-resolution images of mostly cities consist of photos taken from a plane. It also provided 360 degrees’ panoramic views of streets and route planning for both private and public transportation.
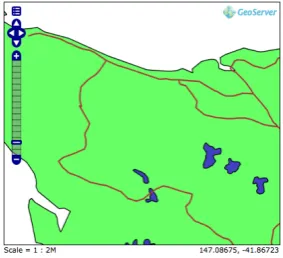
3.1.2 GeoServer
1Source:http://docs.geoserver.org/latest/en/user/_images/services_WMS_
Figure 3.1:Screenshot of Google Maps.1
Figure 3.2:Screenshot of GeoServer.
GeoServer, see figure3.2, is software that enables users to view and edit geospatial data [20]. It can create maps based on the spatial infor-mation the user provides. The spatial inforinfor-mation can be transformed to various 2D outputs. It can integrate with existing mapping APIs (e.g. Google Maps, Microsoft Virtual Earth, Google Earth) to display in a 3D environment. GeoServer is open source and free.
3.1.3 GRASS GIS
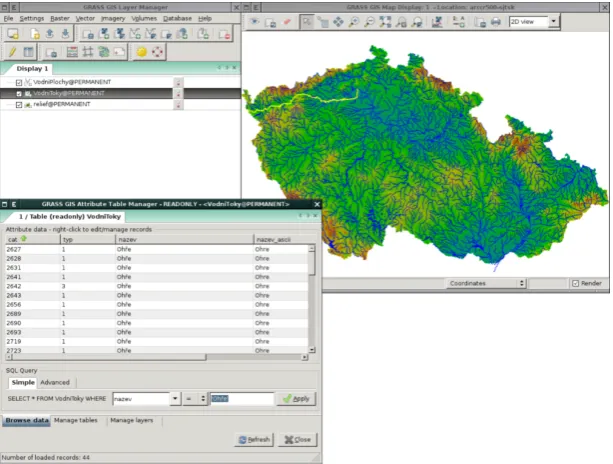
GRASS GIS software can render maps, store spatial data and visualise different types of data [21]. GRASS stands for geographic resources analysis support system. It is free and open source and has existed since 1982 and was originally developed by the U.S. Army Corps of Engineers Construction Engineering Research Laboratories. Due to its long existence, it contains over 350 modules and it has many capabili-ties like DTM-analysis, geocoding, SQL-support and vector analysis. It can support geospatial analysis in different fields like geography, hy-drology and ecology [22]. GRASS GIS provides a GUI and a command line syntax to make use of these functions. The command line makes the program better usable for people with a high computer expertise and not for novice users. GRASS GIS has a standard 2D map display, but it can also map in 3D. However, these images are made with 3D interpolation, diminishing the quality of the 3D visualisation.
3.2
Virtual globe
Virtual globe software can represent (parts of) the Earth or another world three-dimensional. See figure3.3for a screenshot of the soft-ware. The main difference of a virtual globe with a GIS is that virtual globe software enables the user to ‘drop down’ into a virtual environ-ment and to walk around in that environenviron-ment. This enables the user to explore the world from different angles and positions. Another feature of virtual globe software is the possibility to zoom out to look over the whole region and to seamlessly zoom in to focus on a small part of a region [17]. Virtual globes often do use GIS data for their representa-tions.
2Source: https://grass.osgeo.org/uploads/images/Gallery/gui/
Figure 3.3:Screenshot of GRASS GIS.2
3.2.1
Google Earth
One of the most well-known virtual globes is Google Earth [23], see figure3.4, which was originally created by Keyhole, Inc which was ac-quired by Google in 2004 [22]. Google Earth consists of two versions: (i) the basic and free Google Earth and (ii) Google Earth Pro. The latter was a paid upgrade ($399 for a year) but is as of January 2015 also free for users. Google Earth uses satellite images, mainly collected by NASA’s shuttle radar topography mission, aerial photographs and GIS data to visualise the whole globe [22]. The basic functions for a user of Google Earth are the ability to browse to a location and to move around in that location, to see various layers of mapping information (e.g. roads, recreational areas, borders) and to add personal points of interest.
[image:21.595.63.369.516.752.2]3.2.2 World Wind
World Wind, see figure3.5, is a virtual globe software that has been developed by NASA Ames Research Centre [24]. Most noticeable in comparison with other known virtual globe software like Google Earth is that World Wind has been developed and distributed under an Open Source Agreement from the start [25]. NASA wants to provide users with the opportunity to study, improve and redistribute their code. An-other difference is that World Wind is not targeting end-users. World Wind provides the software and information that software engineers need to build their own applications.
Figure 3.5:Screenshot of World Wind.
3.2.3 WorldWide Telescope
WorldWide Telescope offers similar Earth visualisation options as Google Earth or World Wind [26]. What it provides extra are 3D visualisations of eight celestial bodies, namely Venus, Mars, Jupiter, the four Galilean moons of Jupiter and the Earth’s moon. The software also provides high quality images of the sky, where images are presented at their actual position in the sky. Another feature is the visualisation of our solar system, where the user can move forward and backward in time with the software, see figure3.6. The images used for the software are acquired from many different sources, like the Hubble Space Tele-scope, the Chandra X-ray Observatory, IRAS, GALEX and other space and ground-based telescopes. The software was originally created by Microsoft Research in 2008. However, it is now an open source project and is managed by the American Astronomical Society.
3.3 Wind software
Win3D originated as software that focused on the placement of wind turbines in the landscape. There are other programs that work with wind turbines and landscapes, although they all differ from the ap-proach of Win3D. Different examples of such software are given below.
3.3.1
2D software
There are many software options to calculate the energy a wind tur-bine might yield, but almost all software options are using 2D maps to place the wind turbines in. Examples of such software are WAsP3,
Openwind4(figure3.7), Furow5(figure3.8), WindFarmer6(figure3.9)
and Windographer7. There is a large difference between visualising
in 2D and 3D. A 2D visualisation focusses more on the number that result from visualisation, like energy yield and possible financial prof-its, which is mostly interesting for the client that is building the wind turbines. 3D visualisation, however, also lay a focus on the aesthetic aspect of wind turbines, making it more suitable to convince stakehold-ers like residents to lend their support [27].
Figure 3.7:Screenshot of Openwind.8
3.3.2 Windfarm
Windfarm is commercial software by ReSoft [28]. The software can analyse, design and optimise wind farms by calculating cost of energy and energy yields, noise modelling, shadow occurrences and creating turbine data. The software can be used to place wind turbines in a 3D environment. However, this 3D environment can only be displayed in a wire-frame view, see figure3.10, when working in the software. It is
3Source:http://www.wasp.dk/wasp
4Source:http://software.awstruepower.com/openwind/ 5Source:http://solute.es/en/furow
6Source:https://www.dnvgl.com/services/windfarmer-3766 7Source:https://www.windographer.com/
8Source: https://videos.files.wordpress.com/aYf8kBL8/
digitising-in-openwind_dvd.original.jpg
9Source: http://www.solute.es/sites/default/files/fig86_wrwindspeed.
jpg
10Source: http://enertekglobal.com/wp-content/uploads/2016/03/WF-Base.
Figure 3.8:Screenshot of Furow.9
Figure 3.9:Screenshot of Wind-Farmer.10
possible to create a photo-realistic impression by rendering the wind-turbines over a provided photograph of the landscape, see figure3.11. It is not possible to maintain this realism while working in the program.
3.3.3 VisAsim
The most similar to the wind module of Win3D is a visual-acoustic simulation prototype tool called VisAsim [29]. This tool was part of an interdisciplinary study called ‘VisAsim – Visual-Acoustic Simulation for landscape impact assessment for wind farms’, was funded by the Swiss National Science Foundation (SNSF) and took place from 2011 to 2014 [27]. Manyokyet al.[27] stated that a multi-sensory approach is needed to acquire social acceptance by the public. A prototype tool, see figure3.12for a screenshot, was therefore built that could provide
Figure 3.10:Screenshot of WindFarm in wire-frame view.11
Figure 3.11:Screenshot of a photo-realistic impression with WindFarm.12
a high-quality visualisation in combination with a sound representation of the noise wind turbines can produce. However, the prototype tool was only able to visualise a small pre-determined landscape.
3.4
Games
Games have a different function than geo-based 3D planning software, but both have similar mechanics. Construction games also have an in-terface for placing objects in landscapes. Games are generally playtested before release and playtesting allows for evaluating the GUI and its ease of use. Examining these GUIs can lead to insights or design choices which might be applied to the concept designs.
13Source: http://www.visasim.ethz.ch/gallery/Visualizations/VisAsim_
Figure 3.12:Screenshot of VisAsim.13
14https://www.thesims.com/en_GB/
3.4.1
The Sims
The Sims14is a life simulation video game series. The game allows
people to build houses and to place objects in and around these houses. A player can sort and choose the objects they can choose from in two ways: (i) by selecting a type of room (e.g. kitchen, living room, bed-room) and then selecting the object type associated with such a room, see figure3.13, or (ii) by selecting a function (e.g. comfort, entertain-ment, decoration) and then selecting the object type associated with such a function, see figure3.14. An object is selected by clicking on
Figure 3.13:Example of room selection and object type selection.
Figure 3.14:Example of function selec-tion and object type selecselec-tion.
it. Clicking again in the landscape places the object. An example of the object is given before placing it. Holding the left mouse button allows the player to rotate the object. An object is picked up again by clicking the object. An object is deleted by pressing the delete key while the object is picked up.
Figure 3.15:Wind turbine selection.
Figure 3.16:Pop-up window when click-ing an object.
15http://www.citiesskylines.com/ Cities: Skylines15is a city-building video game. A type of object that
can be placed in the game are wind turbines, which can be selected by choosing the electricity group, represented by a lightning icon, and by clicking on the wind turbine icon, see figure3.15. A wind turbine can then be placed in the landscape by clicking somewhere on the land. Objects cannot be rotated. Clicking on the object opens a pop-up win-dow with object specifications, see figure3.16. Clicking the bottom left button with a house and two arrows icon allows the player to move the object around again. Selecting a bulldozer icon on the screen and clicking an object removes that object.
3.5
Conclusion
Chapter 4
Interface analysis
The final product of this graduation project is a new interface con-cept design for geo-based 3D planning software. However, before any thought can go into how this concept should look, an analysis is neces-sary on the current interface and functionalities of the software. This analysis consists of experiencing the software as a new user, map-ping behaviour and routes of menus and windows, listing all function-alities, looking at the interface regarding the design principles elabo-rated in paragraph2.3, and distinguishing and categorising problems and faults within the interface and, if applicable for this research, soft-ware. Software problems found that are not of interest for this gradu-ation project have been communicated to the employees of the com-pany but will not be included in this thesis.
4.1
New user experience
The employees of the company have no trouble navigating through the software with the current user interface. They have experienced the in-cremental steps that the user interface has taken over the years. Each step required only a small adaption in behaviour and had a short learn-ing curve with a slight slope. This results in them belearn-ing able to navigate through the interface with ease, even though the program is elaborate and has many functions, because they have had the time and the op-portunity to grow with the program. Furthermore, changes and addi-tions to the interface have been made with the realisation that all em-ployees already knew how everything worked. Therefore, no thought went into a possible user that was new to the program when making changes or implementing additions.
4.1.1 Reception
Access was given from January 2017 and onwards and new users have had time to experience and experiment with the software. Two main reactions were registered among new users: (i) users had difficulty with using the program and would contact ROM3D (in person or by tele-phone) for further instructions and guidance and (ii) new users gave up trying to learn the software due to the difficulty of navigating through the program and using its functions. These latter users would often then request ROM3D to do the visualising for them instead, similar to how the situation had been before access was given to the software.
4.1.2
Guidelines for exploration
Somehow the software results in many new users who give up trying to learn to work with the program. The employees of ROM3D find it hard to pinpoint where the trouble lies with the interface and naviga-tion due to them being accustomed to the software and its design. To discover where a new user has trouble with working with the software, two guidelines were made for exploring and mapping the interface: (i) no manual would be used while exploring the software and (ii) mini-mum help would be asked and only after extensively trying to figure things out independently. These guidelines allowed for an experience similar to a new user with no direct access to help from ROM3D em-ployees.
4.2
Mapping behaviour and layout of the interface
Figure 4.1:Main menu.
com-plete list of functions can be extracted from the mapping documenta-tion.
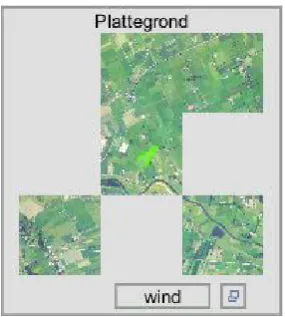
The current interface revolves around a main menu, see figure4.1. This is one pop-up window that provides access to everything the soft-ware offers. The main menu is divided in three tabs titled (i) alge-meen (English: general), (ii)instellingen (English: settings) and (iii) help. Under the tabalgemeenthere are two more tabs titledvensters (English: windows) andopties(English: options). The first tab alge-meengives access to almost all functionality of the software and con-sists of different ‘modules’, as the program calls them. Each module option opens a new window with corresponding menus. For each mod-ule, a mapping document has been made. Separate documents were made due to each module being self-containing, meaning that a user cannot go from one module to another module, but will always need to go through the main menu to open module windows. There is one ex-ception, where a user can go to thescenariomodule(English: scenario module) through the drag and drop module if a user selects an object while not yet having selected a scenario. This is mentioned in the map-ping documentation while both modules retain their own document.
4.2.1
Mapping documents
Figure 4.2:The mapping document of thedatalaagmanagermodule.
(ii) The line can lead to a remark or clarification of an aspect of the interface.
Figure 4.3:The mapping document of thesnelmenumodule.
A question mark, as can also be seen in figure4.2, represents a part of the interface that is not clear or cannot be determined after following the guidelines to experience the interface as a new user without receiv-ing external help. Clarification on all question marks were asked after finishing the mapping documentation. The answer to each question mark is documented in the text document, keeping the question marks in the mapping documentation intact to keep an overview of where the interface can possibly be problematic to a new user.
Next to all window menus, important changes in the landscape of the program actuated by menu input were also documented. An exam-ple can be seen in figure4.3, where buttons from thesnelmenulead to landscape manipulation or measurement. The entire mapping doc-umentation can be found in appendixB. The text document can be found in appendixC.
4.3
Important workings and modules of the current
interface
Figure 4.4:FPS counter and memory counter (top) and device information (bottom).
Figure 4.5:Example of buildings.
Figure 4.6:Example of trees.
Figure 4.7:Example of water.
Figure 4.8:The landscape with height differences.
understanding of the current interface and the possibilities and limi-tations of the software. Remaining and less important modules are briefly discussed in paragraph4.4.
4.3.1 Main menu
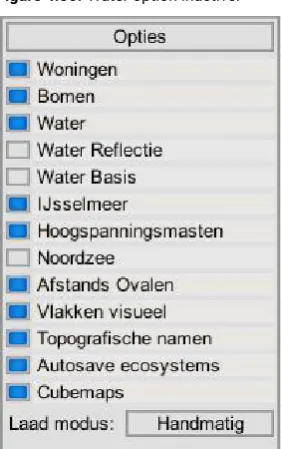
As mentioned in paragraph4.2, the current interface revolves around the main menu, since access to all functions of the software is given by that specific menu. The portal to all module windows is under the tabvenstersin the main tabalgemeen. The second taboptiesgives to possibility to toggle different options on and off in the landscape, like displaying buildings, trees and water, usage of high quality water, displaying topographical names and showing circles around wind tur-bines to signal how far wind turtur-bines should stand from each other. Next to the taboptiesthere are sliders to change the height of the wa-ter level and the wa-terrain surrounding the 3D wa-terrain.
The second main tabinstellingengives access to changing the perfor-mance and settings of the program. The first tabresoluties(English: resolutions) changes the resolution of the screen and the second tab kwaliteit(English: quality) changes the computer power needed to run the program and subsequently the quality of the screen image. The tabkwaliteitcan also change the anti-aliasing, controlling the smooth-ness of lines in the program, where a higher smoothsmooth-ness requires more computing power. Other options in this main tab are toggling between showing or hiding different information (e.g. frames per second (FPS) counter, memory counter) on the screen, see figure4.4, toggling be-tween full screen and windowed mode, and switching bebe-tween two languages: (i) Dutch and (ii) English, although the English translation is not complete.
The last main tab help includes an e-mail address for asking questions and the version number of the program. Lastly, all main tabs have a button to quit the program.
4.3.2
Tegelvenster
module
4.3.3 Camera navigation
Camera navigation happens with the right mouse button for looking around with the camera, WASD keys (referring to the letter keys W, A, S and D on a keyboard) for moving the position of the camera forward (W), left (A), right (D) or backward (S), the left and right arrow keys to turn the camera left and right while the position of the camera is main-tained and the page up and page down keys for moving the camera up and down respectively. There are four different speeds for camera movement: (i) the slowest speed attained with only using WASD keys, (ii) a faster speed attained by using WASD keys in combination with holding the alt key, (iii) an even faster speed by using WASD keys in combination with holding the shift key and (iv) the fastest speed by using the WASD keys and holding both the alt key as the shift key.
4.3.4
Loadable 3D objects
The main reason for existence for 3D geo-planning software is to allow users to create new setups in an environment that mirrors an existing environment. The conversion from a real environment to a similar dig-italised environment will be done and provided by ROM3D for users. This conversion entails the placement of buildings, trees and water in the landscape and giving the landscape different heights in accor-dance to the real situation. This conversion done by ROM3D is what is loaded into the program when using thetegelvenstermodule.
Users cannot add, change or remove objects from this conversion. This means that no buildings, trees or water that have been loaded in from a tile can be removed. However, buildings, trees and water can be hidden from the landscape. It is also not possible for users to add new buildings or water, but users can add new and different trees. Aesthetic parts of the loaded in objects, however, can be changed, like the colour of buildings or the thickness of tree leaves. The height of the landscape is also open for change and there are two terrain editor modules a user can use to change the terrain (e.g. lower or raise the terrain, paint the terrain, smooth the terrain).
4.3.5 Placable 3D objects
The user is free to create new setups in the digitalised terrain. Users can place objects in the landscape after loading tiles and the accompa-nying 3D models. Object manipulation exists of placing, moving, scal-ing and removscal-ing objects. These objects can be placed one by one or values can be given to create fields with many objects. However, be-fore objects can be placed, a scenario must be selected in the scenar-iomodule. This module provides the possibility to save the placement of objects. It does not save edits to the terrain or aesthetic changes to the landscape and 3D objects, since these edits are saved separately in the corresponding modules or automatically by the software.
4.3.6
Scenario module
Figure 4.10:Two saved camera posi-tions and a plus button to add a new camera position.
Figure 4.11:Drag and drop module.
be selected and made active in a tab, while multiple tabs can be ac-tive. Only the objects belonging to an active tab can be seen in the landscape.
Figure 4.9:Scenario module example.
Tabs can be used for assigning different regions, themes or functions. For example, a landscape architect can be curious to how the ratio of wind turbines and trees can affect the landscape. They can then make two tabs, one called ‘wind turbines’ and the second tab called ‘trees’. They can then choose to make inside the wind turbines tab three sce-narios; (i) a scenario with one wind turbine, (ii) a scenario with three wind turbines and (iii) a scenario with ten wind turbines. They will de-cide to make four scenarios in the trees tab, with each scenario an increase in the number of trees, going from a few lonely trees to a soil-covering forest. The module will then look as in figure4.9. Both tabs are active, as can be seen by the blue boxes next to the tab titles. In each tab one scenario can be selected and this scenario will be dis-played in the landscape. This enables the landscape architect to see both the trees and the wind turbines in the landscape while toggling be-tween the different alternatives regarding the number of wind turbines and trees, allowing for an exploration of different combinations. Each scenario has the possibility to save a camera position. After a camera position has been saved it is possible to fast travel to this po-sition by clicking the corresponding image of the camera viewpoint miniature, see figure4.10. This allows for fast travel and makes it easier for storytelling. Employees of ROM3D use it often when go-ing through the landscape with a client after ROM3D has fulfilled an assignment and is talking the client through it, or when holding a pre-sentation.
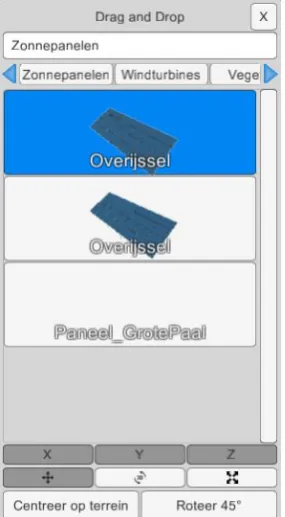
4.3.7 Drag and drop module
After selecting a scenario, it is possible to drop objects into the land-scape from the drop and drag module, see figure4.11. The different objects are divided in this order under the following tabs:
• Zonnepanelen(English: solar panels) • Windturbines(English: wind turbines) • Vegetatie(English: vegetation) • Tekenen(English: drawing) • Overige(English: remainder) • Onkruid(English: weeds)
• Onderbegroeiing(English: undergrowth) • Naaldbomen(English: coniferous trees) • Loofbomen(English: broad-leaved trees) • Import
Figure 4.12:Selection field.
[image:35.595.392.535.208.348.2]Figure 4.13:Quick menu of a wind turbine.
Figure 4.14:Animatiepadmarker (left) andpolygoonmarker (right).
• Biovergisting(English: anaerobic digestion) • Basisvormen(English: basic shapes) • Aankleding(English: stage setting)
An object can be selected by clicking on a button with its name after which the button will be highlighted. The selected object can then be placed in the landscape by clicking on the position the object must be placed. One click places one object. Clicks will result in the placement of new objects as long as the object is selected in the drag and drop module. Deselection occurs by clicking on the button with the name of the object a second time.
It is possible for a user to change the position of an object after it has been placed in the landscape. Objects in the landscape can be se-lected one by one by holding the control key and clicking with the left mouse button on each object that needs selecting. By clicking a sec-ond time an object gets deselected. Multiple objects can be selected by holding the control key and left mouse button pressed, resulting in a field which can be dragged with the mouse over the area with objects that need selecting. See figure4.12for an image of the selection field. Deselecting multiple objects can be achieved by the same method, ex-cept the alt key should be pressed instead of the control key. Selected objects can be removed by pressing the delete key. Other select op-tions can be found in the quick menu, see figure4.13, which can be opened by clicking the right mouse button on a selected object. Selected objects can be moved, rotated or scaled, depending on which option is active of a radio button (i.e. a button that only allows one op-tion to be active) in the drag and drop module. The first opop-tion, see the button below the ‘X’ button in figure4.11, allows for moving the object in all directions. Eliminating movement in (a) certain direction(s) can be done by pressing the x, y and/or z button. The second option, see the button below the ‘Y’ button in figure4.11, allows for rotating the ob-ject. Rotation can only happen in the y-direction. Theroteer 45°button rotates selected objects quickly 45 degrees clockwise when pressed. The third option, see the button below the ‘Z’ in figure4.11, allows for scaling the object. Scaling can also happen in all directions or be lim-ited to one or two directions. Selected items can be moved, rotated or scaled by pressing the left mouse button and dragging the mouse around the landscape.
4.3.8
Tekenen
tab
Thetekenentab in the drag and drop module contains something else than objects that can be used for visualisations. The tab contains two markers; (i) ananimatiepad(English: animation path) marker and (ii) apolygoon(English: polygon) marker. Apolygoonmarker can also be placed from theecosysteemmanager(English: ecosystem manager) module detailed in paragraph4.3.9. Placement of bothanimatiepad andpolygoonmarkers in the landscape results in the placement of the same shape, see figure4.14. However, each marker has a different function. When holding the shift and control key while clicking with the left mouse button on the marker gives each item a different menu. Theanimatiepadmarker opens a menu as seen in figure4.15and the polygoonmarker opens a menu as seen in figure4.16.
Figure 4.15:Menu of aanimatiepad
marker.
Figure 4.16:Menu of apolygoon
marker.
Figure 4.17:Camera line (white) and viewpoint line (red).
meaning that the line determines the position of the camera. A sec-ond line can be placed to indicate where the camera should look at. An example of such lines can be seen in figure4.17. The movement speed of the camera and height of the path points can also be adjusted. A preview of the camera movement can be seen before rendering the frames.
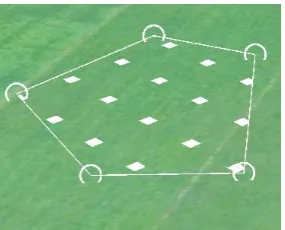
The polygon menu leads to an important function of the software; the placement of polygon shapes called fields, in which multiple objects can be generated. A field is created by placing three or more path points, see figure4.18. A group can then be made in the groepen-manager(English: group manager) where one or multiple types of ob-jects can be selected and given values for placement. Access to the groepenmanageris possible through both thepolygoonmenu as the animatiepadmenu. There are five different types of groups: (i)langs de lijn(English: along the line), (ii)distributie(English: distribution), (iii) grid, (iv)rijen(English: rows) and (v)animatie(English: animation).
Langs de lijngroup
Objects in this group are only placed along the lines around the polygon shape. How far objects differ from the line and each other can be filled in. This group can also be placed along an animation line.
Distributiegroup
Objects in this group are placed randomly inside the field. The density of the objects can be changed. Solar panels are often placed with this type of group.
Grid group
Objects in this group are placed in vertical and horizontal rows and the distance between the objects in both direction is kept the same. These distances can be filled in.
Rijengroup
Objects in this group are, like the grid group, also placed in vertical and horizontal rows, but the software will fill the rows in as efficiently as possible, placing as much objects as possible within the field. This is not possible with the grid group because objects need to stay horizon-tally and vertically in a neat row. Therijengroup, however, only has objects in a neat horizontal row, while objects do not have to form a row horizontally. Distances between rows can be filled in by the user.
Animatiegroup
Figure 4.18:A field with five path points.
[image:37.595.393.536.69.184.2]Figure 4.19:Purple placement blocks of objects in adistributiegroup.
Figure 4.20:Example of a distribution between two objects.
object. Therefore, it is possible to make also trees or wind turbines move through the landscape.
Purple blocks, see figure4.19, indicate where objects will be placed within the field. These blocks can be moved and rotated to change where the objects will stand. Thelangs de lijnandanimatiegroups do not produce purple blocks before placement.
4.3.9
Ecosysteemmanager
module
This module has similarities to thepolygoonmenu from paragraph4.3.8. Theecosysteemmanagermodule can also place objects within a poly-gon field. However, choosing objects and assigning values works dif-ferently and a user can only select vegetational objects.
A user starts with making a new ecosystem. This leads to a new win-dow. Inside this window users can change the name of the ecosys-tem and choose a type of soil. Users can also make different groups. Each group can consist of one or multiple objects. There is a list of objects to choose from, like grass, swamp sawgrass or maize. The minimum and maximum height for these objects can be given to al-low for a variation of sizes. The distribution of objects for a group are given in percentages. For example, a group with two objects, (i) grass and (ii) maize, can exist of 80% grass and 20% maize, see figure4.20. How much each group is represented in an ecosystem is also given in percentages. The user must fill in a number to specify the objects per square meter. This number in combination with the percentages of both the groups as the objects allows the program to calculate how to fill in a polygon field.
The user needs to specify in thepolygoonmenu which ecosystem it wants to use for the field belonging to the polygon marker. The ecosys-tem field can then be generated via theecosysteemmanagermodule. Only selected polygon fields can be planted with their linked ecosys-tems or all polygon fields on a tile can be planted at once. The terrain can also be cleared again from all ecosystems.
Only one ecosystem can be planted at a given time in a field, meaning that two or more ecosystems cannot overlap. Objects made with the groepenmanagercan overlap and groups can therefore be placed over each other. These objects can also be placed atop a planted ecosys-tem.
Two other attributes that can be changed through the ecosysteemman-agermodule are: changing the distances that determine if an ecosys-tem is displayed in (i) the landscape and (ii) on a screenshot. The per-formance of the program can be enhanced by setting the distance to display ecosystems in the landscape low, since the program then only needs to use its computing power to render an ecosystem when it is close to the ecosystem.
4.4
Overview of remaining modules of the current
in-terface
Figure 4.21:Multiple transparant colours of layers.
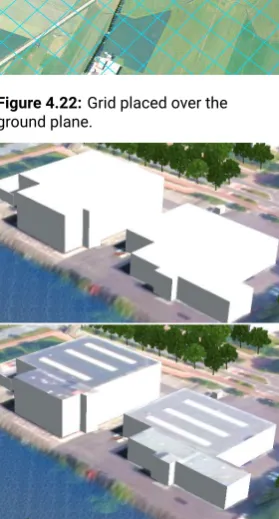
Figure 4.22:Grid placed over the ground plane.
Figure 4.23:Building with and without a satellite photo on its roof.
4.4.1
Atmosferische effecten
module
Theatmosferische effecten(English: atmospheric effects) module can change the position of the sun and the illumination of the sky by chang-ing the date and the time. All objects cast a shadow, and especially for wind turbines it is helpful to know where shadow from the wind tur-bine blades (Dutch: slagschaduw) is located. Different positions and lengths of shadows can be studied by changing the date and time. The progression of the sun can also continue automatically, where the user can specify how fast the sun should travel along the sky.
Sky domes can also be selected, making it possible to change the im-age used for displaying the sky. Furthermore, clouds can be toggled on and off and information about the sunrise, sunset and length of the day is displayed.
4.4.2
Bomen
module
Thebomen(English: trees) module can change two aesthetic aspects of trees: (i) the colour of the leaves and (ii) the density of the leaves. All trees can be given the same changes or changes can be made sepa-rately for each tree type. All changes can be saved, loaded or restored.
4.4.3
Datalaagmanager
module
Thedatalaagmanager(English: data layer manager) module allows the on and off toggling of layers. A layer consists of a shape that is draped over the ground plane and exists of one transparent colour, see fig-ure4.21. Layers are visual guides to locations of regions or other as-pects of the landscape. There are often layers provided by ROM3D, however, users can add their own layers by importing shapes from their computer. Different layers can be made visible or invisible and layers can be grouped together to keep a clear overview.
4.4.4 Geocoding module
The geocoding module functions as an address search engine. A user can fill in an address after which the program gives suggestions re-garding what the user might have meant. The user can click on one of the suggestions which will move the camera location to the selected address.
4.4.5 Grid module
The grid module places a grid over the ground plane, see figure4.22. The distance between lines can be adjusted, the grid can be rotated and the grid can be moved to the x-direction and the y-direction through the grid module.