Summative Evaluation of the Antibiotic Information App
Bachelor thesis
26-06-2014
Marjolein Hartgerink, s1235214
University of Twente
Faculty of behavioral sciences
First supervisor: L. van Gemert-Pijnen
Content
Abstract ... 2
Introduction ... 3
Methods ... 8
Results ... 13
Conclusion ... 21
Discussion ... 23
References ... 26
Abstract
Nurses have important tasks regarding medication and antibiotics. Physicians prescribe the medication, but nurses need to give the correct dosage. They are close to the patient and are the first to notice differences in a patients status. Nurses receive a lot of information from many different devices, including a lot of information that has to do with Antibiotic Stewardship. Antibiotic
Stewardship programs try to optimize the use of antibiotics in order to control antibiotic resistance, which is caused by wrong or careless use of antibiotics. All this information could lead to a cognitive overload for nurses, and integrated information could be a solution. Therefore, an antibiotic
information app was designed for nurses, to help them with their information needs. This research tested whether the app was effective and supportive for nurses. Nurses needed to solve three scenarios with or without the app. The scenarios contained situations and questions that could arise during their job. There were three conditions, a baseline measurement without the app, and two post-measurements 8 months after the first measurement, one post-measurement with and one post-measurement without the app. During these months, the app was available for all nurses. The expectation was that the effectiveness of the app was positively evaluated and that it would be easier for nurses to find information with than without the antibiotic app. The results of this research were not conclusive. It was ambiguous whether nurses did found more correct solutions, but it seemed to be that nurses were more satisfied with the app than with the other resources. It was not clear whether the app supported nurses to find the solution in less time, nor whether the app
Introduction
Nurses are very important because they are close to the patient all the time. When the physician is not around, nurses are the ones who notice differences in a patient’s status. Koch et al. (2012) have observed five frequent task categories which nurses fulfill: communication, medication management, patient awareness, organization and direct patient care. Doctors prescribe medication, but nurses prepare antibiotics and medication and give these to the patient. They need to give the right dosage, also if there are changes in a patients status. This shows the importance of the tasks of nurses. It is important to give antibiotics with the right dosage, it will contribute to the problem of antibiotic resistance if antibiotics are mis- or overused (MacDougall & Polk, 2005). Careless or wrong use of antibiotics causes antibiotic resistance. This is a problem because despite the critical need for new antibiotics, the development of these is declining (Spellberg et al, 2004). So possibilities that patients get infected by a resistant bacteria increase and treating this is hard because there are less
antibiotics which are effective. Wrong use of antibiotics has disadvantages for the patient, like more complications and more side-effects.
Antibiotic stewardship
Antibiotic Stewardship Programs are used to prevent wrong or careless use of antibiotics. These programs aim to optimize antibiotic use in order to control antibiotic resistance. This happens by only giving antibiotics when it is really necessary because by doing this, antibiotics stay effective and patients can get an optimal treatment (Kaki et al, 2011). The use of antibiotics can be optimized in four ways, firstly by giving the right dosage to the patient, not too much and not too little because by doing this, the antibiotic can work optimally with the smallest risk of resistance development.
Secondly, give patients a small-spectrum antibiotic as fast as possible because when the cause is known, the pathogen can be tackled more effective. Thirdly, by making sure that patients will get antibiotics as long as necessary, but no longer. The more time antibiotics are used, the higher the chance to develop antibiotic resistance becomes. Lastly, give patients oral instead of intravenous administration as soon as possible because an infusion increases the chance of infections and without an infusion, patients are allowed to go home more quickly (Karreman et al., 2010). Nurses have an executive, controlling, observing and alarming role in antibiotic stewardship and they need a lot of information about antibiotics to do this well. This information needs to be easily accessible to perform antibiotic tasks as optimal as possible.
Tasks of nurses
taking, etc. Besides information about antibiotics, there are more things nurses need to let them do their job. Collaboration is a key factor in hospitals and in intensive care units (ICU) and collaborative communication contributes to collaboration (Boyle & Kochinda, 2004). This is associated with positive nurse, patient and physician outcomes and Boyle & Kochinda have shown that collaborative communication can be improved. Positive nurse outcomes include enhanced professional
relationships, increased satisfaction and lower turnover. Positive physician outcomes include enhanced learning and professional relationships and research utilization. So collaborative communication is important because it helps nurses doing a better job. Clinical decision support systems (CDSS) are important too. CDSS’s improve health care outcomes and reduce preventable medical adverse events (Yuan, Finley, Long, Mills & Johnson, 2013). A CDSS is an application that analyzes data (for example provides a huge knowledge base) to help nurses and doctors with clinical decisions. This is an example to show what technology can do for nurses. The interoperable
technology solutions could improve patients’ safety and outcomes for nurses and reduce errors. So CDSS’s support decisions, but the effectiveness of CDSS depends on the implementation and usability in complex health care situations.
Information integration and integrated displays
Information integration at the bedside may improve nurses’ situational awareness (SA) of the patient and decrease errors and improve safety of the patient in the future (Koch et al., 2012). The workload of nurses is high, they are engaged in more than one task frequently. They need to be aware of patients’ treatment goals, are responsible for the monitoring and check changes in physiological functions, need to document their work, give medications and provide care coordination. All
must become involved in the future design and development of the electronic patient record. But the study of While & Dewsbury also shows positive results for the use of technology in health care situations (2011). For example, it enables new services like virtual health promotion sessions and it enables better personalized care planning and care coordination. So technology can be very useful, but it has to be a positive addition.
Persuasive technology
[image:6.595.79.503.410.629.2]Information integration could be a solution, but other strategies about the designs of technology could be helpful too. Persuasive technology is interactive information technology designed for changing users’ attitudes or behavior (Fogg, 2003) and could support nurses too. Behavior change support systems (BCSS) are information systems designed to form, alter or reinforce attitudes or behaviors or both without using coercion or deception (Oinas-Kukkonen, 2010), and have something in common with persuasive technology. The Persuasive System Design model developed by Oinas-Kukkonen and Harjumaa (2009) shows that the development of Persuasive systems consists of three steps, as shown in figure 1.
Figure 1
Persuasive System Design Model
primary task support is the most important part in such displays. When reduction and tunneling are well applied, this will lead to better performances.
Antibiotic information app
[image:7.595.52.491.415.829.2]Nurses gather information from different information systems, have to integrate this information and have to decide whether further action is required. There are many applications to support health care workers, both websites and mobile applications (Koch et al., 2012). But regarding ASPs, no applications regarding nurse support are identified in literature, probably because nurses are overlooked as stakeholder in ASPs. An antibiotic information app for nurses was developed to provide nurses with task support (Wentzel & van Gemert-Pijnen, 2014). It is called the antibiotic information app, and it makes information easily accessible. Nurses can find everything they need during their work, the information is grouped by the following categories: information needed to perform the primary tasks, important information and warnings, general or background information, extra checks and safety information, and information for specialists and medical background. This is demonstrated in figure 2.
Figure 2
When nurses searched for an antibiotic, this was the first screen. This contained all information nurses might needed about the antibiotic. Nurses could click on every box to open a new screen with detailed information about the topic on the box. When nurses continued their search by clicking on dosage for example, they could find everything about the dosage for that specific medicine, including information when giving an overdose to a patient (this was shown in figure 3). This illustrates the principle of reduction, all information is reduced into small boxes of information. This simplified the search for information. Nurses may be better equipped to perform antibiotic tasks by providing easily accessible information, and are better able to recognize suboptimal antibiotic use (Wentzel et al., 2014).
Figure 3
Antibiotic App, specific dosage information
from many different devices, including a lot of information which is important with regards to Antibiotic Stewardship. Integrated information could improve situational awareness of the patient, decrease errors and improve safety for the patients. An antibiotic app with organized and easily accessible information could be a solution, this app works as an integrated information system. In this research we evaluate if the Antibiotic App (Wentzel et al., (2014) is effective and if it supports nurses with regard to time to find correct information and satisfaction about the app. The following research questions lead this research:
- Does the antibiotic app support nurses regarding Antibiotic Stewardship? - Are nurses faster with finding information than in the current situation? - Are nurses better to find correct information?
- Are nurses experiencing less problems to find information? - Are nurses more satisfied compared to the old situation? - Are nurses more able to contribute to Antibiotic Stewardship?
This research intends to answer these questions. The expectation is that the participatory
development process has resulted in positive effects for the use of the antibiotic app, regarding the amount of time to find information and the correctness of information. The expectation is that the effectiveness of the app is evaluated positively because of the participatory development and that it will be easier for nurses to find information with than without the antibiotic app.
Methods
The research was conducted by Wentzel & van Gemert-Pijnen (2014). There were nine scenarios created, together with a pharmacist and clinical microbiologist. This co-operation increased the validity of the scenarios. The scenarios presented situations that could arise during the work of nurses, and contained an information need about antibiotics. These cases contained the most critical moments in antimicrobial use, where mistakes were most likely and better information would have prevented mistakes. One of the scenarios was showed, translated from Dutch: “A COPD patient, gets Tobramycine, 1 time daily 240mg intravenous. The patient weighs 150kg. You are wondering
All nurses were asked to solve three scenarios. Sixteen nurses participated in the baseline
measurements test (N=16), and thirty-three participated in the post-measurements (N=49 in total). The post-measurement consisted of two conditions, an experimental group and a control group (post-measurement with the app (N=16) and post-measurement without the app (N=17). The participants were divided randomly over the post-measurements and the participants differed in gender, age and work experience but they all worked in Medisch Spectrum Twente, a hospital in Enschede.
Scenario-based tests
During the baseline measurement, nurses had to solve the scenarios relying on their usual information sources and all nurses had no experience with the antibiotic information app. During post-measurement, all nurses have had access to the antibiotic information app for eight months. One group has solved the scenarios without the use of the antibiotic information app (thus according to the old situation, without the app) and the other group was allowed to solve the scenarios with use of the app. All participants received three scenarios and where asked to give a solution (“what would you do or what needs to be done?”). The scenarios were randomly divided. Nurses were asked to perform their information-search activities while talking out loud, like ask a colleague, seek
problem. The amount of problems was counted for every respondent for every scenario and divided by three to receive the mean amount of problems for every respondent since all respondents solved three scenarios. All calculations were done with this mean score and the true score. The scenarios could be found in Appendix B. Whether the app was supportive regarding Antibiotic Stewardship was related to the correct solutions, since more correct solutions contributed to more correct use of antibiotics.
Correctness of the scenarios
[image:11.595.67.528.341.485.2]The solutions for the scenarios were divided into six options, as can be seen in table 1. These codes could be further divided into three categories, with the labels positive, neutral and negative. The division was based on the fact whether the information resources were supportive or not. Table 1
Solutions divided into codes and labels
Code Meaning Label
1 Wrong information and a wrong conclusion or no conclusion Negative 2 A failed search for information and a wrong conclusion or no conclusion Negative
3 (directly) asked for extern help Neutral
4 Wrong information but a correct solution Neutral
5 Correct information but a wrong conclusion Positive
6 Correct information and a correct conclusion Positive
Independent variables
There were three independent variables: the baseline measurement, the post-measurement without the app and the post-measurement with the app. The participants were randomly divided into these conditions. Firstly the baseline measurement, where respondents had no knowledge about the app. After this baseline measurement, the app was introduced to all nurses at specific units, so everyone could work with the app and experience the app. After 8 months, the post-measurements was done. This measurement was divided in 2 categories, a condition where participants were not allowed to use the app (post-measurement without the app) and a condition where participants were allowed to use the app (post-measurement with the app).
Dependent variables
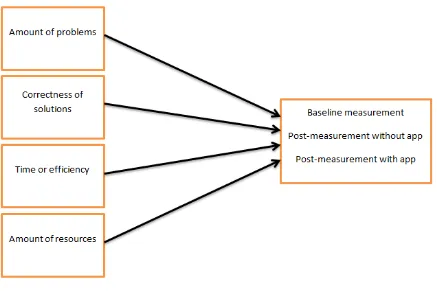
There were four dependent variables: the amount of problems nurses experienced while solving the scenarios, the correctness of the solutions, the differences in time of efficiency and the amount of resources nurses used while solving the scenarios. For every condition, there were formed
expectations about the results. Firstly, it was expected that nurses did experience less problems when they were allowed to use the app than when they were not allowed to use the app or during the baseline measurement. Secondly, the correctness of the solutions was checked and coded to see whether the information resource was more or less supportive to find the correct information. It was expected that information resources were more supportive during the post-measurement with the app than during the other conditions. Thirdly, the differences in time or efficiency. It was expected that nurses needed less time to solve a scenario when they were allowed to use the app than when they were not allowed to use the app. Finally, the amount of resources nurses used while solving the scenario. It was expected that nurses needed less resources when they were allowed to use the app (since the app intended to be a supportive information resource) than when they were not allowed to use the app.
Figure 4
Model of dependent and independent variables
Statistical analyses
All analyses were done with a significance level of 95% (Cronbach’s alpha=0,05). The normality of data was checked for all variables, as well as there was checked whether the groups were equally divided based on gender, age, internet use and work experience as a nurse and work experience at the current unit. This was done with one-way ANOVA analyzes. All tests were done one-tailed since the dependent variables were compared to the independent variables only, not vice versa nor were the dependent variables compared to each other.
The mean scores for problems, time and resources were calculated and used during the analyses as well as the original scores. The variable correctness was divided into labels (this could be seen in table 1). The dependent variables (amount of problems, correctness, time and resources) were individually compared to the independent variables (the three conditions). This was done by means of independent-sampled T Tests, to find out whether the differences between the conditions were significant. The amount of problems as well as the solutions (whether the scenarios were solved correctly or not) were coded by two coders. The agreement between two raters was calculated with Cohen’s kappa. An overview of all variables and outcome measures was shown in table 2.
Dependent variables and outcome measures
Variable Outcome measures* Data source
Time Number of seconds needed to
complete scenario
Observation
Problems while solving Number of experienced problems while solving scenario
Verbalization
Problems in total Number of experienced problems in total
Verbalization
Used resources Number of used resources to complete scenario
Verbalization
Correct solution Scenario correctly or incorrectly solved
Verbalization
* Both expressed in number of scenarios during which problems were faced as well as in number of respondents encountered the problem. Repeated problems were only counted once.
Results
[image:14.595.64.528.717.762.2]The scenario-based tests were completed by 50 nurses (N=50), 82% (N=41) were women and 16% (N=8) were men. The 2% was explained by missing values and this respondent (N=1) was excluded (Appendix C, 6). A one-way ANOVA analysis showed that the three groups did not differ significantly based on gender (p=0,884), age (p=0,470), internet use (p=0,375), work experience as a nurse (p=0,692) and work experience at the current unit (p=0,579) (Appendix C, 6). The mean age of the participants was 32,02 years. The average amount of years nurses worked at the current unit was 5,65 years, and the average amount they worked as a nurse was 9,14 years. The mean score for their internet use (at work as well as private) was 2,52 hours. 16 respondents completed the baseline measurements (condition 1), 17 respondents completed the post measurements without the app (condition 2), and 16 respondents completed the post measurements with the app (condition 3). The division of these variables in every condition could be seen in table 3 (this could be seen in Appendix C, 1, 2, 3 and 6 as well). Regarding gender, man was coded as 1, woman was coded as 2, so a mean score of 1.5 meant the distribution of men and women was equal.
Table 3
Distribution of independent variables in three conditions in mean scores (N=49)
Baseline measurement Post-measurement without app
Post-measurement with app
Gender 16 1,81 17 1,82 16 1,87
Age 16 32,13 17 29,82 16 34,25
Internet use 16 2,56 17 2,97 16 2,00
Work experience as a nurse
16 8,84 17 7,88 16 10,78
Work experience current unit
16 5,28 17 4,94 16 6,78
Inter-rater reliability for the problems coding system
Two coders scored the baseline measurement and the post-measurements with the coding system designed to score problems during the solving part, to see what the inter-rater reliability was. For the baseline measurement, Cohen’s kappa was found to be 0,662. For the post-measurements, Cohen’s kappa was 0,701. Both kappa’s showed that there was a substantial agreement between the two raters.
Inter-rater reliability for solutions
The correctness for 51 scenarios was coded by two raters and the remaining 93 were coded by one rater. An inter-rater reliability was calculated. Cohen’s kappa was 0,727, which showed that there was notable agreement between the two raters.
Differences between scenarios
A one-way ANOVA analysis showed that there were significant differences according to correctness for each scenario (p=0,001), so whether the solution was found or not did depend on the scenario (Appendix C, 12). This meant that it could be that the app was supportive in some scenarios, but was not supportive in other scenarios. All information resources (the app included) were more supportive for scenarios 1, 2, 3 and 5 than for other scenarios (mean score >2,5) since nurses found more correct solutions in these scenarios (Appendix C, 13). But since the scenarios were randomly divided among the participants, this could not explain why information resources used during the baseline measurement seemed to be slightly more supportive.
Correct solutions for division into labels
with no significant effect (p=0,822) (Appendix C, 7). This showed that it was a good decision to combine these codes into one category. The codes for the solutions were divided into three categories, negative, neutral and positive (this could be seen in table 1). The labels were numbered for the analyses. 1 meant a negative solution, 2 was a neutral solution and 3 was a positive solution. There was a significant effect (p=0.003) when the baseline measurement and the post-measurement with the app were compared. There were no significant effects when the baseline measurement was compared with the post-measurement without the app (p=0,102) and when the post-measurements were compared with each other (p=0,174).
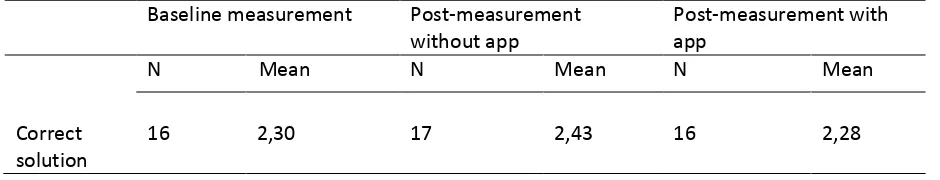
[image:16.595.63.533.433.523.2]Based only on mean scores, it seemed that respondents found less correct solutions during the post-measurement with the app (mean score was 2,28) than during the baseline post-measurement (mean score was 2,30), this was a significant effect. This could be seen in table 4 (as well as in Appendix C, 8, 9 and 10). So nurses found slightly more positive solutions during the baseline measurement than during the post-measurements which suggested that information resources were slightly more supportive to find correct information during the baseline measurement.
Table 4
Solutions divided into labels in mean scores (N=49)
Baseline measurement Post-measurement without app
Post-measurement with app
N Mean N Mean N Mean
Correct solution
16 2,30 17 2,43 16 2,28
Correct solutions without division into labels
The solutions were compared without the division into 3 labels too. There was a significant effect when the baseline measurement was compared to the post-measurement with the app (p=0,023). The mean score for the post-measurement with the app was 4,24, and the mean score for the baseline measurement was 4,06. The codes and their meaning could be found in table 1. The other comparisons were not significant (p>0,250) (this could be seen in Appendix C, 32, 33 and 34). So nurses found more correct or positive solutions during the post-measurement with the app than during the baseline measurement. According to the percentages for every code in every condition, nurses found more correct conclusions with correct information (code 6) during the
post-measurement with the app (only 4,9%), than during the post-post-measurement without the app (6,2%) or the baseline measurement (13,9%). All percentages were shown in table 5 (as well as in Appendix C, 11). So nurses found more correct solutions and asked les frequently for help during the post-measurement with the app than during the baseline post-measurement.
Table 5
Distribution of solutions in every condition (N=144)
Baseline measurement Post-measurement without app
Post-measurement with app
N % N % N %
1: wrong
information, wrong conclusion
3 2,1 5 3,5 5 3,5
2: failed search, wrong/no conclusion
3 2,1 5 3,5 8 5,6
3: (directly) asked for extern help
20 13,9 9 6,2 7 4,9
4: wrong
information, wrong solution
1 0,7 0 0,0 0 0,0
5: correct
information, wrong solution
2 1,4 5 3,5 3 2,1
6: correct
information, correct solution
18 12,5 27 18,8 23 16,0
Correctly solved scenarios
the measurement without the app, 27 scenarios were correctly solved and during the post-measurement with app, 23 scenarios were correctly solved (this could be seen in table 6). So during the post-measurement without app, it seemed that nurses solve more scenarios correctly, but this difference was not significant. It seemed that nurses needed less time to find the correct solution during the post-measurement with the app, but this difference was not significant either.
Table 6
Time needed to correctly solve a scenario (N=68)
Baseline measurement Post-measurement without app
Post-measurement with app
N Mean N Mean N Mean
Time (seconds)
16 211,83 17 207,15 16 121,70
Correctly solved
18 27 23
Problems mentioned while solving and in total
The problems while solving the scenarios were counted, as well as the total problems nurses mentioned during the total interview, to see if the amount of problems differed for the three
conditions. The amount of problems while solving did not differ significantly per condition (p>0,489). According to mean scores, it seemed that nurses experienced less problems while solving during the post-measurement with the app than during the other conditions, but this was not significant (table 7, Appendix C, 36). So nurses did not experience significantly more or less problems with the app. The total problems (problems mentioned during the total measurement, while solving and after solving the scenarios) did differ significantly (p=0,010). This could be seen in Appendix C, 15. There was a significant effect for the total problems when the baseline measurement was compared to the measurement without the app (p=0,042). Nurses mentioned less problems during the post-measurement without the app than during the baseline post-measurement (Appendix C, 16, 17 and 18). There was an almost significant effect between the baseline measurement and the
measurement with the app (p=0,073) and there was no significant difference between the post-measurements (p=0,664). The mean amount of total problems was 9,73 during the baseline measurement and 5,47 during the post-measurement with the app. Because this difference was almost significant, it seemed as if nurses mentioned more problems during the baseline
was 6,53, this difference was significant compared to the baseline measurement. All data could be seen in table 7. So nurses mentioned significantly more problems during the baseline measurement than during the post-measurement without the app, and it seemed that nurses mentioned less problems during the post-measurement with the app too.
Table 7
Total problems mentioned for every condition, mean scores (N=49)
Baseline measurement Post-measurement without app
Post-measurement with app
N Mean N Mean N Mean
Problems while solving
16 3,69 17 3,59 16 2,56
Total problems
16 9,73 17 6,53 16 5,47
Comments about the app and other resources
The total amount of comments about the app was compared to the total amount of comments about other resources. This could be seen in table 8.56,40% of all comments about the app was positive (respondent 38: “The app is clear, and contains all information I need as a nurse”) , compared to 13,63% of all comments about other resources (respondent 38: “This book is very useful because it contains all information you need”). 6,98% of all comments about the app was neutral (respondent 30: “I cannot find the information, but to click for further search is easy”), compared to 7,58% of all comments about other resources (respondent 5: “I search in Google always”). 36,63% of all
comments about the app was negative (respondent 20: “The app does not contain all antibiotics, it is not complete”), against 78,79% of the comments about other resources (respondent 22: “This is not clear for me, it is unstructured and very small”). The quotes were examples of things nurses said during the scenario-based tests and translated from Dutch. The comments about the original resources during the baseline measurement were shown in table 8, as well as the comments in percentages for the post-measurements.
Table 8
Total comments about the app (N=49)
Baseline measurement Post-measurement about other resources
N % N % N %
Positive 23 15,43 18 13,63 97 56,40
Neutral 9 6,04 10 7,58 12 6,98
Negative 117 78,52 104 78.79 63 36,63
The amount of mentioned problems reflected the satisfaction about the situation. During the baseline measurement, nurses seemed to be dissatisfied about their current information resources. This dissatisfaction included a negative understanding, negative search strategies (no clue where they could find the needed information), or problems with the structure (small types, huge texts). Satisfaction about resources included structure (information was structured and therefore could be found more easily), search strategy (it was clear where they needed to search) or the quality of information was high. The fact that the app was incomplete because there were missing some antibiotics was a frequently mentioned problem about the app, even as the understanding of the app (difficult language for example). These examples were not exhaustive, but showed what
(dis)satisfaction could include. During the post-measurements, nurses made more positive comments about the app, which showed that nurses were more satisfied than dissatisfied about the app. The comments about other resources were more negative than positive, which showed that their satisfaction did not changed since the baseline measurement.
Mean time needed to solve a scenario
[image:20.595.67.526.71.185.2]The time respondents needed to solve a scenario was noted in seconds. Since every respondent needed to solve three scenarios, the total of seconds was counted and divided by three to get the mean time a respondent needed to solve a scenario. The mean score for the baseline measurement was 227,86 seconds, which seemed to be higher than the mean scores for the post-measurement without the app (204,96 seconds) and the post-measurement with the app (174,73 seconds). The mean scores were shown in table 9. A one-way ANOVA showed that there was no significant difference between the conditions (p=0,097) for the mean scores of time needed to solve the scenarios. Although there seemed to be a considerable difference based on the mean scores, independent-samples T-tests showed that there were no significant results (Appendix C, 20, 21, 22 and 23).
Table 9
Baseline measurement Post-measurement without app
Post-measurement with app
N Mean N Mean N Mean
Mean time 16 227,86 17 204,96 16 174,73
True time 16 229,00 17 202,96 16 160,33
True time needed to solve a scenario
When the calculations were done without the mean scores (with the true scores), a one-way ANOVA showed that there was a significant difference between the three conditions (p=0,006). The
difference between the baseline measurement and the post-measurement with the app was significant (p=0,030), even as the difference between the baseline measurement and the post-measurement without the app (p=0,014). The difference between the two post-post-measurements was not significant (p=0,887) (this could be seen in Appendix C, 24, 25, 26 and 27). The scores
summarized in table 8 suggested that nurses needed more time to solve the scenarios during the baseline measurement (229 seconds), less time to solve the scenarios during the post-measurement without the app (202,96 seconds) and the least time to solve the scenarios during the
post-measurement with the app (160,33 seconds). So based on the true scores, nurses needed less time to solve a scenario during the post-measurements than during the baseline measurement. Also, it seemed as if nurses were faster during the measurement with the app than during the post-measurement without the app, but this difference was not significant.
Used resources in every condition
[image:21.595.66.526.72.185.2]The total of resources used by one participant was divided by 3 to find the mean amount of used resources for every scenario. A one-way ANOVA showed that there were no significant effects for the conditions (p = 0,141) (Appendix C, 28). When the mean differences were compared, there were no significant effects found between the baseline measurement and the post-measurement without the app (p = 0,127), the post-measurements (p=1.00) and between the baseline measurement and the post-measurement with the app (p=0,183). According to the mean scores, it seemed to be that there were less used resources during the post-measurement with the app (1,56 used resources) than during the baseline measurement (1,96 used resources) but this was not a significant difference. The mean score for the condition without the app was 1,72 used resources (table 10), (this could be seen in Appendix C, 29, 30 and 31).
Used resources for every condition, mean scores (N=49)
Baseline measurement Post-measurement without app
Post-measurement with app
N Mean N Mean N Mean
Used resources
16 1,96 17 1,72 16 1,56
Conclusion
Solving scenarios
With regard to correct solutions, there were no differences between the post-measurement with the app and the post-measurement without the app. There was a significant effect between the baseline measurement and the condition with the app, but this showed that the information resources were slightly more supportive to a correct solution during the baseline measurement. This was against the expectation because the app was supposed to be helpful, but did not led to more correct solutions. When the correctness was not divided into categories, it was shown that nurses asked for external help more frequently during the baseline measurement and the post-measurement without the app, compared to the post-measurement with the app. This suggested that the app was more helpful to find information and led to a reduced ask for help, but nurses found more correct solutions during the baseline measurement. It seemed that nurses needed less time to find the correct solution during the post-measurement with the app, but this was not significant.
Experienced problems
While solving the scenarios, there were no significant differences for the experienced problems. When the total problems were compared (all problems mentioned while solving the scenario and afterwards), there was a significant effect. Nurses mentioned more problems during the baseline measurement than during both post-measurements. Nurses mentioned less problems about the structure of the app during the post-measurement with the app. An explanation could be that nurses experienced less problems during their job because of the app.
Satisfaction
Time needed for solving scenarios
With regard to time needed to solve a scenario, there were significant effects. Nurses needed more time during the baseline measurement than during the post-measurement with the app. This was according to the expectation, it seemed to be that the app contributed to a quicker solution. There was a significant effect for the difference between the baseline measurement and the
post-measurement without the app too. This was against the expectation and could be due to different factors, which were discussed in the discussion. So this showed that nurses needed more time to solve the scenarios during the baseline measurement than during the post-measurements with and without the app.
Used resources
There were no significant effects found for the resources used while solving the scenarios. According to the mean scores, it seemed to be that there were less used resources during the
post-measurement without the app compared to the baseline post-measurement, and the least used resources during the condition with the app, but this difference was not significant. So nurses used about as many resources during all conditions.
Research questions
To answer the research question, it was ambiguous whether the app was supportive regarding the efficiency since nurses did not significantly found more correct solutions. The results regarding support and the amount of experienced problems were not significant but nurses seemed to be more satisfied with the app than with the other resources. Nurses needed less time during the post-measurements to solve the scenarios, but it was not clear whether this was due to the app or to other factors. Based on these results, the conclusion was that the app could be supportive, and nurses seemed to be more satisfied with the app. It was not clear whether the app supported nurses to find the solution in less time, nor whether the app contributed to Antibiotic Stewardship, which meant that further research was needed.
Discussion
The results of this research are inconclusive and should be interpreted with caution. There were less significant effects than was expected, for example for the correct solutions. Nurses found or did not found the correct solution about as often in all conditions. While solving the scenarios, nurses
mentioned that some scenarios were not real, the scenarios included things nurses never would have to do during their job for example. It was hard to find a solution in all conditions because of this, with or without the app, also because respondents had no clue were to search. It could be that there was a different effect when nurses evaluated all scenarios as reel. Another explanation could be that the app was not more helpful to find a correct solution compared to the other resources. This could be due to the fact that the information of the app consisted of information from the other resources. Especially the problem of understanding the information was mentioned a couple of times, and perhaps this could also explain why there were no differences found for this variable.This could explain why there were no significant effect for the amount of used resources too. Also, it could be that the app did not provide clear information, or provided information that suggested that external help was needed. When this was the case, it is obvious that nurses needed more than one resource to find the correct answer, which was equal to the conditions without the app. Also, since it was an antibiotic app, there was no information about other medicines, which was necessary to find the correct solution sometimes. Another explanation could be that the original resources did provide the correct information as well as the antibiotic app, which also could explain why there was no
significant effect found since the app consisted of all resources from the old situation.
There were no paired samples during this research, so it was not possible to search for a learning curve, but external factors like these could explain why there were no significant differences. Another explanation could be that there were nurses who participated during the baseline measurement as well as during the post-measurement. Because they already knew what was expected, since they had participated once before, it could have helped them to find a quicker solution and thus explained why there was a significant effect for the post-measurement without the app too. This could have influenced the results for all dependent variables, but the chance that this would have a huge impact is small since there was a time period of 8 months between the two measurements.
Some other issues were important to consider too: firstly the influence of the changing staff of the hospital by resign or leave for example. There were nurses who started to work after the
introduction of the app, and therefore never heard about the research or the app. Other nurses left after the introduction of the app, so it was hard to tell whether or not all participants had the same experience with the app. The scenario-based tests took place in a less controlled research setting. This connected more to daily practice, but was more difficult to measure. For example not all possible resources were available in the resource setting, sometimes the pager made noise during the interview or another person entered the room and caused an interruption. This was hard to take into account during the processing of the results.
Also almost all scores were computed into mean scores, which could have influenced the results. To prevent this, calculations were done with the mean scores and the true scores to see if there were any differences. When this were (almost) significant differences, the true score was taken since this was a more true reflection of reality.
Based on this research, it was not clear whether the app was supportive or not. This could have many different reasons, but the expectations formulated before remained the same. The app could be supportive for nurses during their normal tasks, since not all scenarios were realistic. A
References
Ayer, E. R. (1994). Critical Care Nurses’ Decision Making in Regard to Critical Incident Stress Debriefing (master’s thesis). The University of British Columbia, Vancouver.
Boyle, D. K. & Kochinda, C. (2004). Enhancing Collaborative Communication of Nurse and Physician Leadership in Two Intensive Care Units. JONA, Vol. 34 (No. 2), pp 60-70).
Fogg, B. J. (2003). Persuasive Technology: Using Computers to Change What We Think and Do. Morgan Kaufmann Publishers, San Francisco.
Kaki, R., Elligsen, M., Walker, S., Simor, A., Palmay, L. & Daneman, N. (2011). Impact of antimicrobial stewardship in critical care: a systematicReview. Journal of Antimicrobial Chemotherapy, Vol 66, pp 1223–1230.
Karreman, J., van Gemert-Pijnen, L., van Limburg, M., Wentzel, J. & Hendrix, R. (2010). Naar verantwoord antibioticagebruik. Retrieved from:
http://www.infectionmanager.com/images/ASP_handboek.pdf
Koch, S. H., Weir, C., Haar, M., Staggers, N., Agutter, J., Görges, M. & Westenskow, D. (2012). Intensive care unit nurses’ information needs and recommendations for integrated displays to improve nurses’ situation awareness. American Medical Information Association.
doi:10.1136/amiajnl-2011-000678.
MacDougall, C., & Polk, R. (2005). Antimicrobial stewardship programs in health care systems: Clinical microbiology reviews. 18(4): p. 638.
Oinas-Kukkonen, H., & Harjumaa, M. (2009). Persuasive Systems Design: Key Issues, Process Model, and System Features. Communications of the Association for Information Systems, Vol. 24, Article 28. Available at: http://aisel.aisnet.org/cais/vol24/iss1/28.
Oinas-Kukkonen, H. (2009). Behavior Change Support Systems: The Next Frontier for Web Science. University of Oulu, Oulu.
Spellberg, B., Powers, J. H., Brass, E. P., Miller, L. G. & Ewards, J. E. (2004). Trends in Antimicrobial Drug Development: Implications for the Future. Antimicrobial Research and Development, Vol 38, pp 1279-1286.
Wentzel, J., & van Gemert-Pijnen, J. E. W. C., (2014). Antibiotic Information App for Nurses. University of Twente, Enschede.
Wentzel, J., van Velsen, L., van Limburg, M., de Jong, N., Karreman, J., Hendrix, R., van Gemert-Pijnen, J. E. (2014). Participatory eHealth development to support nurses in antimicrobial
Stewardship. BMC Medical Informatics and Decision Making, 14:45 doi:10.1186/1472-6947-14-45.
While, A. & Dewsbury, G. (2011). Nursing and information and communication technology
(ICT): A discussion of trends and future directions
. International Journal of Nursing Studies, 48 1302–1310.Yuan, M. J., Finley, G. M., Long, J., Mills, C. & Johnson, R. K. (2013). Evaluation of User Interface and Workflow Design of a Bedside Nursing Clinical Decision Support System. Interactive journal of medical research, vol. 2, (issue 1, e4), pp 1-15.
I.M. Zadvinskis, E. Chipps, P.-Y. Yen, Exploring Nurses’ Confirmed Expectations Regarding Health IT: A Phenomenological Study, International Journal of Medical Informatics (2013),
http://dx.doi.org/10.1016/j.ijmedinf.2013.11.001.
Appendices
Appendices
Appendix A: Coding system
In Dutch: Problemen:
-zoekstrategie: problemen met identificeren van juiste bron, en benaderen(vinden) van die bron -begrip: mis-match tussen taalgebruik van experts en verpleegkundigen, inadequaat vocabulaire bij zoeken
- structuur: problemen bij vinden van specifieke informatie binnen een bron/pagina door gebrek aan structuur
- irreëel scenario: voorgestelde situatie ligt te ver van realistische taken/werkzaamheden - kwaliteit van informatie: incorrecte informatie
-compleetheid van bron(nen): informatie is niet aanwezig in bron, hoewel wel verondersteld, informatie is überhaupt niet in goedgekeurde bronnen beschikbaar
- duidelijkheid: de gevonden informatie is duidelijk en helder Effectiviteit:
- succesvol: scenario is succesvol voltooid
- moeite: kost veel/weinig moeite om de juiste informatie te vinden Efficiëntie:
- acties: aantal acties nodig om het scenario te voltooien Tevredenheid:
- design: aantal uitdrukkingen gerelateerd aan het design - inhoud: aantal uitdrukkingen gerelateerd aan de inhoud - functies: aantal uitdrukkingen gerelateerd aan de functies In English:
Problems:
- search strategy: problems to identify the correct resource, and to approach (find) that resource - understanding: mismatch between language of experts and nurses, inadequate vocabulary while searching
- structure: problems to find the specific information within a resource/page because of a lack of structure
- unrealistic scenario: proposed situation is too far from the realistic tasks/proceedings - quality of information: incorrect information
- completeness of resource(s): the information is not presented in a resource, although this is assumed
- clearness: the information found was clear Effectiveness:
-successful: scenario is successful fulfilled
- effort: it took a lot/less effort to find the correct information Efficiency:
- time: time needed to complete the scenario, search took long or short - actions: the amount of necessary actions to complete the scenario Satisfaction:
- design: amount of expressions related towards the design - content: amount of expressions related towards the content - functions: amount of expressions related towards the functions
Appendix B: Scenarios and solutions (in Dutch)
1. Een COPD patiënt, krijgt Tobramycine, 1xdaags 240mg intraveneus. De patiënt weegt 150kg. Je vraagt je af of deze dosering wel adequaat is voor deze patiënt. Zoek op. *
Nee, dosering is niet adequaat, te laag. (idem bij Gentamycine)
2. Een vrouw, opgenomen met een pseudomonas infectie krijgt 4x400mg/d IV Ciproxin. Deze dosering lijkt aan de hoge kant. Je wilt de arts bellen om te controleren of de dosering wel klopt. Je zoek het eerst zelf na.
Deze dosering is hoger dan de standaarddosering.
3. Een patiënt krijgt voor een thuis opgelopen pneumonie 4 x daags 1200 mg Augmentin. Na 4 dagen iv is patiënt koortsvrij en geef tijdens toediening aan wel naar te huis willen. Hoeveel dagen moet Augmentin iv gegeven worden?*
*Een patiënt krijgt voor een thuis opgelopen pneumonie 4 x daags 1200 mg Augmentin. Bereid de medicatie voor.
Standaarddosering / instructies, te hoog, maar over duur geen info apotheek/arts bellen 4. Tijdens de visite wil de arts bij een van de patiënten met een luchtweginfectie Ciproxin
klopt.
Interactie tussen claritromycine en haldol dus bij arts neerleggen
5. Een patiënt krijgt Erytomycine, IV 3 x daags 250 mg voor activeren van maag-darmkanaal. In verband met andere medicatie die gegeven moet worden wil je de Erytomycine het liefst zo snel mogelijk geven (in laten lopen). Zoek na hoe snel dit middel gegeven kan worden.
30 min (max 500mg per uur)
6. Patiënt, heeft een pneumonie veroorzaakt door pneumococcen, krijgt benzylpenicilline in een continupomp. In verband met een maagbloeding krijgt de patiënt ook een continupomp van esomeprazol. De arts heeft Nexium, 8 mg p/uur voorgeschreven. Ga na of deze combinatie haalbaar is.
Nee, nooit esomeprazol samen toedienen (maar bij penicilline wordt dit niet genoemd!) 7. Een patiënt krijgt Acenocoumerol i.v.m. metatriumfibrilleren. Je ziet de INR toenemen en
vermoedt dat dit komt door de antibiotica (cotrimoxazol 2 x daags 960 mg) die de patiënt ook krijgt. Controleer of dit zou kunnen kloppen.
Acenocoumarol = vit k antagonist, dus inderdaad co-trim can werking versterkenoverleg met arts
8. Patiënt krijgt vanuit huis Theofyline 2x350 mg daags. Wegens een pneumonie is de patiënt opgenomen en krijgt daar 2xdaags 500 mg cipro voor. De patiënt begint te klagen over
misselijkheid en een opgejaagd gevoel. Ga na of deze klachten aan de medicatie kunnen liggen. Inderdaad interactie overleg arts
9. Een patiënt met een pneumonie krijgt 4x1200mg Augmentin. In het rapport van de klinische chemie zie je dat de GFR <20. Controleer of deze dosis past bij de nierfunctie.
Te hoog.
*in de nameting is het scenario aangepast omdat het moeilijk/onmogelijk was de informatie te vinden of omdat het scenario echt niet gepast is.: dus alleen dit scenario in de nameting vergelijken.
Appendix C: tables of statistical analyses 1. Descriptives baseline measurement
Descriptive Statistics
N Minimum Maximum Mean Std. Deviation
Age 49 20 55 32,02 10,213
Years_Unit 49 ,5 23,0 5,653 5,2581
Years_Nurse 49 ,0 38,0 9,143 9,6712
Gender 49 1 2 1,84 ,373
HoursInternet_work_and_pr
ivate 49 ,5 10,0 2,520 1,9737
Valid N (listwise) 49
2: Descriptives post-measurement without the app
N Minimum Maximum Mean Std. Deviation
Age 16 21 54 32,13 11,442
Years_Unit 16 ,5 23,0 5,281 5,7358
Years_Nurse 16 ,0 34,0 8,844 10,3356
Gender 16 1 2 1,81 ,403
HoursInternet_work_and_pr
ivate 16 ,5 10,0 2,563 2,4144
Valid N (listwise) 16
3. Descriptives post-measurement with the app
Descriptive Statistics
N Minimum Maximum Mean Std. Deviation
Age 16 21 51 34,25 10,090
Years_Unit 16 ,5 20,0 6,781 5,7763
Years_Nurse 16 ,5 30,0 10,781 9,5951
Gender 16 1 2 1,87 ,342
HoursInternet_work_and_pr
ivate 16 ,5 5,0 2,000 1,1106
Valid N (listwise) 16
4. One-way ANOVA analysis for group differences
ANOVA
Sum of
Squares
df Mean
Square
F Sig.
Age
Between
Groups 161,759 2 80,880 ,768 ,470
Within Groups 4845,221 46 105,331
Total 5006,980 48
Gender
Between
Groups ,036 2 ,018 ,124 ,884
Within Groups 6,658 46 ,145
Total 6,694 48
Years_Unit
Between
Groups 31,192 2 15,596 ,554 ,579
Within Groups 1295,910 46 28,172
Total 1327,102 48
Years_Nurse
Between
Groups 71,392 2 35,696 ,372 ,692
Within Groups 4418,108 46 96,046
HoursInternet_work_and_private
Between
Groups 7,807 2 3,903 1,002 ,375
Within Groups 179,173 46 3,895
Total 186,980 48
5. Gender division
Gender
Frequency Percent Valid Percent Cumulative
Percent
Valid
male 8 16,0 16,3 16,3
female 41 82,0 83,7 100,0
Total 49 98,0 100,0
Missing System 1 2,0
Total 50 100,0
6. Respondents in every condition
Condition
Frequency Percent Valid Percent Cumulative
Percent
Valid
Baseline measurement 16 32,0 32,7 32,7
Post-measurement without
App
17 34,0 34,7 67,3
Post-measurement with App 16 32,0 32,7 100,0
Total 49 98,0 100,0
Missing System 1 2,0
Total 50 100,0
7. No significance division of code 5 and code 6 at all conditions
ANOVA
Correctness
Sum of Squares df Mean Square F Sig.
Between Groups ,045 2 ,023 ,196 ,822
Within Groups 8,673 75 ,116
Total 8,718 77
Group Statistics
Condition N Mean Std. Deviation Std. Error Mean
Correctness_3_categories
post without app 51 2,4314 ,80635 ,11291
post with app 46 2,2826 ,88602 ,13064
Independent Samples Test
Levene's
Test for
Equality of
Variances
t-test for Equality of Means
F Sig. t df Sig.
(2-tailed ) Mean Differenc e Std. Error Differenc e 95% Confidence
Interval of the
Difference
Lower Upper
Correctness_3_categorie s Equal variance s assumed 1,87 6 ,17 4 ,86
6 95 ,389 ,14876 ,17183 -,1923 5 ,4898 8 Equal variance s not assumed ,86 2 91,42
7 ,391 ,14876 ,17267
-,1942
0 ,4917
3
9. Correctness baseline measurement and post-measurement without the app
Group Statistics
Condition N Mean Std. Deviation Std. Error Mean
Correctness_3_categories
baseline measurement 47 2,2979 ,68888 ,10048
post without app 51 2,4314 ,80635 ,11291
Independent Samples Test
Levene's
Test for
Equality of
Variances
F Sig. t df Sig. (2-tailed ) Mean Differenc e Std. Error Differenc e 95% Confidence
Interval of the
Difference
Lower Upper
Correctness_3_categorie s Equal variance s assumed 2,72 7 ,10 2 -,87 8
96 ,382 -,13350 ,15213 -,4354 7 ,1684 7 Equal variance s not assumed -,88 3 95,47
0 ,379 -,13350 ,15115
-,4335
5 ,1665
5
10. Correctness baseline measurement and post-measurement with app
Group Statistics
Condition N Mean Std. Deviation Std. Error Mean
Correctness_3_categories
baseline measurement 47 2,2979 ,68888 ,10048
post with app 46 2,2826 ,88602 ,13064
Independent Samples Test
Levene's
Test for
Equality of
Variances
t-test for Equality of Means
F Sig. t df Sig.
(2-tailed ) Mean Differenc e Std. Error Differenc e 95% Confidence
Interval of the
Difference
Lower Upper
Correctness_3_categorie s Equal variance s assumed 9,52 0 ,00 3 ,09
3 91 ,926 ,01526 ,16437 -,3112 4 ,3417 7 Equal variance s not assumed ,09 3 84,92
1 ,926 ,01526 ,16481
-,3124
3 ,3429
11. Correctness and condition in percentages
Condition * Correctness Crosstabulation
Correctness Total
1 2 3 4 5 6
Condition
baseline
measurement
Count 3 3 20 1 2 18 47
% of
Total 2,1% 2,1% 13,9% 0,7% 1,4% 12,5% 32,6%
post without app
Count 5 5 9 0 5 27 51
% of
Total
3,5% 3,5% 6,2% 0,0% 3,5% 18,8% 35,4%
post with app
Count 5 8 7 0 3 23 46
% of
Total 3,5% 5,6% 4,9% 0,0% 2,1% 16,0% 31,9%
Total
Count 13 16 36 1 10 68 144
% of
Total 9,0% 11,1% 25,0% 0,7% 6,9% 47,2% 100,0%
12. Significant difference according to correctness for every scenario
ANOVA
Correctness
Sum of Squares df Mean Square F Sig.
Between Groups 88,389 8 11,049 3,728 ,001
Within Groups 400,049 135 2,963
Total 488,438 143
13. Correctness for every scenario
Report
Correctness_3_categories
Scenario Mean N Std. Deviation
1 2,6471 17 ,70189
2 2,8125 16 ,54391
3 2,5333 15 ,83381
4 2,1765 17 ,72761
5 2,5333 15 ,83381
6 1,9375 16 ,77190
7 2,1765 17 ,63593
9 1,8462 13 ,89872
Total 2,3403 144 ,79477
14. Time needed to solve scenario correctly with correct information(code 6)
Report
Time_scenario
Condition Mean N Std. Deviation
baseline measurement 211,8333 18 121,13787
post without app 207,1481 27 88,31312
post with app 121,6957 23 66,30195
Total 179,4853 68 99,64586
15. Significant difference for total problems
ANOVA
Sum of Squares df Mean Square F Sig.
Problems_while_solving
Between Groups 12,507 2 6,254 ,868 ,427
Within Groups 331,493 46 7,206
Total 344,000 48
Problems_total
Between Groups 148,970 2 74,485 5,114 ,010
Within Groups 640,902 44 14,566
Total 789,872 46
16. Total problems baseline measurement and post-measurement without app
Group Statistics
Condition N Mean Std. Deviation Std. Error Mean
Problems_total
1,00 15 9,7333 5,10555 1,31825
2,00 17 6,5294 3,08459 ,74812
Independent Samples Test
Levene's
Test for
Equality of
Variances
F Sig. t df Sig.
(2-tailed)
Mean
Difference
Std. Error
Difference
95% Confidence
Interval of the
Difference
Lower Upper
Problems_total Equal
variances
assumed
4,509 ,042 2,178 30 ,037 3,20392 1,47082 ,20010 6,20774
Equal
variances
not
assumed
2,114 22,434 ,046 3,20392 1,51574 ,06399 6,34385
17. Total problems baseline measurement and post-measurement with app
Group Statistics
Condition N Mean Std. Deviation Std. Error Mean
Problems_total
1,00 15 9,7333 5,10555 1,31825
3,00 15 5,4667 2,97289 ,76760
Independent Samples Test
Levene's
Test for
Equality of
Variances
t-test for Equality of Means
F Sig. t df Sig.
(2-tailed)
Mean
Difference
Std. Error
Difference
95% Confidence
Interval of the
Difference
Lower Upper
Problems_total Equal
variances
assumed
3,460 ,073 2,797 28 ,009 4,26667 1,52545 1,14193 7,39140
Equal
variances
not
assumed
2,797 22,515 ,010 4,26667 1,52545 1,10727 7,42606
18. Total problems post-measurement with and post-measurement without app
Condition N Mean Std. Deviation Std. Error Mean
Problems_total
2,00 17 6,5294 3,08459 ,74812
3,00 15 5,4667 2,97289 ,76760
Independent Samples Test
Levene's
Test for
Equality of
Variances
t-test for Equality of Means
F Sig. t df Sig.
(2-tailed)
Mean
Difference
Std. Error
Difference
95% Confidence
Interval of the
Difference
Lower Upper
Problems_total Equal
variances
assumed
,192 ,664 ,989 30 ,331 1,06275 1,07442
-1,13151 3,25700
Equal
variances
not
assumed
,991 29,745 ,329 1,06275 1,07187
-1,12708 3,25257
19. Mean score for time in every condition
Report
Mean_Time
Condition Mean N Std. Deviation
1,00 227,8750 16 62,74400
2,00 204,9600 17 66,00862
3,00 174,7281 16 75,15600
Total 202,5708 49 70,15430
20. Mean time for baseline measurement and post-measurement without app
Independent Samples Test
Levene's
Test for
Equality of
Variances
F Sig. t df Sig. (2-tailed) Mean Difference Std. Error Difference 95% Confidence
Interval of the
Difference
Lower Upper
Mean_Time Equal
variances
assumed
,000 ,996 1,021 31 ,315 22,91500 22,44879
-22,86960 68,69960
Equal
variances
not
assumed
1,022 30,996 ,315 22,91500 22,41323
-22,79734 68,62734
21. Mean time for baseline measurement and post-measurement with app
Independent Samples Test
Levene's
Test for
Equality of
Variances
t-test for Equality of Means
F Sig. t df Sig.
(2-tailed) Mean Difference Std. Error Difference 95% Confidence
Interval of the
Difference
Lower Upper
Mean_Time Equal
variances
assumed
,792 ,381 2,171 30 ,038 53,14687 24,47605 3,16011 103,13364
Equal
variances
not
assumed
2,171 29,073 ,038 53,14687 24,47605 3,09319 103,20056
22. Mean time post-measurement without and post-measurement with app
Independent Samples Test
Levene's
Test for
Equality of
Variances
F Sig. t df Sig.
(2-tailed)
Mean
Difference
Std. Error
Difference
95% Confidence
Interval of the
Difference
Lower Upper
Mean_Time Equal
variances
assumed
,700 ,409 1,230 31 ,228 30,23188 24,58512
-19,90981 80,37356
Equal
variances
not
assumed
1,225 29,908 ,230 30,23188 24,68458
-20,18729 80,65104
23. No differences for mean time in all conditions
ANOVA
Mean_Time
Sum of Squares df Mean Square F Sig.
Between Groups 22745,314 2 11372,657 2,450 ,097
Within Groups 213492,696 46 4641,146
Total 236238,010 48
24. True time scores, differences between conditions
ANOVA
Time_scenario
Sum of Squares df Mean Square F Sig.
Between Groups 111707,296 2 55853,648 5,249 ,006
Within Groups 1500310,030 141 10640,497
Total 1612017,326 143
26. True time baseline measurement and post-measurement without app
Group Statistics
Condition N Mean Std. Deviation Std. Error Mean
Time_scenario
baseline measurement 47 229,0000 127,05665 18,53312
post without app 51 202,9608 86,47195 12,10850
Levene's
Test for
Equality of
Variances
t-test for Equality of Means
F Sig. t df Sig.
(2-tailed) Mean Difference Std. Error Difference 95% Confidence
Interval of the
Difference
Lower Upper
Time_scenario Equal
variances
assumed
6,234 ,014 1,194 96 ,235 26,03922 21,80550
-17,24437 69,32280
Equal
variances
not
assumed
1,176 80,207 ,243 26,03922 22,13802
-18,01511 70,09354
26. True time baseline measurement and post-measurement with app
Group Statistics
Condition N Mean Std. Deviation Std. Error Mean
Time_scenario
baseline measurement 47 229,0000 127,05665 18,53312
post with app 46 160,3261 92,35729 13,61734
Independent Samples Test
Levene's
Test for
Equality of
Variances
t-test for Equality of Means
F Sig. t df Sig.
(2-tailed) Mean Difference Std. Error Difference 95% Confidence
Interval of the
Difference
Lower Upper
Time_scenario Equal
variances
assumed
4,834 ,030 2,976 91 ,004 68,67391 23,07528 22,83770 114,51012
Equal
variances
not
assumed
27. True time for post-measurement without and post-measurement with app
Group Statistics
Condition N Mean Std. Deviation Std. Error Mean
Time_scenario
post without app 51 202,9608 86,47195 12,10850
post with app 46 160,3261 92,35729 13,61734
Independent Samples Test
Levene's
Test for
Equality of
Variances
t-test for Equality of Means
F Sig. t df Sig.
(2-tailed)
Mean
Difference
Std. Error
Difference
95% Confidence
Interval of the
Difference
Lower Upper
Time_scenario Equal
variances
assumed
,020 ,887 2,348 95 ,021 42,63470 18,15987 6,58280 78,68660
Equal
variances
not
assumed
2,340 92,339 ,021 42,63470 18,22217 6,44566 78,82374
28. ANOVA for resources, no significant differences between conditions
ANOVA
Resources
Sum of Squares df Mean Square F Sig.
Between Groups 1,282 2 ,641 2,045 ,141
Within Groups 14,421 46 ,314
Total 15,703 48
29. Resources for baseline measurement and post-measurement without app
Group Statistics
Condition N Mean Std. Deviation Std. Error Mean
Post-measurement without
App 17 1,7247 ,37773 ,09161
Independent Samples Test
Levene's Test
for Equality of
Variances
t-test for Equality of Means
F Sig. t df Sig.
(2-tailed) Mean Difference Std. Error Difference 95% Confidence
Interval of the
Difference
Lower Upper
Resources Equal
variances
assumed
2,455 ,127 1,124 31 ,270 ,23467 ,20875
-,19108 ,66041
Equal
variances not
assumed
1,103 21,557 ,282 ,23467 ,21278
-,20713 ,67647
30. Resources for baseline measurement and post-measurement with app
Group Statistics
Condition N Mean Std. Deviation Std. Error Mean
Resources
Baseline measurement 16 1,9594 ,76818 ,19204
Post-measurement with App 16 1,5612 ,46810 ,11703
Independent Samples Test
Levene's Test
for Equality of
Variances
t-test for Equality of Means
F Sig. t df Sig.
(2-tailed) Mean Difference Std. Error Difference 95% Confidence
Interval of the
Difference
Lower Upper
Resources Equal
variances
assumed
1,857 ,183 1,770 30 ,087 ,39813 ,22489
Equal
variances not
assumed
1,770 24,790 ,089 ,39813 ,22489
-,06525 ,86150
31. Resources for post-measurement with and without app
Group Statistics
Condition N Mean Std. Deviation Std. Error Mean
Resources
Post-measurement without
App 17 1,7247 ,37773 ,09161
Post-measurement with App 16 1,5612 ,46810 ,11703
Independent Samples Test
Levene's Test
for Equality of
Variances
t-test for Equality of Means
F Sig. t df Sig.
(2-tailed)
Mean
Difference
Std. Error
Difference
95%
Confidence
Interval of the
Difference
Lower Upper
Resources Equal
variances
assumed
,000 1,000 1,107 31 ,277 ,16346 ,14764
-,13766 ,46457
Equal
variances not
assumed
1,100 28,858 ,280 ,16346 ,14862
-,14057 ,46748
32. Significant effect for correction baseline measurement and post-measurement with app
Group Statistics
Condition N Mean Std. Deviation Std. Error Mean
Correction
baseline measurement 47 4,0638 1,69916 ,24785
post with app 46 4,2391 1,97973 ,29189