Bachelorthesis
Laura Thomas│s1474820
Faculty of Behavioral Science
Psychology
Department of Psychology, Health & Technology
Primary Supervisor: Dr. P.M. ten Klooster
Secondary Supervisor: M. Altena, MSc.
12.06.2016
The impact of Personality on
Abstract ... 3
Samenvatting ... 4
Introduction ... 5
Compensatory Health Beliefs (CHBs) ... 6
Influencing Factors ... 8
Personality... 8
Theory of Planned Behavior ... 9
Aim of this study ... 10
Methods ... 12
Participants ... 12
Design & Procedure ... 12
Instruments ... 13
Personality... 13
CHBs ... 14
Alcohol consumption ... 14
Determinants of the TPB ... 15
Data analysis ... 16
Results ... 17
Demographic data ... 17
Scores on sub- scales ... 18
Correlations ... 19
Combination of Personality traits on CHBs ... 23
Discussion ... 23
Significant Results- Hypotheses ... 23
Significant results between other variables ... 24
Differences between gender ... 26
Strengths and Limitations Respondents, Constructs and Analysis ... 27
References ... 31
Appendix ... 37
List of Abbreviations
Abstract
Samenvatting
Introduction
Nowadays, excessive alcohol consumption among young adults forms a major problem of society. It’s early onset is associated with various other short- term risks such as future (illegal) drug use (Vega et. al, 1993), unprotected sexual intercourse resulting in sexually transmitted diseases or pregnancy (Stueve & O’Donnell, 2005), traffic accidents (Hingson & Winter, 2003), or mood disorders (Hawkins et. al, 1992). In addition, long-term risks have been reported stressing later sexual risk taking (Stueve & O’Donnell, 2005), ongoing drug abuse and dependence (Hawkins et. al, 1992) and both psychiatric disorders and diseases like head and neck cancer, liver cancer, breast cancer, colorectal cancer (National Cancer Institute, 2013), cardiovascular disease, Diabetes Mellitus or cirrhosis of the liver (Rehm et. al, 2009). According to the World Health organization (2014), the highest intake of alcohol per capita can be found in the European Union. The German population aged 15 years and above consumes between 10-12.4 litres of pure alcohol per individual per year, and Dutch teens between 7.5 and 9.9 litres. More than 30% of both Dutch and Germans aged 15 to 19 years are engaging in heavy episodic drinking [HED] (WHO, 2014), which is described as consuming more than six standard drinks on one occasion at least once a month. Adolescents aged above 15 in the European region consume more than a quarter (25,7%) of the total alcohol consumed worldwide. Furthermore, various studies have demonstrated unhealthy drinking among college students stressing the overwhelming intake and problem behavior or risks resulting from this behavior (Wechsler et. al, 1994; Werch et. al, 2000). Due to changing gender roles, both males and females are susceptible to the same extent dependent on certain drinking patterns (WHO, 2014). Regarding socioeconomic status, greater economic wealth is associated with a larger amount of alcohol consumption in the general population (Keyes & Hasin, 2008). The National Institute on Alcohol Abuse and Alcoholism (n.d.) defines low risk drinking as to drink not more than fourteen units per week for men and not more than seven units per week for women. One unit is resembled by ten millilitres of pure alcohol. Every amount of alcohol intake above these guidelines is here referred to as unhealthy drinking.
drinking and related problems has not changed in the last decade (Hingson et. al, 2002; Werch et. al, 2000). Research by Benthin et al. (1993) suggests that adolescents engaging in risky behaviors such as alcohol consumption tend to evaluate the risks to be smaller than adolescents not drinking alcohol. Often, they perceive greater benefits than risks because of peer pressure (Benthin et al. 1993). Since alcohol intake does not always result in observable negative consequences (Committee on Substance Abuse, 2001), the risk takers are often not aware of the consequences of their behavior and keep drinking. Furthermore, adolescents often think that alcohol consumption can compensate for being anxious, depressive or lacking social skills (American Academy Of Child & Adolescent Psychiatry, 2016). One theory among others may provide an explanation to why young adults engage in such pleasant, but at the same time, harmful behavior. It is the “Compensatory Health Beliefs” [CHB] model, which will be examined further in the upcoming sections of this paper.
Compensatory Health Beliefs (CHBs)
According to the WHO (2002), public health includes many health- related aspects and risks such as socioeconomic status, addictive substances, physical inactivity or diet-related factors. When taking every point into account, living a completely healthy life may be difficult these days. In order to gain a healthy lifestyle, individual health goals need to be implemented. These goals aim at promoting health and preventing disease. Examples are dieting, exercising or accident prevention (Gollwitzer & Oettingen, 1998). Pursuing these goals requires hard work such as having implementation intentions, self-regulatory processes and motivational factors to change current behavior.
Still, people are often confronted with desirable, yet unhealthy behavior choices in some situations. Given the example of alcohol consumption, a young adult may be well aware of the consequences of consuming alcohol due to the widespread awareness policy, campaigns, and school education, but on the other hand, he keeps being attracted to drinking it. As a result, an inner conflict arises called cognitive dissonance (Festinger, 1957). In the cognitive dissonance model, it is assumed that individuals strive for internal consistency in their everyday lives.
behavior with each other. Practically, there is no change in resisting the risky behavior. Rather, the person attempts to decrease the relevance of the health goal or behavior, thus in not drinking alcohol, in order to justify unhealthy behavior and to prevent cognitive dissonance. As Harmon- Jones (2012) pointed out, dissonance can be reduced by exaggerating the desirability of the outcome. Third, acquiring new information about unhealthy drinking like a study that emphasized the benefits of drinking alcohol, the unhealthy behavior keeps being justified. Aside from that, cognitive dissonance can also be reduced by using so- called “Compensatory Health Beliefs” [CHBs].
CHBs are described as beliefs one holds that negative consequences of unhealthy behavior can be compensated for by performing a healthy behavior (Radtke & Scholz, 2012). Key determinants of the emergence of CHBs include cognitive dissonance, goal self- concordance, implementation intentions and self- efficacy, which refers to the amount of control over a behavior (Rabiau et al., 2006). A low amount of self- efficacy is considered to result in more CHBs, while high self- efficacy relates with less activation of CHBs. When holding CHBs, unhealthy behavior is not withstood. Rather, the person forms compensatory beliefs on how this behavior might be compensated for or be neutralised. For example, one might think that a large amount of alcohol intake last night may be compensated by exercising one hour the following day. Because of that, unhealthy behavior is justified. There are however problems regarding this sort of beliefs. Often, the compensatory behavior, which is ought to neutralize the unhealthy action, is not executed (Knäuper et. al, 2004). Webb and Sheeran (2006) refer to this as the “intention behavior gap”. Moreover, the compensatory behavior may be neglected until the discomfort to perform healthy behavior weakens and the actual compensatory behavior is not performed at all or at least to an unsatisfactory extent (Rabiau et al, 2006). Since CHBs hinder individuals from pursuing health goals, like not drinking more alcohol than recommended, the compensatory behavior is considered only to compensate for some, but not all negative side effects (Rabiau et al, 2006).
Influencing Factors
Personality
Personality can be split up into five major personality traits, the so-called “Big Five”. These are “Extraversion”, “Neuroticism”, “Openness to experience” “Conscientiousness” and “Agreeableness”. All of them can be generalized across culture and language (McCrae & John, 1992).
People scoring high on neuroticism are referred to as emotionally unstable, pessimistic or tense. Most obvious, however, is the fact that people scoring high on neuroticism have little, if any, self- confidence and irrational perfectionist views (Barenbaum, 2003). It may be that these people have too high expectancies of themselves, resulting in failure and low self- efficacy. Although some support against any relationship between neuroticism and CHBs exists (Radtke et al., 2011), this trait seems to theoretically relate positively to CHBs because of missing self- efficacy which is considered to be an important factor in holding CHBs or not (Rabiau et al., 2006). As a result of that, it may be that people scoring high on neuroticism tend to have more CHBs.
Highly conscientious people tend to be well organized and their lives are structured according to plan. De Raad en Doddema- Winsemius (2006) examined “disciplined”, “dutiful” and “careful” as other characteristics to describe this trait. According to existing research, making action plans is associated with less CHBs (Radtke et al., 2012). Moreover, research showed, that conscientiousness correlates negatively with CHBs (Radtke et al., 2011). Bogg and Roberts (2004) suggest that individuals with a low extent of conscientiousness tend to engage in various health- risk behaviors“ such as smoking, unhealthy eating habits, lack of exercise, unprotected sexual intercourse, and dangerous driving habits”, resulting in a higher mortality rate. This means that the higher someone is scoring on conscientiousness, the less CHBs he holds and vice versa.
Roberts et al. (2007) stressed that a combination of neuroticism and conscientiousness results in a “good self-reported health” due to the fact that this group of people holds both negative and positive health beliefs which ought to compensate for each other. Since a participant can score high on one dimension and low on another, the two traits are combined to get a better grasp of the variety of personality traits.
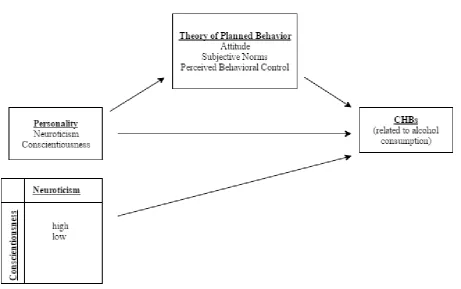
In order to actually reduce CHBs, it is assumed that not only personality has direct effects on CHBs, but also the overall intention to perform healthy behaviors or not. One theory describing the intention to engage in a behavior with three determinants is the so-called “Theory of Planned Behavior” [TPB], which was first established by Icek Ajzen in 1985 as a continuation of Icek Fishbein’s “Theory of Reasoned Action”. Ajzen (1991) describes the TPB as a cognitive self- regulation mechanism, which is used to predict behavior. According to Ajzen (1991), three determinants are involved in forming an intention to behavior. In recent literature, these are referred to as attitude, Subjective norms [SN] and Perceived Behavioral Control [PBC] (Fitzpatrick & McCarthy, 2014).
Theory of Planned Behavior
According to Conner et al. (2006), attitude, SN and PBC were predictors of intention to engage in unhealthy drinking. Furthermore, past drinking behavior in relation with intentions is a predictor of future drinking patterns, thus engaging in an unhealthy behavior again and again. Attitude is described as “beliefs that people hold about the object of the attitude” (in this case: alcohol consumption) (Fishbein & Ajzen, 1975). In other words, people form beliefs about certain objects by associating them with several attributes, thereby evaluating it on an emotional, cognitive and behavioral level (Maio and Haddock, 2010). The behavior that is valued most positive is likely to be performed by the person itself. If a person values fairness, it is likely to be fair or striving for fairness itself; according to the consequences this behavior has. If the given behavior has more undesirable consequences than desirable ones, the behavior is not likely to be implemented. The same holds for cognitive dissonance and the thereof resulting CHBs as described above.
The behavioral determinant SN deals with the social pressure or group conformity on an individual to perform or not to perform a certain behavior (Ajzen, 1991). SN can be of descriptive or injunctive nature. Descriptive norms describe the perceived prevalence of the given behavior, whereas injunctive norms refer to the perception of others engaging in that particular behavior (Neighbors et al., 2007). There is no consensus about whether SN have an influence on alcohol consumption, because other literature suggests that SN are the best predictor concerning heavy alcohol consumption among college students (Neighbors et al., 2007), while other literature does not (Carey & Collins, 2007).
both deal with the control over the achievement of a particular behavior. Another important aspect is that the individual must have the opportunities and resources at hand to be able to engage in the intended behavior (Ajzen, 1985). With self- efficacy being one of the key determinants of the emergence of CHBs (Rabiau et al., 2006), PBC and CHBs may relate to each other as well.
Aim of this study
To examine the different relationships, the following research question is formulated and divided into seven sub questions:
In which way does the Theory of Planned Behavior play a role in the relationship between Personality and CHBs?
1. Does “Neuroticism” have a positive influence on CHBs?
2. Does “Conscientiousness” have a negative influence effect on CHBs?
3. Do a high amount of both Conscientiousness and Neuroticism in combination have a negative influence on CHBs?
4. Does the “Attitude” towards alcohol consumption mediate the relationship between personality and CHBs?
5. Do “Subjective Norms” towards alcohol consumption mediate the relationship between personality and CHBs?
[image:11.595.71.533.440.729.2]6. Does “Perceived Behavioral Control” of alcohol consumption mediate the relationship between personality and CHBs?
Methods
Participants
In total, 274 participants started filling in a questionnaire between 1st of April and 17th April 2016, of which 57 participants stopped had relevant answers missing. Because of these missing values, they were removed from the dataset. 216 completed questionnaires were used for further analysis. The only inclusion criterion was that participants had to be young adults between 18 and 30 years. The participants were gathered via convenience sampling. Therefore, the most accessible persons out of the researchers’ social environments were asked to fill in the questionnaire and were collected in several ways. The first was a link to the questionnaire, which was posted on Facebook. Further, private messages via Whatsapp or Facebook were sent to invite possible participants directly to take part in the questionnaire. 108 participants filled in the questionnaire by means of the link of Facebook and private messaging, while another 108 participants were recruited via “Sona Systems”. “Sona Systems” is an online network used by the University of Twente for students who want to take part in studies or to put their own ones online. With this study, students were granted 0.25 points of 15 required ones.
Design & Procedure
A cross sectional survey design was used. Data was thus obtained from a population at a specific point of time only once. The questionnaire was in English, so that both Dutch and German nationalities could participate. Two researchers measuring different constructs used the questionnaire by combining five psychological scales into one online survey. Three standardized scales and one self developed scale were used to measure the different constructs. The constructs were CHBs, alcohol consumption, personality and the intention to consume alcohol measured by the three determinants of the TPB. CHBs are the extent to which people think that performing unhealthy behavior can be compensated for by performing a healthy behavior later. Alcohol consumption is assessed with questions about drinking frequency and quantity. The construct of personality was operationalized with items out of a Big Five personality test. Only the items that measured conscientiousness and neuroticism were used. Further, the intention to engage in unhealthy behavior was measured with three underlying sub constructs, namely “attitude”, “SN” and “PBC” towards performing a behavior.
of BMS of the University of Twente approved the study. The first page of the online questionnaire presented an informed consent containing information about instructions, an introduction and the ensured privacy the participant is granted. The next page showed various questions about demographical data, such as sex, age, nationality and educational level. Then, the questionnaires about personality, CHBs and items about the intention to engage in a behavior were presented. Filling in the questionnaire took about 15 minutes.
Instruments
The questionnaire was administered via an online survey service called “Qualtrics”, which can be assessed with any device with an internet connection. The questionnaire consisted of four sections: a part of the Big Five Inventory [BFI] (seventeen items), the Compensatory Health Belief Scale and added items (twenty-one items), five items related to alcohol consumption, items related to the TPB (nine items) and seven items about demographical data. All in all, the survey consisted of sixty- three items in total.
Personality
To measure the personality traits conscientiousness and neuroticism, the Big Five Inventory was used [BFI]. The BFI originally consists of 44 items and was first developed by John, Donahue and Kentle in 1991 to measure personality. The sub- scales of conscientiousness and neuroticism were used respectively with a 5-point Likert scale (1= disagree strongly to 5= agree strongly). There are seven items that measure neuroticism and nine items for conscientiousness. The items are short and can be understood easily if sufficient command of English is available (e.g. “I see myself as someone who does things efficiently”). Because there are no general rules on how to score the BFI, only the means of both sub- scales were calculated and compared to an American sample separated by age (Srivastava et al., 2003).
after the second construct. This indicates that both the neuroticism and conscientiousness scale measure two constructs as intended. In order to score the sub- scales, three items of the neuroticism scale and four items of the conscientiousness scale had to be reverse scored. Thereafter, the items of each scale were added and divided by the number of items, resulting in two variables representing the mean scores respectively.
CHBs
In order to assess the extent to which young adolescents hold compensatory beliefs concerning their alcohol consumption and compensatory behavior in general (e.g. “Eating healthy can make up for the effects of regularly drinking alcohol.”), the Compensatory Health Belief Scale was used. This scale was developed by Knäuper, Rabiau Cohen and Patriciu in 2013 and consists of seventeen items. Four items were added for this study concerning physical activity and one measuring the amount of sleep to compensate for alcohol consumption (e.g. “Being physically active can compensate for the effects of regularly drinking alcohol”). As such, there were seven items measuring CHBs in relation to alcohol consumption. The beliefs were measured with a five- point Likert scale as well, ranging from “totally disagree” (=1) to “totally agree” (=5). A participant who scored high on this scale holds many CHBs regarding various unhealthy behaviors, whereas a low score indicated that he does not hold any of these beliefs. The reliability according to Cronbach’s Alpha was α= 0.79 for the whole scale, while α for the alcohol related CHBs was α= 0.80. The new variables from general and alcohol- specific CHBs were built by adding all items or alcohol- related ones and dividing them by the number of items.
Alcohol consumption
and set in two new variables to get a total score of drinking patterns on week- and weekend days.
Determinants of the TPB
The three determinants of the TPB were measured with help of existing items found in the literature, which were adjusted regarding to drinking behavior. The AIM (Alcohol in Moderation, 2016) compared recommendations for “minimum risk” alcohol consumption in over 50 world regions. Overall, there is no consensus about “healthy” drinking behavior. Germany recommends to drink not more than one unit (ten grams of alcohol) per day, while the Netherlands recommend drinking twelve grams of alcohol per day at maximum. Japan for example even suggests to drink maximally two units per day (19.75 grams of alcohol). Because of these differences, the low drinking recommendations of the United States were taken into account and adjusted to the target group. As stated above, these guidelines state not to drink more than seven units for women and fourteen units for men per week. These guidelines were adjusted to the sample consisting mainly of students. Therefore, it was suggested to drink not more than twenty- one units per week for men and women not more than fourteen. This information was presented right above the questions to give the participant an idea of the guidelines of what is referred to as unhealthy drinking.
This scale was split up into the three components of the TPB: attitude, SN and PBC. The items were formulated according to examples by Ajzen (2002). attitude consisted of five statements, for example “For me to drink not more than fourteen (female)/twenty- one (male) units of alcohol at once in a week during the next six months would be…” (1= harmful; 5= beneficial). SN were measured with two items (r= 0.170, n= 216; p= 0.012) for example “The people in my life whose opinion I value would disapprove of me drinking not more than fourteen (female)/ twenty- one (male) units at once in a week within the next six months.” (1=strongly disagree; 7= strongly agree). PBC was also assessed with two items (r= 0.351; n=216; p= <0.001); one of them stated “If I wanted to I could drink not more than fourteen (female)/ twenty- one (male) units in a single session at once in a week in the next six months would be…” (1= very difficult; 7= very easy).
of the total variance. The sub- scales were scored by taking the sum of each scale and dividing it with the number of items building an average score of the sub- scales.
Data analysis
For the statistical analysis of the collected data SPSS 23 was used. The given demographical information about the participants was analyzed regarding N (total amount of respondents), means and standard deviations to get an overall impression of the population that filled in the questionnaire. For each score of the sub- scales, the number of participants, standard deviations, score range and means were determined. The effect of personality on CHBs may be mediated by the determinants of the TPB, though the independent variable (personality) has still an effect on the dependent variable (CHBs). Therefore, the total scores on the sub- scales of conscientiousness, neuroticism, CHBs concerning alcohol, general CHBs, attitude, SN, PBC and alcohol consumption on both week- and weekend days were used for bivariate pearson correlations to get an overview of significant correlations between the variables of interest. Correlations were examined among the whole sample and for males and females separately to determine possible gender differences.
According to the Baron and Kenny method of assing mediation (1986), which consists of four steps to identify a mediation, a single regression analysis between personality and CHBs has to be performed first. Second, a simple regression analysis between personality and the TPB is employed to test if the causal variable is correlated with the mediator. Thereafter, the third path, namely the effect of the TPB on CHBs is tested again with a regression analysis from both the TPB on CHBs and from CHBs to personality to control the independent variable. Fourth, a multiple regression analysis is employed for all three variables to see whether the TPB completely mediates the relationship between personality and CHBs.
For all results holds that how closer the R- value, the correlation coefficient thus, is to one, the stronger that relationship was. Negative correlations indicate a reversed relationship, while positive correlations point to a positive one. All correlations were considered statistical significantly, when they had a significance level of 0.05.
and general CHBs with an independent samples t- test and a Levene’s test was added to check for homogeneity of the two groups. Since the independent samples t- test is not robust against measurement errors due to a skewed distribution, an univariate ANOVA test was employed as well in order to compare the differences between means of groups, that will say participants scoring high or low on both personality traits.
Results
Demographic data
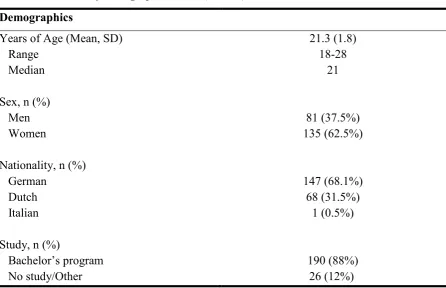
[image:17.595.77.524.464.752.2]The mean age of the participants was 21.3 years. Eighty- one out of the 217 participants were male (37.5%), whereas 135 participants were female (62.5%). 147 participants had a German nationality and 68 were Dutch, which corresponds with 68.1% and 31.5% of the whole sample. 190 (88%) participants were following a bachelor’s programme during the data collection, while 26 (12%) did not study or followed another educational programme. There is a wide range of age according to the inclusion criterion. However, there is little variety regarding the educational level. Table 1 gives an overall impression of the demographical data.
Table 1. Overview of demographical data (n= 216)
Demographics
Years of Age (Mean, SD) Range
Median
21.3 (1.8) 18-28
21 Sex, n (%)
Men Women
81 (37.5%) 135 (62.5%) Nationality, n (%)
German Dutch Italian
147 (68.1%) 68 (31.5%)
1 (0.5%) Study, n (%)
Bachelor’s program No study/Other
Scores on sub- scales
Table 2 shows the mean scores on the sub- scales of the population, minimum and maximum scores and standard deviations. The scales measuring personality ranged both from minus two (=disagree strongly) to plus two (agree strongly). The mean for conscientiousness was M= 3.5 (SD= 0.59), whereas the mean for neuroticism was M= 2.9 with a standard deviation of SD= 0.59. Since the mean age of the sample was 21.3 years with a standard deviation of SD=1.8, the normative mean scores were taken for participants aged 22 years old. These were M=3.50 for conscientiousness and M=3.30 for neuroticism. This implies that the participants in this study were slightly less neurotic than average and just as conscientious as the normative score suggests.
The three determinants of the TPB had a range of answer options from minus three (=extremely unlikely) to plus three (extremely likely). The average scores on the sub- scales were M= 5.0 for attitude, M= 4.6 for SN and M= 5.7 for PBC. For all determinants holds a minimum score of 1 and a maximum score of 7. Standard deviations were SD= 1.48 for attitude, SD= 1.23 for SN and SD= 1.45 for PBC.
Alcohol consumption on week- and weekend days was assessed with a range of answer options from zero to 11 and zero to 20. These options had to be multiplied with the number of days, thus three weekend days and four weekdays. This resulted in a maximum of 44 units on weekdays and a maximum of 60 units per weekend. The participants drank M= 7.73 units on a weekday on which they drank on average with a standard deviation of SD= 17.15 and M= 6.04 units with a standard deviation of SD= 13.28 on weekend days per day on average. Because of the high standard deviation, the scores were not distributed close to the mean value. This means, that the participants gave very different answers to their alcohol consumption.
Table 2.
Descriptive Statistics of the sub- scales
Range Mean Minimum Maximum SD
Neuroticism -2/+2 2.9 1 4.75 0.70
Conscientiousness -2/+2 3.5 1.67 4.89 0.59
Attitude -3/+3 5.0 1 7 1.48
SN -3/+3 4.6 1 7 1.23
PBC -3/+3 5.7 1 7 1.45
General CHBs -2/+2 2.5 1.38 4.19 0.46
Alcohol CHBs -2/+2 2.2 1 4 0.71
Alcohol weekday* 0/44 7.73 0 11 17.15
Alcohol weekend* 0/60 6.04 0 20 13.28
*: units per weekday (four days) or weekend day (three days)
Correlations
A bivariate Pearson’s correlation analysis was conducted on the scores of the sub- scales. The correlations have to be interpreted in both directions. The results are presented in table 3.
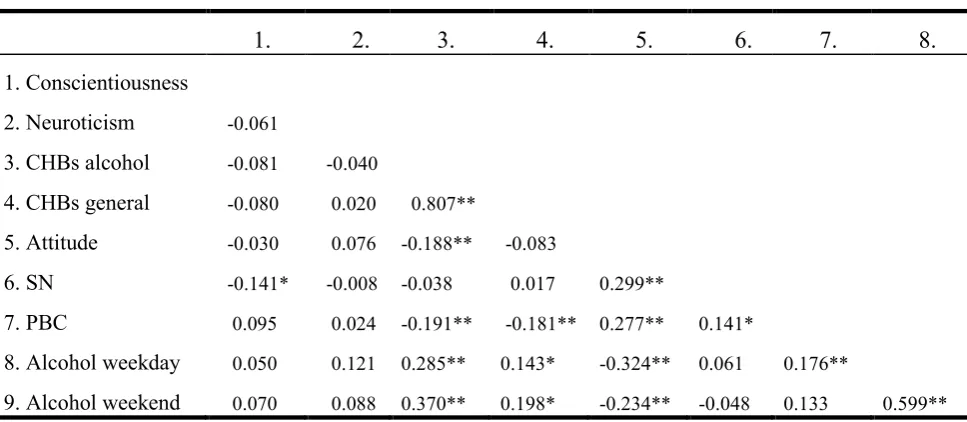
Table 3.
Bivariate Correlation results of total scores of sub- scales among whole sample (n= 216)
1. 2. 3. 4. 5. 6. 7. 8.
1. Conscientiousness
2. Neuroticism -0.061
3. CHBs alcohol -0.081 -0.040
4. CHBs general -0.080 0.020 0.807**
5. Attitude -0.030 0.076 -0.188** -0.083
6. SN -0.141* -0.008 -0.038 0.017 0.299**
7. PBC 0.095 0.024 -0.191** -0.181** 0.277** 0.141*
8. Alcohol weekday 0.050 0.121 0.285** 0.143* -0.324** 0.061 0.176**
9. Alcohol weekend 0.070 0.088 0.370** 0.198* -0.234** -0.048 0.133 0.599**
[image:19.595.74.558.520.731.2]Table 3 shows that personality does not correlate with either kind of CHBs (r= -0.081; p= 0.237 for conscientiousness and r= -0.40; p= 0.554 for neuroticism on alcohol- specific CHBs, while r= -0.080; p= 0.241 for conscientiousness and r= 0.020; p= 0.766 for neuroticism on general CHBs). Since there is no influence of the independent variable (personality) on the dependent one (CHBs) and vice versa. Therefore, conducting a mediation analysis is redundant in this study.
All constructs that were measured with different sub- scales correlate with each other significantly. This means, that participants who pay lots of attention to one determinant of the TPB also tend to perceive the other ones to a greater extent. Furthermore, drinking patterns on weekdays also imply drinking patterns on weekend days and those holding general CHBs are also likely to hold alcohol- specific CHBs.
Regarding the correlations of the TPB with personality, only conscientiousness correlates significantly with SN with r= -0.141; p= 0.038. Participants having a high amount of conscientiousness perceive thus less SN or participants, which are not conscientious, perceive more SN. The alcohol specific and general CHBs correlate negatively with PBC with r= -0.181; p= 0.008. For these results holds, that the more CHBs someone perceives, the lesser they perceive control over their behavior or vice versa.
The sub- scales of alcohol consumption on week- and weekend days correlate with both types of CHBs. Weekday alcohol consumption correlates with alcohol- specific CHBs with r= 0.285; p= <0.001 and general CHBs with r= 0.143; p= 0.035. Weekend day alcohol consumption correlates with alcohol- specific CHBs with r= 0.370; p= <0.001, whereas with general CHBs with r= 0.198; p= 0.003. This suggests that the more CHBs a participant holds, the higher is his or her alcohol consumption on week- and weekend days or vice versa.
consumption and CHBs, the correlations were split between males and females to determine a possible difference among sex. The outcomes are presented in table 3 and 4.
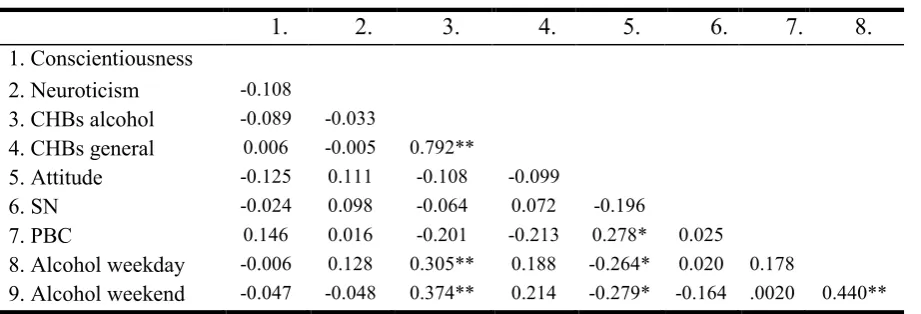
Table 4.
Bivariate Correlations of total scores of sub- scales among males (n=81)
1. 2. 3. 4. 5. 6. 7. 8.
1. Conscientiousness
2. Neuroticism -0.108
3. CHBs alcohol -0.089 -0.033
4. CHBs general 0.006 -0.005 0.792**
5. Attitude -0.125 0.111 -0.108 -0.099
6. SN -0.024 0.098 -0.064 0.072 -0.196
7. PBC 0.146 0.016 -0.201 -0.213 0.278* 0.025
8. Alcohol weekday -0.006 0.128 0.305** 0.188 -0.264* 0.020 0.178
9. Alcohol weekend -0.047 -0.048 0.374** 0.214 -0.279* -0.164 .0020 0.440**
*: p<0.05 (two- sided); **: p<0.01 (two-sided)
Table 5.
Bivariate Correlations of total scores of sub- scales among females (n=135)
1. 2. 3. 4. 5. 6. 7. 8.
1.Conscientiousness
2. Neuroticism -0.095
3. CHBs alcohol -0.035 0.025
4. CHBs general -0.108 0.063 0.821**
5. Attitude -0.044 -0.080 0.239** 0.074
6. SN -0.001 0.250** -0.132 -0.121 0.221**
7. PBC 0.041 -0.013 -0.153 -0.148 0.206* -0.076
8. Alcohol weekday 0.028 0.039 0.214* 0.091 -0.400** 0.079 0.138
9. Alcohol weekend 0.071 0.060 0.315** 0.167 -0.239** 0.004 0.161 0.580**
*: p<0.05 (two- sided); **: p<0.01 (two-sided)
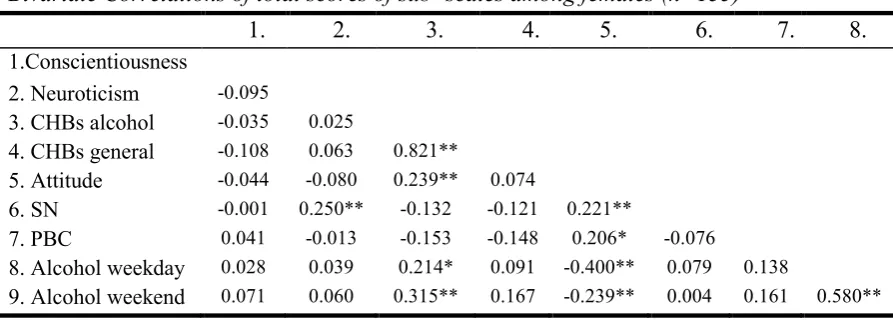
When it comes to the correlations of the scores of the sub- scales among female respondents only, there are both commonalities and differences between genders, while commonalities are described first. The CHB scales correlate with each other positively (r= 0.821; p= <0.001) and the alcohol consumption on week- and weekend days with r= 0.580; p= <0.001. This means that participants holding general CHBs also tend to hold alcohol- specific CHBs and those drinking alcohol on weekdays are likely to drink alcohol on weekend days and vice versa as well. Further, attitude correlates with PBC with r= 0.221; p= 0.010. This means that the more positive a participant’s attitude towards alcohol consumption, the more he or she perceives PBC. Also, alcohol consumption on week- and weekend days correlates positively with alcohol- specific CHBs with r=0.214; p= 0.013 and r= 0.315; p= <0.001. This means, that the more alcohol a participant consumes either on weekdays or weekend days or both, he or she also tends to hold alcohol- specific CHBs. Attitude correlates negatively with both alcohol consumption on weekdays and weekend days as well with r = -0.400; p= <0.001 and r= -0.239; p= 0.005. The more a participant consumes alcohol on weekdays or weekend days or both, the smaller is thus his or her perception of attitude or vice versa.
Combination of Personality traits on CHBs
To determine whether participants scoring high on both personality dimensions held more CHBs, new variables were built with a median split. The two independent samples t- tests for alcohol specific CHBs on both personality traits resulted in t(96)= 0.156; p= 0.225 and t(96)= -0.196 ; p= 0.200 for general CHBs. Levene’s test of equality of variance for alcohol- specific CHBs showed F= 1.489; p= 0.225 and F= 1.662; p= 0.200 on general CHBs.
A univariate ANOVA test was employed to look for the variance between all four groups. Analysis of the general CHBs resulted in F(2;213)= 0.300; p= 0.741 and F(2;213)= 0.360; p= 0.698. Considering these results, participants scoring high on both neuroticism and conscientiousness do not differ in the amount of general and alcohol- specific CHBs.
Discussion
Aim of this study was to find out whether personality influences alcohol- specific and general CHBs and whether the TPB might have a mediating role in this relation. Taken all results into account, there are none of the formulated hypotheses could be confirmed. This means that there is no relationship between personality and CHBs and only one correlation between personality and a construct from the TPB. Therefore, it is concluded that there is no direct effect of personality and no mediational effect of the TPB either. However, other interesting associations were found that were not expected as such and are reported in the next sections.
Significant Results- Hypotheses
different unhealthy behaviors (Radtke & Scholz, 2012).
Hypothesis three had to be rejected as well, which stated that respondents scoring high on neuroticism and conscientiousness hold only few CHBs. Overall, personality did not correlate in any way with both kinds of CHBs. Moreover, the two personality traits were not related to the TPB nor alcohol consumption. Again, this supports the suggestions above that personality has to be defined more precisely according to its facets.
Regarding hypotheses four, five and six, mediation analyses were not conducted because of the missing associations between personality (independent variable) and CHBs (dependent variable). Therefore, all three hypotheses regarding the TPB had to be rejected as well. It might be that there is no mediating effect of the TPB on both personality on CHBs and personality, because all concepts are not well defined in the questionnaire. As stated above, personality has to be measured concerning its facets. The same holds for the TPB. There might be underlying constructs which lay out of the scope of the TPB. For example, SN depend not only on other persons having an influence on the participant, but more unobtrusive aspects like culture or SES. Because of that, all constructs have to be more precisely defined in further research, resulting in a longer questionnaire.
In sum, all hypotheses had to be rejected. Although there was no support for hypotheses one and two stating that personality has an influence on CHBs, several significant relationships between personality and the TPB, alcohol consumption and both CHBs and the TPB and the TPB and CHBs were found, which describe the importance of CHBs regarding intentions and alcohol consumption. Other suggestions for further research and strengths and limitations of this study concerning the findings can be obtained from the next sections.
Significant results between other variables
extent- in social group processes and appreciate the idea of making their own choices.
Furthermore, respondents having more general CHBs also tended to have more alcohol- specific CHBs. Since there are several unhealthy behaviors (for example exercising or dieting) in which different types of CHBs are applied (Radtke & Scholz, 2012), holding CHBs on one unhealthy behavior logically predicts holding CHBs on other domains because they tend to cluster those unhealthy behaviors. The same holds for the TPB and alcohol consumption: Those scoring high on attitude also perceive PBC and SN and those consuming alcohol on weekdays also tend to consume alcohol on weekend days. These results go in accordance with the TPB model described above, which is a predictor of intention to engage in a certain behavior (thus, alcohol consumption).
Those holding higher alcohol- specific and general CHBs also tend to perceive little PBC. This corresponds with people having a high amount of self- efficacy tend to hold less CHBs than those who have little self- efficacy (Rabiau et al., 2006). Because the construct of self- efficacy is very similar to that of PBC, it can be suspected that those who do not perceive to have the control or ability to achieve certain health goals hold more CHBs than those who do so.
The more alcohol respondents consume, the more alcohol- specific and general CHBs they hold. This may be due to cognitive dissonance as well as unhealthy behavior may be justified by holding CHBs (Rabiau, 2006). The dissonance arising when a participant knows about the negative consequences his behavior has, he may employ CHBs to gain cognitive consistency again. Respondents having a positive attitude towards alcohol consumption tended to hold less alcohol- specific CHBs. This may be explained in terms of handling cognitive dissonance as well. Participants holding a positive view of alcohol consumption may whitewash their views about negative consequences that they even do not hold CHBs to compensate their unhealthy behavior.
consume alcohol, but being aware of its consequences: Either to restrain from drinking alcohol, weighing the pros and cons of drinking alcohol against each other, receiving new information that justifies alcohol consumption or a new fourth strategy, namely by employing CHBs. Besides, a good illustration of this may be that alcohol advertisement triggers young adolescents to start drinking or increase drinking patterns (Anderson et al., 2009). Because of that, young people get in conflict with on the one hand knowing what alcohol carries for consequences, on the other hand being attracted to drink it because of alcohol presented in a positive fashion by the alcohol industry. Participants consuming alcohol on week- and weekend days or on one of both tend to perceive more PBC as well. Since all three determinants of the TPB are perceptions, these are purely subjective. Participants may tend to overestimate their control over the extent to which they consume alcohol, because they are mostly not familiar with long- term risks as mentioned above.
Differences between gender
Comparing the results of males and females, they have some correlations in common: A strong relationship was found between the two kinds of CHBs. Both males and females having more general CHBs also have more alcohol- specific CHBs. As described above, participants holding CHBs tend to cluster among other kinds of CHBs. The same holds for drinking alcohol on week- and weekend days. Participants holding alcohol- specific CHBs also tend to drink more on week- and weekend days as expected. This may be due to the cognitive dissonance participants perceive when they engage in a pleasurable, yet unhealthy behavior. To reduce their cognitive dissonance, CHBs are employed. Since perceiving a more positive attitude towards alcohol consumption indicates more PBC, the long- term risks of alcohol consumption may be simply underestimated (Harrison & Fillmore, 2005). Moreover, both males and females consuming more alcohol on week- and weekend days or one of them have a more negative attitude towards alcohol consumption. This may be because although they are aware of the negative consequences of drinking alcohol they are still attracted to it, thereby activating CHBs (Rabiau et al., 2006).
conform to groups. Previous research suggests that women score higher than men do on neuroticism. They tend to report more anxiety and less self- esteem, while males score higher on anger and hostility (Weisberg et al., 2011). This implies that men and women are likely to express their personality in a different way. Though both sexes could score high on one dimension, this does not suggest that they utter it in the same behavior.
Further, females holding more alcohol- specific CHBs also had a more positive view about alcohol consumption. This result was not expected as such, since men engage in more risky drinking behavior than women (Hoeksema, 2004). Because women are reported to be more carefully (Balbissi, 2003), they may not take negative consequences of alcohol intake into account. The alcohol- specific CHBs were even more strongly related to alcohol consumption on weekend days than attitude. Again, the construct of cognitive dissonance could be held accountable for this result, because women may use CHBs in order to justify their unhealthy drinking patterns. Therefore, they may not have a negative view about alcohol consumption because they believe they can compensate for the negative side- effects as well. Previous research also showed, that women do focus more on the expected positive outcomes on drinking alcohol (Guise &Gill, 2007). Men on the other hand having a negative attitude toward alcohol consumption but still keep being attracted to drinking it.
Third, females holding a more positive view towards alcohol consumption are also more likely to perceive more SN. Women have in general a more positive attitude toward drinking alcohol than men, because men are more focussed on masculinity concerns and perceived pressure to drink alcohol (de Visser & McDonnell, 2013). It was thus not expected, that women also tend to take SN into account. All in all, further research needs to be implemented on gender differences and alcohol consumption, but especially in relation to why there are gender differences concerning the emergence of CHBs.
Strengths and Limitations
quite high (n=216), it only resembles largely a population of Psychology students. A suggestion for further research may be a broader sample concerning SES and age.
Since the studies of Psychology and Communication Science have several study subjects in common, it is possible that both have the same knowledge about the structure of online studies because all of them got in touch with them in their studies. Many of them may have been able to imagine what the study is about or were able to imagine, so they simply tried to answer the questions according to the research questions. Possibly, there is a selection bias in the whole sample, because it was gathered too unilaterally. Some of them also consulted the researchers of this study that they had worries about their privacy since the questionnaire contained sensitive questions concerning the participant’s weekly alcohol intake. It might be that those respondents answered according to social desirability because they felt monitored. The opposite could also be the case. This means that respondents answered the questions not seriously and did not read the questions well. Controlling the dataset for missing values and deleting them, also not seriously formulated nationalities or ages were found as well. Additionally, half of the respondents (n=108) participated via Sona Systems. It is possible that they answered the questions without reading just to get the offered points for filling in the survey. Their motivation was thus of extrinsic nature (Ryan & Deci. 2000). McDonald (2008) described possible shortcomings of self- administered personality questionnaires, which must be taken into account as well. First, participants are often distorted in how they perceive themselves. This may utter itself with self-enhancing answers. Moreover, she describes a lack of self- knowledge of the participants to answer the questions credibly. This comes, because the participants often did not bother themselves before with questions about their personality or their intention to consume alcohol. This again implies that both personality and TPB are complex constructs which should be measured in smaller entities to give the participant a more obvious impression about the measured constructs.
Regarding conscientiousness and neuroticism, it might be that the Big Five personality dimensions are too simple to describe an abstract construct as personality. There are various sub- constructs, which have to be taken into account. Besides, the median- split may not have been the best- fitting way to determine whether a respondent is scoring high or low on one dimension because the sample mainly consists of Psychology students which may answered according to or against the research hypotheses. Moreover, it is very difficult to measure personality in a precise and reliable way at all. Although the Big- Five trait taxonomy serves as an integrative function to represent personality in a common framework (John & Srivastava, 1999), the different facets of the Big Five like self- efficacy or self- discipline for conscientiousness are not assessed with the BFI. The Substance Use Risk Profile Scale (Woicick et al., 2009) for example focuses on various personality facets concerning substance abuse, such as hopelessness, anxiety, sensitivity, impulsivity and sensation seeking. Therefore, it might be convenient for further research to focus on lower- level facets of the Big Five in relation to CHBs, because no influence of personality on CHBs could be reported in this study.
should be excluded from future studies or should be treated separately.
There might be third variables, which are not taken into account as well. Considering (psychological) health status or mood during filling in the questionnaire. Also, distraction while answering the questions could play a role. Culture may also be an aspect that must be considered when it comes to the TPB and personality (Triandis & Eunkook, 2002) domains. For example, SN play a major role in collectivist cultures, whereas autonomy has a higher influence on individual societies. The same holds for PBC, which is associated with a group process in collectivist cultures rather than in individualist cultures (Glanz, et al., 2015).
References
1) Alcohol in Moderation. (2016). Sensible Drinking Guidelines. retrieved from http://www.drinkingandyou.com/site/pdf/Sensibledrinking.pdf (10.06.2016, 18:38). 2) Ajzen, I. (1985). From intentions to actions: A theory of planned behavior. In J. Kuhl
& J. Beckman (Eds.), Action-control: From cognition to behavior (pp. 11-39). Heidelberg. Springer.
3) Ajzen, I. (1991). The Theory of Planned Behavior. Organizational Behavior and Human Decision Processes. 50. 179-181.
4) Ajzen, I. (2002). Constructing a TpB Questionnaire: Conceptual and Methodological Considerations.
5) Ajzen, I. (2011) The theory of planned behaviour: Reactions and reflections, Psychology & Health, 26:9, 1113-1127, DOI: 10.1080/08870446.2011.613995
6) Al- Babissi, A. H. (2003). Role Gender in Road Accidents. Traffic Injury Prevention. 4(1). 64-73. doi: 10.1080/15389580309857
7) American Academy Of Child & Adolescent Psychiatry. (2016). Alcohol and Drug
Abuse. retrieved from
https://www.aacap.org/aacap/families_and_youth/Glossary_of_Symptoms_and_Illnes ses/Alcohol_and_Drug_Abuse.aspx (08.04.2016, 12:42).
8) Anderson, P., de Bruin, A., Angus, K., Gordon, R. & Hastings, G. (2009). Impact of Alcohol Advertising and Media Exposure on Adolescent Alcohol Use: A Systematic Review of Longitudinal Studies. Alcohol and Alcoholism. 44(3). 229-243. doi: http://dx.doi.org/10.1093/alcalc/agn115
9) Barenbaum, N.B., Winter D.G., (2003). History of Modern Personality Theory and Research. Handbook of Psychology. doi: 10.1002/0471264385.wei0109
10) Barrick, M.R., Iowa, U. & Mount, M.K. (1993). Autonomy as a moderator of the relationships between the Big Five personality dimensions and job performance. Journal of Apllied Psychology. 78(1). 111-118. doi: 10.1037/0021-9010.78.1.111 11)Benthin, a., Slovic, P. & Severson, H. (1993). A Psychometric study of adolescent risk
perception. Journal of Adolescence. 16(2). 153-168. doi:10.1006/jado.1993.1014 12) Bogg, T. & Roberts, B.W. (2004). Conscientiousness and health behaviors: A
13) Committee on Substance Abuse (2001). Alcohol Use and Abuse: a Pediatric Concern. Pediatrics. 108(1). doi: 10.1542/peds.108.1.185
14) Conner, M., Warren, R., Close, S. & Sparks, P. (1999). Alcohol consumption and the Theory of Planned Behavior: An examination of the Cognitive Mediation of Past Behavior. Journal of Applied Social Psychology. 29 (8). 1676-1704. doi: 10.1111/j.1559-1816.1999.tb02046.x
15) Cooke, R., Dahdah, M., Norman, P. & French, D. P. (2016). How well does the theory of planned behaviour predict alcohol consumption? A systematic review and meta- analysis. Health Psychology Review. 10(2). 148-167. doi: http://dx.doi.org/10.1080/17437199.2014.947547
16) De Raad, B., Doddema-Winsemius, M. (2006). De Big Five Persoonlijkheidsfactoren. Uitgeverij Nieuwezijds. 10.
17) Ferguson, E. (2010). Personality is of central concern to understand health: towards a theoretical model for health psychology. Health Psychology Review. 7 (1). 32-33. doi: 10.1080/17437199.2010.547985
18) Festinger, L. (1957). A theory of cognitive dissonance. Stanford, CA: Stanford University Press.
19)Fishbein, M., & Ajzen, I. (1975). Belief, attitude, intention, and behavior: An introduction to theory and research. Reading, MA: Addison-Wesley.
20) Fitzpatrick, J. & McCarthy, G. (2014). Theories Guiding Nursing Research and Practice. Springer Publishing Company. 69.
21)Glanz, K., Rimer, B. K. & Viswanath, K. (2015). Health Behavior: Theory, Research and Practice. John Wiley & Sons Inc. 176.
22) Gollwitzer, P. M. & Oettingen, G. (1998). The Emergence and Implementation of Health Goals. Psychology and Health. 13. 688-689.
23)Guise, J. M. F., & Gill, J. S. (2007). “Binge drinking? It’s good, it’s harmless fun”: A
discourse analysis of accounts of female undergraduate drinking in Scotland. Health Education Research. 22. 895–906. doi:10.1093/her/cym034
24) Harmon- Jones (2012). Encyclopedia Of Human Behavior. 1. 543-544. Elsevier. 25) Harrison, E.L. & Fillmore, M. T. (2005). Social drinkers underestimate the additive
26) Hawkins, J. D., Catalano, R. F. & Miller, J. Y. (1992). Risk and Protective Factors for Alcohol and Other Drug Problems in Adolescence and Early Adulthood: Implications for Substance Abuse Prevention. Psychological Bulletin. 112(1). 64-65.
27) Hingson, R. W., Heeren, T., Zakocs, R. C., Kopstein, J., Wechsler, H. (2002). Magnitude of alcohol-related mortality and morbidity among U.S. college students ages 18–24. Journal of Studies on Alcohol. 63. 136–144.
28) Hingson, S.D. & Winter, M. P. H. (2003). Epidemiology and Consequences of Drinking and Driving. National Institute on Alcohol Abuse and Alcoholism. retrieved from http://pubs.niaaa.nih.gov/publications/arh27-1/63-78.htm (13.02.2016, 19:43).
29) John, O. P. & Srivastava, S. (1999). The Big- Five Trait Taxonomy- History, Measurement and Theoretical Perspectives. retrieved from http://moityca.com.br/pdfs/bigfive_John.pdf (12.06.2016; 13:44).
30) Keyes, K. M. & Hasin, D. S. (2008). Socio-economic status and problem alcohol use: the 554 positive relationship between income and the DSM-IV alcohol abuse diagnosis. 103: 1120.
31) Knäuper, B., Rabiau, M., Cohen, O. & Patriciu, N. (2004). Compensatory Health Beliefs: scale development and psychometric properties. Psychology & Health. 19(5). 607-624. doi: 10.1080/0887044042000196737
32)Kuntsche, E., Rehm, J. & Gmel, G. (2004). Characteristics of binge drinkers in Europe. Social Science & Medicine. 59(1) 114. doi:10.1016/2003.10.009
33) Kuntsche, E., Knibbe, R., Gmel, G. & Engels, R. (2006). Who drinks and why? A review of socio-demographic, personality and contextual issues behind the drinking motives in young people. Addictive Behaviors. 31. 1844-1857. doi:10.1016/j.addbeh.2005.12.028
34) McDonald, D. J. (2008). Measuring Personality Constructs: The Advantages and Disadvantages of Self- Reports, Informant Reports and Behavioural Assessments. Enquire. 1(1).
35) McLeod, S. A. (2014). Cognitive Dissonance. Retrieved from
www.simplypsychology.org/cognitive-dissonance.html (11.06.2016; 11:30).
36)Messerli-Buergy, N., Bachmann, M.S., Pjanic, I., Barth, J. & Znoj, H. (2013). The Influence of Self- efficacy and Compensatory Health Behavior in Bicycle Helmet Use. Health Behavior & Public Health. 3(2). 1-5.
http://rethinkingdrinking.niaaa.nih.gov/How-much-is-too-much/Is-your-drinking-pattern-risky/Whats-Low-Risk-Drinking.aspx (10.06.2016; 18:39).
38) National Cancer Institute (NIH). (2013). Alcohol and Cancer Risk. retrieved from http://www.cancer.gov/about-cancer/causes-prevention/risk/alcohol/alcohol-fact-sheet (22.03.2016,11:56).
39)Neighbors, C., Lee, C.M., Lewis, M.A., Fossos, N., & Larimer, M.E. (2007). Are Social Norms the Best Predictor of Outcomes Among Heavy Drinking College Students? Journal of Studies on Alcohol and Drugs. 68 (4). 557.
40) Pieterse, M.E., Boer, H., Van Wersch, A. (2010). Testing the Twente Model of Binge Drinking in Dutch and English 15-19 year olds: Unraveling the role of the cultural context in developing hazardous drinking habits. Research Proposal, University of Twente, Enschede.
41)Rabiau, M., Knäuper, B., & Miquelon, P. (2006). The eternal quest for optimal balance between maximizing pleasure and minimizing harm: The compensatory health beliefs model. British Journal of Health Psychology, 11(1), 139-153.
42) Radtke, T., Scholz, U., Keller, R., Knäuper, B. & Hornung, R. (2011). Smoking-specific compensatory health beliefs and the readiness to stop smoking in adolescents. British Journal of Health Psychology. 16 (3). 620. doi: 10.1348/2044-8287.002001
43) Radtke, T. & Scholz, U. (2012). "Enjoy a delicious cake today and eat healthily tomorrow": Compensatory Health Beliefs and their impact on health. The European Health Psychologist, 14(2). 37-40.
44) Radtke, T., Scholz, U., Keller, R. & Hornung, R. (2012). Smoking is ok as long as I eat healthily: Compensatory Health Beliefs and their role for intentions and smoking within the Health Action Process Approach. Psychology & Health. 27(2). 93. doi: 10.1080/08870446.2011.603422
45)Rehm, J., Mathers, C., Popova, S., Thavorncharoensap, M., Teerawattananon, Y. & Patra, J. (2009). Global burden of disease and injury and economic cost attributable to alcohol use and alcohol-use disorders. Lancet. 373. 2.
46) Rhodes, R.E., Courneya, K.S. & Hayduk, L.A. (2002). Does Personality Moderate the Theory of Planned Behavior in the Exercise Domain? Journal of Sport & Exercise Psychology. 24. 120-132.
48) Srivastava, S., John, O. P., Gosling, S. D., & Potter, J. (2003). Development of personality in early and middle adulthood: Set like plaster or persistent change? Journal of Personality and Social Psychology, 84, 1041-1053.
49) Stueve, A. & O’Donnell, L. N., (2005). Early Alcohol Initiation and Subsequent Sexual and Alcohol Risk Behaviours Among Urban Youths. American Journal of Public Health. 95(5). 887.
50) Storm, V., Reinwand, D., Wienert, J., Kuhlmann, T., De Vries, H. & Lippke, S. (2016). Brief report: Compensatory health beliefs are negatively associated with intentions for regular fruit and vegetable consumption when self-efficacy is low. Journal of Health Psychology. 1-7. doi: 10.1177/1359105315625358
51) Tan, H.H. & Tan, M.L. (2008). Organizational citizenship behavior and social loafing: The role of personality, motives, and contextual factors. Journal of Psychology. 142(1). 89- 108. doi: 10.3200/JRLP.142.
52) Taylor, D., Bury, M., Campling, N., Carter, S., Garfield, S., Newbould, J., Rennie, T. (2007). A Review of the use of the Health Belief Model (HMB), the Theory of Reasoned Action (TRA), the Theory of Planned Behaviour (TPB) and the Trans- Theoretical Model (TTM) to study and predict health related behaviour change. National Institute for Health and Clinical Excellence. retrieved from
http://www2.warwick.ac.uk/fac/med/study/ugr/mbchb/phase1_08/semester2/healthpsy chology/nice-doh_draft_review_of_health_behaviour_theories.pdf (12.06.2016, 13:41).
53)Triandis, H. C. & Eunkook, M. S. (2002). Cultural Influences on Personality. Annual
Review of Psychology. 53. 133-160. doi: 10.1146/annurev.psych.53.100901.135200
54) Vega, W. A., Zimmennan, R. S., Warheit, G. J., Apospon, E., & Gil, A.G. (1993). Risk Factors for Early Adolescent Drug Use in Four Ethnic and Racial Groups. American Journal of Public Health. 83(2). 188.
55)Webb, T. L. & Sheeran,P. (2006). Does changing behavioural intentions engender behavior change? A meta- analysis of the experimental evidence. Psychological Bulletin. 132. 261.
57) Weisberg, J. Y., DeYoung, C. G. & Hirsh, J. B. (2011). Gender Differences in Personality across the Ten Aspect of the Big Five. Front Psychology. 2 (178). doi: 10.3389/fpsyg.2011.00178
58)Werch, C. E., Pappas, D. M., Carlson, J. M., DiClemente, C. C., Chally, P. S., Sinder, J. A. (2000). Results of a social norm intervention to prevent binge drinking among first-year residential college students. Journal of American College Health. 49. 85-86. 59) Willenbring, M.L. (n.d.). Gaps in Clinical Prevention and Treatment for Alcohol Use
Disorders: Costs, Consequences and Strategies. Alcohol Research: Current Reviews. 35(2). retrieved from: http://pubs.niaaa.nih.gov/publications/arcr352/238-243.htm (14.02.2016, 17:35).
60) Woicick, P. A., Stewart, S. H., Pihl, R. O. & Conrod, P. J. (2009). The Substance Use Risk Profile Scale: a scale measuring traits linked to reinforcement- specific substance use profiles. Addictive Behavior. 34(12). 1042-1055. doi: 10.1016/j.addbeh.2009.07.001.
61) World Health Organization. (2002). The World Health Report. 13-16.
62) World Health Organization. (2014). Global status report on alcohol and health.
Retrieved from
Appendix
A: Survey
Participant information
Dear participant,
Thank you for your participation in this study. Before you start filling in the questionnaire, you are asked to read the following information carefully.
The aim of this study is to look at the consumption of alcohol and levels of physical activity for young adults. We also want to look at personality factors and health beliefs influencing the consumption of alcohol among young adults.
Completing the questionnaire will take about 15 minutes. There are no “right” or “wrong” answers, just answer the questions honestly according to your personal experience and feeling. Select the answer that applies to you the best in this moment.
The questionnaire consists of one general part about your demographical details and five scales related to overall health beliefs, alcohol consumption, personality and the intention to perform or not to perform certain unhealthy behaviors.
At any point of this study, your anonymity is ensured. We will keep information about you confidential, and protect it from unauthorized disclosure, tampering, or damage. All information we can obtain from your answers will be used only for this research. Your participation is voluntary and you have the right not to participate at all or to leave the study at any time.
At the end of this questionnaire, you have the possibility to fill in your e-mail address if you are interested in the results of this study. For further information of questions, you can contact
Laura Thomas (l.thomas@student.utwente.nl) or Jannik Scheffels (j.f.scheffels@student.utwente.nl).
Through clicking on “next” (>>) you confirm that you have read and understood the information given above. In addition, you agree to take part in this study.
Personality (BFI, 5- point Likert Scale)
Here are a number of characteristics that may or may not apply to you. For example, do you agree that you are someone who likes to spend time with others? Please indicate the extent to which you agree or disagree with each statement.
I see myself as someone who…
1) ... does a thorough job. 2) ... is a reliable worker. 3) ... tends to be disorganized. 4) ... tends to be lazy.
5) ... perseveres until the task is finished. 6) ... does things efficiently.
7) ... makes plans and follows through with them. 8) ... is easily distracted.
9) ... is depressed, blue.
10)... is relaxed, handles stress well. 11)... can be tense.
12)... worries a lot.
13)... is emotionally stable, not easily upset. 14)... can be moody.
15)... remains calm in tense situations. 16)... gets nervous easily.
Compensatory Health Beliefs Scale (5- point Likert Scale)
1) Relaxing on the weekend can make up for stress during the week. 2) Using artificial sweeteners compensates for extra calories.
3) Drinking alcohol in the evening can be compensated by bicycling or walking home afterwards.
4) Exercising can compensate for smoking.
5) It is OK to go to bed late if one can sleep longer the next morning (only the number of hours count).
6) Not drinking alcohol during the week can make up for the effects of drinking too much alcohol during the weekend.
7) Skipping the main dish can make up for eating dessert.
8) Relaxing in front of the TV can compensate for a stressful day.
9) Eating whatever one wants in the evening is OK if one did not eat much during the day.
10) Sleeping in on the weekends can compensate for too little sleep during the week. 11) Eating healthy can make up for the effects of regularly drinking alcohol.
12) Exercising can make up for the bad effects of stress.
13) Being physically active can compensate for the effects of regularly drinking alcohol. 14) The effects of drinking coffee can be balanced by drinking equal amounts of water. 15) Drinking alcohol on one day can be compensated by being physically active the next
day.
16) Sleep compensates for stress.It is alright to drink a lot of alcohol as one drinks lots of water to flush it.
17) Starting a new diet tomorrow compensates for breaking a diet today.
18) If I am physically active during the week, it is OK to drink more alcohol during the weekend.
19) Smoking from time to time is OK if one eats healthy.
20) It is OK to skip breakfast if one eats more during lunch or dinner.
Alcohol Consumption Scale
a shot glass. This is called one unit. If the drink comes in the right glass, every drink should hold the same amount of alcohol.
Half a pint: 1 unit Small glass of wine: 1 unit Shot: 1 unit A pint: 2 units Large glass of wine: 2 units
Please answer the following questions in units. In the table below, you’ll find some examples.
Kind of drink Number of units
½ pint 1
Pint 2
Small glass of wine 1
Large glass of wine 2
Bottle of wine (0,75l.) 7,5
Mix-drink 1
Shot 1
Bottle of liquor 22
As you can see in the table, one small wineglass is one unit of alcohol. If you had three small glasses of wine, your answer will be 3 units, because 3 x 1 = 3.
Have you ever had an alcoholic drink?
Yes
On how many days of the four weekdays (Monday, Tuesday, Wednesday, Thursday) do you usually drink alcohol?
4 days
3 days
2 days
1 day
Less than 1 day
I never drink on a weekday
How many units of alcohol do you usually drink on a weekday on which you drink?
11 units or more per day
7-11 units per day
6 units per day
5 units per day
4 unit per day
3 units per day
2 units per day
1 unit per day
0 units per day
On how many of the three weekend days (Friday, Saturday, Sunday) you usually drink alcohol?
3 days
2 days
1 day
Less than 1 day
How many units of alcohol do you usually drink on a weekend day on which you drink?
20 units or more per day
15-19 units per day
11-14 units per day
7-10 units per day
6 units per day
5 units per day
4 units per day
3 units per day
2 units per day
1 unit per day
0 units per day
In the last 4 weeks, how often did you drink six or more units of alcohol on one occasion (for example on a party or on an evening)?
1 time in the last 4 weeks
2 times in the last 4 weeks
3 times in the last 4 weeks
4 times in the last 4 weeks
5 times in the last 4 weeks
6 times in the last 4 weeks
7 times in the last 4 weeks
8 times in the last 4 weeks
9 or more times in the last 4 weeks
Intention to drink alcohol
Please answer by indicating which statement applies best to you (e.g. extremely unlikely, extremely likely or in between).
I intend to drink not more than 14 (female)/21 (male) units at once in a week within the next 6 months.
Extremely
unlikely
Extremely likely
I will try to drink not more than 14 (female)/21 (male) units at once in a week within the next 6 months.
Definitely false Definitely true
I plan to drink not more than 14 (female)/21 (male) units in a single session at once in a week within the next 6 months.
Strongly
disagree Strongly agree
If I wanted to I could drink not more than 14 (female)/21 (male) units in a single session at
once in a week in the next 6 months would be…
Very difficult Very easy
For me to drink not more than 14 (female)/21 (male) units of alcohol at once in a week during
the next 6 months would be…
Harmful beneficial
pleasant unpleasant
good bad
worthless valuable