Nina Rusch
KONINKLIJKE
GROLSCH
N.V.
-A SABMiller Company
Brouwerslaan 1
7548 XA Enschede
Tel: +31(0)53-4833333
www.koninklijkegrolsch.nlDocument Title ANALYSIS OF THE FILTRATION PROCESS AT A BEER BREWERY
How can the inaccurate measurements of the inline instruments within Brewery Grolsch’s filtration process be improved?
Bachelor thesis for the bachelor program Industrial Engineering and Management at the University of Twente
Status Public Report Bachelor Assignment
Date 07-07-2016
Author Nina Rusch s1411802
Bachelor Program Industrial Engineering and Management
Graduation Committee
University of Twente
Dr. ir. L.L.M. van der Wegen
Faculty of Behavioral Management and Social SciencesIr. Arturo E. Pérez Rivera
Faculty of Behavioral Management and Social Sciences
Grolsche Bierbrouwerij Harro de Vries
Manager Brewing
MANAGEMENT SUMMARY
The Brewing Department at Grolsch is responsible for brewing and filtering beer for their customers. During the filtration process a few problems were identified with the main problem being the inaccurate measurements of the inline instruments, thus of the alcoholic strength and the original extract. The measurement of these parameters is of importance in order to offer the customers high quality products. Therefore, the main research question discussed in this thesis is identified as:
How can the inaccurate measurements of the inline instruments within Brewery Grolsch’s filtration process be improved?
During the research multiple possible causes are identified and nine are analyzed in more detail. From interviews with mainly the operators of Grolsch but also employees of the company Anton Paar, which produces most of the inline instruments, the main causes are identified and evaluated. The four main causes are the product-specific adjustment, reaction time, important parameters and the batch size. The root causes behind the main problems are investigated for each cause individually. In the end, recommendations for improvements and future research are written.
Product-specific adjustments involve the product numbers used during the filtration process and the adjustment of the inline instruments with laboratory values as reference. In cooperation with the company Anton Paar, the inline measurements are better analyzed and the adjustment procedure is reviewed. In the end, irregularities are found and two options for new allocation of the numbers as well as a new adjustment procedure are proposed. This is something Grolsch has wanted to do for quite some years. The reaction time involves the time that instruments need to adjust to the manually changed values in the automation system or to the fluctuating process conditions. Some of the valves have problems with those adjustments. Many parameters can be changed to adjust them. In order to detect the problems behind the irregularities or long reaction time of valves faster, a new valve irregularity procedure is recommended. Next, the important parameters are part of another problem behind the inaccurate measurements. During different phases of the brewing and filtration process, different parameters are of importance. Especially the inline pressure during the measurement process is of importance. It is noticed that the Beer Pressure Regulating Valve, which is responsible for establishing a consistent inline pressure, has no set-point installed and therefore does not regulate the process flow. In consultation with the company Haffmans, a recommendation for the set-point range for the valve is made. It is further recommended to measure the optimal set-points for different product types and product packaging families, since the CO2 content of those differs. Finally, it is identified that some of the batches are too small to produce an end product within the range of the quality standards. The batch sizes are dependent on the demand of the customers and the life of the products. Products with low demand and shelf-life have to be produced in smaller batches. Moreover, the minimum batch size has never been calculated but is an estimate. For the future, calculations per product are recommended. Through implementing the recommendations, a more stable and efficient process will arise.
PREFACE
How is beer made? Most people immediately think about the brewing process and how the beer is finally filled into bottles or kegs. Many do not know anything about the filtration process and about process and quality control. This research shows that brewing beer is a complex process and many factors are important for delivering high quality products to the customers.
TABLE OF CONTENTS
Management Summary ... ii
Preface ... iii
Figures, Tables and equations ... vi
List of Abbreviations ... vii
Glossary ... vii
1. Introduction ... 1
1.1. Introduction Grolsch ... 1
1.1.1. History of Grolsch ... 1
1.1.2. Brewing Process ... 2
1.1.3. Filtration Process... 2
1.1.4. Inline Instruments ... 3
1.2. Problem Definition ... 3
1.2.1. Relevance of the Problem and Scope of the Project ... 5
1.3. Problem Statement and Research Questions ... 6
1.3.1. Operationalization of Key Variables ... 7
2. Current Situation ... 9
2.1. Filtration Process ... 9
2.2. Inline Instruments ... 13
2.2.1. Density and Sound Velocity Transducer ... 14
2.2.2. CO2 Smart Sensor ... 15
2.2.4. Evaluation Unit ... 17
2.3. Conclusion ... 18
3. Influences on the Filtration Process ... 19
3.1. Possible Causes for the Inaccurate Measurements ... 19
3.1.1. Cause and Effect of the Possible Causes ... 19
3.1.2. Description of the Possible Causes ... 21
3.2. Influence of the Possible Causes on the Filtration Process ... 25
3.2.1. Categorization of Possible Causes... 31
3.3. Origin of the Problems Behind the Possible Causes ... 31
3.3.1. Product-Specific Adjustment ... 31
3.3.3. Important Parameters ... 33
3.3.4. Batch Sizes ... 33
3.4. Conclusion ... 34
4. Improvement Possibilities ... 35
4.1. Importance of Improvement ... 35
4.2. Improvements ... 35
4.2.1. Improvement of the Product-Specific Adjustment ... 35
4.2.2. Improvement of the Reaction Time ... 38
4.2.3. Improvement of the Important Parameters ... 38
4.2.4. Improvement of the Batch Sizes ... 40
4.3. Process Control ... 41
4.4. Conclusion ... 42
5. Conclusion and Disscussion ... 43
5.1. Conclusion ... 43
5.2. Recommendations ... 44
5.2.1. General Recommendations ... 44
5.2.2. Recommendations for the Implemention ... 45
5.3. Limitations and Future Research ... 46
5.3.1. Future Research ... 46
Bibliography ... 47
Appendix ... 50
A. Stakeholder Analysis ... 50
B. Flow Chart Filtration ... 52
C. Filter Capacity and Volume ... 53
D. Calculation of Fluctuation Period ... 53
E. Statistical Summary Batch Sizes ... 53
F. Haffmans Numbers ... 53
FIGURES, TABLES AND EQUATIONS
Figure 1-1 - Grolsch's Brewing Process ... 2
Figure 1-2 – Overview of Grolsch's Filtration Process ... 3
Figure 1-3 - Anton Paar Inline Instrument ... 3
Figure 1-4 - Problem Cluster ... 4
Figure 2-1 - Candle Filter ... 10
Figure 2-2 – Detailed Filtration Process at Grolsch ... 11
Figure 2-3 - Beer Flow through a Filter Candle ... 12
Figure 2-4 - Beer Flow through the Pre-Coats ... 12
Figure 2-5 - Density and Sound Velocity Sensor (DSRn 427) (Anton Paar, n.d.-a) ... 14
Figure 2-6 - Relationship: Alcohol and Sound Velocity (Anton Paar, n.d.-a) ... 15
Figure 2-7 - Relationship: Sugar, Density and Sound Velocity (Anton Paar, n.d.-a) ... 15
Figure 2-8 - Measurement of CO2 Smart Sensor (Anton Paar, n.d.-a) ... 16
Figure 2-9 - CO2 Dosing Device... 16
Figure 2-10 - Installation of the Beer Monitor (Anton Paar, n.d.-b) ... 17
Figure 2-11 - Measuring Alcohol and Extract by Sound Velocity and Density (Anton Paar, n.d.-a) ... 18
Figure 3-1 - Ishikawa Diagram ... 20
Figure 3-2 - Offset and Gain-Factor (Anton Paar, n.d.-a) ... 22
Figure 3-3 - Distance from a Turn (Anton Paar, 2013) ... 22
Figure 3-4 - Difference in Standard Deviation - Weizen and Pils ... 23
Figure 3-5 - Off-set of Measurements ... 26
Figure 3-6 - Functioning of Valves ... 28
Figure 3-7 - Screenshot of a Filtration Run ... 30
Figure 3-8 - Normal Distribution of Two Pils Batches ... 30
Figure 4-1 - Appointment of Haffmans Numbers ... 37
Table 1-1 – Quality Control Table ... 8
Table 3-1 - Possible Causes for the Inaccurate Measurements ... 21
Table 3-2 - Filtration Restrictions ... 26
Table 3-3 - Categorization Possible Causes ... 31
Table 3-4 - Haffmans Numbers at Grolsch ... 32
Table 4-1 - CO2 Content Dependent on Product Types ... 40
Equation 2-1 - Darcy's Law for Beer Filtration (Buttrick, 2010) ... 9
Equation 2-2 - Equations for Determining Important Beer Filtration Parameters (Nielson et al., 2007) ... 14
LIST OF ABBREVIATIONS
Abv Alcohol by Volume
BBT Bright Beer Tank
BPRV Beer Pressure Regulating Valve
Carbo 510 Anton Paar Carbo 510
CO2 Carbon Dioxide
DSRn 427 Anton Paar DSRn 427
FBT Filtered Buffer Tank
KG Kieselguhr
mPDS Anton Paar mPDS 2000V3 Evaluation Unit
O2 Oxygen
OE Original Extract
PLC Programmable Logic Controller
PVPP Polyvinylpolypyrrolidone
UBT Unfiltered Buffer Tank
GLOSSARY
Anton Paar Anton Paar GmbH produces high-quality measuring and analysis instruments for research and industry.
Automation System Automated systems eliminate the need for human interference in order to complete a task.
Beer Monitor The Beer Monitor is responsible for determining all beer parameters through combined density and sound velocity measurements. Brewing Department The Brewing Department is responsible for brewing and filtering all
beers at Grolsch.
Brewmaxx Brewmaxx is a process control system for the brewing industry in which various process steps of a brewery are automated, controlled and monitored.
Condition-Based Maintenance Condition-Based Maintenance only performs maintenance when the facilities require it
Continuous Improvement Continuous Improvement is the seeking of small incremental improvement steps in processes and products, with the objective of increasing quality.
Degree of Clarity The dullness of the beer.
Depth-Filtration Depth-Filtration works by collecting particulates within the filter medium and passing a clean outlet flow of the beer.
Diatomaceous Earth Diatomaceous Earth is a fine siliceous earth composed chiefly of the cell walls of diatoms and used in filtration.
Filtration Process The Filtration Process is an operation during the beer production that separates solids from fluids by directing it through a medium which only fluids can pass.
Haffmans Numbers The product numbers at Grolsch are called Haffmans numbers and are of importance for the accuracy during the measurements.
High Gravity Brewing During High Gravity Brewing the original extract is significantly higher than the target and during filtration it is diluted with water.
Ishikawa Diagram Ishikawa diagrams are causal diagrams that show the causes of a specific core problem.
Kieselguhr Another word for Diatomaceous Earth.
Knowledge Management Knowledge management is the process of effectively capturing, developing, sharing, and using the knowledge of an operation. Lager Beer Lager beer is a type of beer that is conditioned at low temperatures
and has not yet been filtered.
Methodological Triangulation Methodological Triangulation is a method that checks and double-checks its solutions in order to validate the data.
Original Extract Original Extract is the amount of extract(sugar) in the beer before fermentation.
Pasteurization Pasteurizing is a process that kills bacteria in liquid foods by heating the liquid.
Permeability Factor The permeability factor of a filter describes the pressure differential across the filter bed.
Planning Department The Planning Department at Grolsch is responsible for all planning processes important for the end product.
Polyvinylpolypyrrolidone Polyvinylpolypyrrolidone is used as a filter medium in the brewing industry. It removes polyphenols in beer production and thus clear beers with stable foam are produced.
Preventive Maintenance Preventive Maintenance eliminates the chance of a possible failure by checking, cleaning and replacing the instrument parts regularly in pre-planned intervals.
Process Control Process Control means controlling all processes throughout the brewery. If all processes harmonize the company can succeed. Product-Specific Adjustment The product-specific adjustment is an action that brings a measuring
instrument into a state of performance, suitable for its purpose. It means minimizing the measurement errors as well as deviations by adjusting the measuring instrument.
Proleit Proleit is a company specialist in process control systems and automation solutions for the brewing industry.
Quality Control Quality Control is the process of reviewing the quality of all factors involved in the production of beer.
Quality Control Department The department responsible for Quality Control. Run-To-Breakdown
Maintenance Run-To-Breakdown Maintenance means allowing the instrument to continue working until it fails and then repair or replace it. Shelf-Life Shelf life is the length of time that beers may be stored without
becoming unfit for consumption or sale.
Silica Gel Silica Gel is a beer stabilizer that is used during filtration and which reduces the level of haze that can form in the finished beer.
1.
INTRODUCTION
The Grolsch brand, as well as the process of brewing beer, has changed throughout the years. Whereas
back in the days, the master brewer had to control the process manually, nowadays an automated system, also called automation system, does most of the work. One part of the beer brewing process is the
filtration process. This process is where the flavor of the beer as well as the color is determined and
stabilized. The addition of water and CO2 is also part of this step in order to receive a high quality finished end product. During the filtration process the beer is measured on its percentage alcohol or the °Plato of
the original extract (stamwort). At Grolsch, an inline instrument from the company Anton Paar is
responsible for measuring these values. The values are of importance in order to calculate the amount of water to be added to the process. This is necessary since beer is brewed more concentrated than the end product in an effort to produce more beer with minimum resources. Unfortunately, the instrument at
Grolsch does not do its work sufficiently. At the moment, operators have to re-measure the values of
alcohol and original extract manually to make sure the beer has the right composition. With the measurements, which they analyze in their laboratory, they can determine their following actions. The management team from Grolsch would now like to know why it is not possible to trust this and other inline instruments and why it is not possible to filter without human interaction. In the future they hope to have a more stable, efficient and trustworthy filtration process.
This first chapter consists of the research plan. Frist, an introduction of Grolsch and the filtration process (Section 1.1) that is followed by a more detailed description of the problem (Section 1.2). Finally, the problem statement and the research questions are explained (Section 1.3).
1.1.
INTRODUCTION GROLSCH
The introduction of Grolsch starts with a short outline of the history of Grolsch (Section 1.1.1) and a brief description of Grolsch’s brewing process (Section 1.1.2) as well as an overview of the filtration process (Section 1.1.3).
1.1.1.HISTORY OF GROLSCH
Royal Grolsch N.V. is a Dutch brewery, part of the SABMiller group and located in Enschede, the
1.1.2.BREWING PROCESS
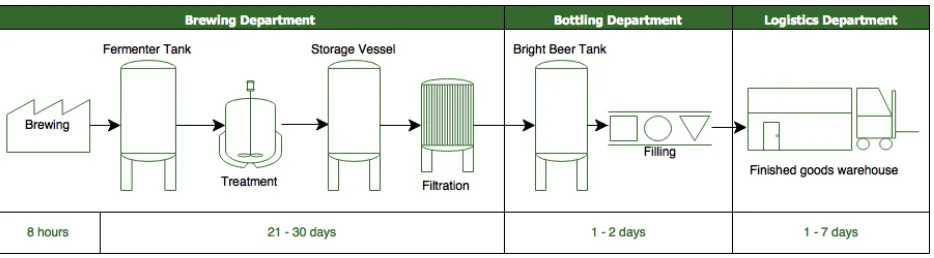
[image:11.612.74.541.266.395.2]Grolsch does not only brew their famous Grolsch Premium Pils, but also other beers like their Radler or special beers like the beers Lentebok and Herfstbok. Beer is brewed with the four basic ingredients water, malt, hop and yeast. Figure 1-1 shows the process of beer brewing. The first step of brewing beer is the actual brewing process where the malt is milled with water and heated up. Wort results from the mixture and the husks are separated from the liquid. After that the mixture is filled into the fermenter tank where yeast is added and alcohol as well as carbon dioxide arises. To separate the yeast from the substance, everything is treated through centrifuging. Then the mixture matures in the storage vessels and finally the beer is filtered. This is done to produce a clear uniform beer. Since the beer is brewed with a higher concentration, water and carbon dioxide are added to receive the right amount of alcohol and original extract. In the end, the beer is stored in the bright beer tank (BBT) from which it is then pumped into the filling lines. Here the beer is filled into cans, bottles or kegs and finally packed into boxes or crates. These are then kept in the warehouse before they are being delivered to their customers.
Figure 1-1 - Grolsch's Brewing Process 1.1.3.FILTRATION PROCESS
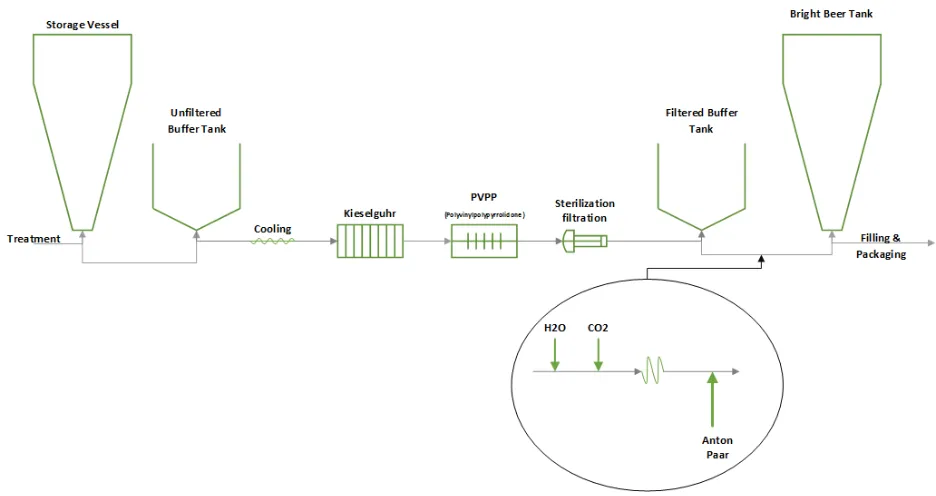
As described above, the filtration process is an important part of beer brewing. Responsible for the process of beer brewing and beer filtering within Grolsch is the Brewing Department. 36 people are employed here.
Figure 1-2 – Overview of Grolsch's Filtration Process 1.1.4. INLINE INSTRUMENTS
After the actual filtration the beer flows through inline instruments. One of the instruments is used for continuous, real time monitoring of the alcohol content and original extract of alcoholic and non-alcoholic beverages. The instrument used at Grolsch is a combined density and sound velocity measurement instrument. Density and sound velocity are determined simultaneously before the data is processed. The instrument calculates the alcoholic strength and amount of original extract with the measurements. It can compensate for the CO2 that is already in the beer, at the same time. Another instrument measures the CO2 values. The instruments are of great importance for the legal foundation of the beer. Beers are brewed according to the percentage of alcohol or the °Plato of the original extract, the sugar which is in the wort. Exported beer must be brewed according to the percentage alcohol since it could otherwise not fulfill the export regulations since the deviation in alcoholic strength needs to fluctuate less than from domestic products.
1.2.
PROBLEM DEFINITION
The management team of Grolsch’s Brewing Department wants an analysis of the filtration process and a plan of action. They want to find out why the inline instruments are not trustworthy and why the measurements are not accurate. To get a better understanding and to identify the action problem, a problem cluster is made.
A problem cluster is a method in which causes and effects of problems are logically linked and a clear action problem can be found (Heerkens, 2004). The main action problem has to be the cause of the other problems and not the consequence or the symptom of another problem. In order to arrange the problem cluster, the most relevant stakeholders are asked about their knowledge and assumptions. The primary stakeholders are the operators. These are the people who operate as well as supervise the brewing process. They also have to implement the final action plan. The analysts from the quality assurance, technicians and the managers of the Brewing Department are secondary stakeholders. All of them are
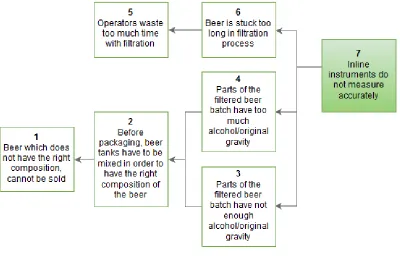
involved active by the problem solving approach. The managers especially hope that this research will make the filtration process and the work of the operators more efficient. From these conversations new causes and its consequences become clear and the problem cluster can be made. The problem cluster is shown in Figure 1-4, followed by a brief description of the problems. A more detailed stakeholder analysis based on a method described by Reed et al. (2009) can be found in Appendix A.
Figure 1-4 - Problem Cluster
1. If Grolsch brews export beer, the beer needs to have the right composition in order to be sold.
The laws for export goods are stricter than the laws within the Netherlands.
2. Since the BBTs do not always store the right mixture of beer, the tanks have to be mixed. The causes of this action are often the inaccurate measurements. Since the measurements are inaccurate, the first and the second part of the beer need to be mixed in order to have a beer with the right concentration. This means that if the first part of the filtered beer consists of stronger beer, the second part of the beer needs to have less alcohol/original extract. In the end, the beer is in one tank. To mix the beer, CO2 is added from the bottom. This way the beer circulates and is mixed.
An example: Amsterdam Maximator, which is also brewed at Grolsch, has 12% alcohol by volume (abv). If the first part of the batch is brewed with 11% abv, the second part of the batch has to have more than 12% abv in order to get a beer with the right percentage of alcohol1.
3. Since the measurements are not accurate, sometimes parts of the filtered beer batch do not have enough alcohol or original extract.
4. Since the measurements are not accurate, sometimes parts of the filtered beer batch have too much alcohol or original extract.
5. Operators often have to adjust the filtration process manually since they do not trust the inline instruments. Through taking samples they can figure out which adjustments they have to make. Since the operators have to make adjustments manually, they waste a lot of time on the filtration process. They should be using this time more efficiently.
6. Because the inline instruments do not measure accurately, the beer is stuck longer in the filtration process and the operators spend their time monitoring the process.
7. The action problem as well as the starting problem of this research is that the inline instruments do not measure accurately.
Further, visits at the company have shown that Grolsch tried to solve this problem through letting the operators take approximately every 500 hectoliter samples and letting them adjust the values within the automation system manually. This unfortunately does not solve the problem. On the one hand, operators are now constantly busy with these measurements, and on the other hand the manually adjusted values are not always correct either because the samples are not taken continuously or because there sometimes are human errors. With solving the primary action problem shown in Figure 1-4, the measurements will hopefully be more accurate and operators will not feel the need for constant re-measuring in the future .
1.2.1.RELEVANCE OF THE PROBLEM AND SCOPE OF THE PROJECT
By automating the brewing process within Grolsch the responsibility of brewing lies by the automation system. In the perfect situation, the system brews the beer automatically, only needing help from humans if there is an error or a problem within the process flow that it cannot handle on its own. Because of the inaccurate measurements of the inline instruments, the operators have to be cautious as soon as the filtration process begins. By taking measurements themselves, the operators can determine the adjustments they have to make within the automation system. The extra measurements have to be taken approximately once an hour and the manual process takes 20 minutes. This makes the filtration process less efficient and less stable. When operators are busy with other tasks, it could happen that a bright beer tank has a too high or too low alcoholic strength or the °Plato of the original extract is too high or low. If this happens, they have to change the recipe for the second part of the batch. This way they can brew the beer according to the target values. With a more stable, trustworthy and efficient filtration process, operators could pay more attention to other problems and processes. In the future this could mean that operators spend less time with the filtration process and that the beer can be packaged faster.
This problem troubles the efficiency end effectivity of the brewing process within Grolsch. The management team is curious what the causes and problems behind the inaccurate measurements of the inline instruments are and wants to create a more stable environment. The productivity of the operators as well as the system could be increased through decreasing the time spent for filtration.
1.3.
PROBLEM STATEMENT AND RESEARCH QUESTIONS
The main problem of Grolsch’s filtration process is not knowing why the inline instruments, especially those from Anton Paar are not measuring accurate values. The described problem leads to the following problem statement and action problem:
How can the inaccurate measurements of the inline instruments within Brewery Grolsch’s filtration process be improved?
This research is limited to the filtration processes of Grolsch and has therefore no external validity. The objective of the research is to optimize the measurements of the inline instruments and to have a more efficient, trustworthy and stable process. The operationalization of the key variables and the target of values during the process are described in Section 1.3.1. To find possible causes for the described problem and ultimately a solution, the following research questions are answered.
1. What is the current filtration process at Grolsch?
To better understand the process, first the filtration process has to be analyzed. This question is a knowledge problem. Understanding the filtration process also means understanding the inline instruments and their function and role as well as importance in the process. This will be done through researching the particular instruments and talking to the instrument technicians. The Brewmaxx system is studied to get a better understanding of the automation system.
2. What influences the filtration process?
This question will be answered in three parts. It mainly covers the process of finding the possible causes for the action problem and is another knowledge problem.
i) Which are the possible causes for the inaccurate measurements of the inline instruments?
Grolsch has different ideas for the possible causes of the inaccurate measurements of the inline
instruments, but of course there could be many more. Possible causes that Grolsch mentioned are:
• Bad maintenance of the instruments
• Wrong use of theinstruments
• Wrong implementation of theinstruments
• Wrong regulation within the automation system
• Ignorance / Distrust of operators
• Poor Process Control
To determine more possible causes, contact with the company Anton Paar has to be made. Additionally, employees from Grolsch have to be interviewed about their knowledge and experience. It will also be investigated if the employees think the causes, which are named above, could indeed be possible causes. The employees of Grolsch are the ones most familiar with the filtration process. By interviewing them through semi-structured interviews and holding group discussions, more possible causes can be identified. At the end of this qualitative research, a list with all possible causes will be made.
ii) Which causes influence the filtration process most?
check and establish validity in studies by analyzing the research question from multiple perspectives and insights (Guion, 2002). In the case of this research it will be done through different qualitative research methods and quantitative research, where possible. For this research, interviews and data collection as well as observations are used as research methods. With this method the consistency of the findings can be checked by using different data collection methods. Each of the multiple sources of data is able to give a different outcome and picture. Therefore, each data source is first considered and analyzed individually but in the end combined for a comprehensive view (Drouin, Stewart, & Van Gorder, 2015). This approach is necessary to know which possible causes are most likely the problem behind the inaccurate measurements. This method can also eliminate some possible causes. For more insight, the operators and laboratory workers are interviewed and an Ishikawa diagram is made during brainstorming sessions. This tool will make the causes and effects of the possible causes clear and visible. At the same time quantitative research will be done, if the data is available, to double-check the results gained by the qualitative research.
iii) What are the causes behind the most severe problems identified in 2ii?
After the possible problem causes are categorized, the possible causes need to be analyzed further. This analysis deals with solving the problems. With the help of the employees of the Brewing Department, the origin of the main problems is investigated. Here the problems that are determined most likely to be the possible cause are reviewed first.
3. What should Grolsch do to improve the filtration process?
In the end, conclusions are drawn and recommendations and an action plan for Grolsch is written. The conclusions are based on the findings of the previous questions. Furthermore, literature review is done for solving the causes of the severe problems that were found in 2 iii). The action plan also includes recommendations for future actions and research in order to prevent this problem from happening again.
1.3.1.OPERATIONALIZATION OF KEY VARIABLES
While filtrating the beer, the most important value of the filtration process is the °Plato of the original gravity or the alcoholic strength. Depending on the beer that is brewed, one of the two is measured continuously during the filtration process. At the moment, operators have to take samples and measure these values. Sometimes the values the operators measure are not the same as the values that the inline instrument measures. In that case they have to adjust the automation system manually. The third party that measures the values is the laboratory from the Quality Control Department. They take measurements of all beers and their measurements are seen as the most trustworthy.
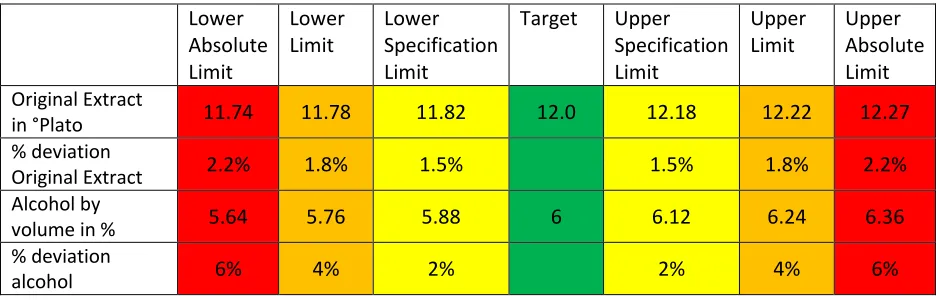
The acceptable values of the beer are split into different categories. These values are decisive for the quality of the final product. The original extract in °Plato may approximately deviate 2-3 percent. The alcoholic strength on the other hand may deviate 2-6 percent. This differs depending on the product. The target value is the value that the system tries to reach. The lower and upper specification is the margin that has to be reached by the operators. The lower and upper limit alarms the operators to adjust the process in order to brew beer that is not rejected. The beer may under no circumstances reach the lower or upper absolute value. An example of this can be seen in Table 1-1.2
Table 1-1 – Quality Control Table
The variables that have to be operationalized are the inaccurate measurements of the inline instruments. The key variables that will make the progress of this research measureable are thus the percentage of deviation in the measurements between the inline instruments and the quality control laboratory. The target deviation that is desired is one percent.
Lower Absolute Limit
Lower
Limit Lower Specification Limit
Target Upper Specification Limit
Upper
Limit Upper Absolute Limit
Original Extract
in °Plato 11.74 11.78 11.82 12.0 12.18 12.22 12.27
% deviation
Original Extract 2.2% 1.8% 1.5% 1.5% 1.8% 2.2%
Alcohol by
volume in % 5.64 5.76 5.88 6 6.12 6.24 6.36
% deviation
2.
CURRENT SITUATION
This chapter extensively describes the filtration process at Grolsch. The description of the filtration process is necessary for the research of the possible causes. In Section 2.1 the filtration process with all filters and filter-aids is described. In Section 2.2 the use and the usefulness of the inline instruments is explained.
2.1.
FILTRATION PROCESS
Beer filtration is an important part of the beer brewing process. It is done for different reasons. On the one hand beer is filtered for aesthetic reasons, people are conditioned to favor beer with a golden brown color over turbid beer (Lyke, 2012). On the other hand beer becomes transparent through filtration and proteins are removed (Lyke, 2012). This means that all acids, which are added to the process or which are in the beer, are removed and therefore the shelf-life of the product is increased (European Brewery Convention, European Brewery Convention Technology, Engineering Forum, & Coote, 1999). The shelf-life of products differs. While bottled products have a shelf-shelf-life of approximately 12 months, kegged products mainly have short term quality assurance.
There are a few particles that have to be removed from the beer before packaging. In addition to polyphenols, proteins and remains of yeast, beer contains metals and sugars, that make the beer turbid over time and under the influence of temperature (BASF, 2010). Most particles bigger than 5μm are removed throughout the process. The beer is analyzed at the end of the filtration run. The factors that are important for the analysis are: Degree of clarity, alcoholic strength, amount of original extract, amount of carbon dioxide (CO2) and amount of oxygen (O2). The basic physics behind the filtration process is Darcy’s Law from 1856 (Buttrick, 2010) that emphasizes that the design of the filter has a big influence on the beer filtration.
Equation 2-1 - Darcy's Law for Beer Filtration (Buttrick, 2010)
𝑭𝑭𝑭𝑭𝑭𝑭𝑭𝑭𝒓𝒓𝒓𝒓𝒓𝒓𝒓𝒓= 𝑃𝑃𝑃𝑃𝑃𝑃𝑃𝑃𝑃𝑃𝑃𝑃𝑃𝑃𝑃𝑃𝑃𝑃𝑃𝑃𝑃𝑃𝑃𝑃𝑓𝑓𝑃𝑃𝑓𝑓𝑃𝑃𝑓𝑓𝑃𝑃𝐹𝐹𝑃𝑃𝑃𝑃𝑃𝑃𝑃𝑃𝑃𝑃𝑃𝑃𝑃𝑃𝑑𝑑𝑥𝑥𝑃𝑃𝑃𝑃𝑃𝑃𝑟𝑟𝑟𝑟𝑟𝑟𝑃𝑃𝑃𝑃𝑃𝑃ℎ𝑃𝑃𝑓𝑓𝑖𝑖𝑓𝑓𝑃𝑃𝑟𝑟𝑟𝑟𝑑𝑑𝑃𝑃𝑓𝑓𝑑𝑑𝑥𝑥𝐿𝐿𝑃𝑃𝐿𝐿𝑟𝑟𝑃𝑃𝑑𝑑𝑥𝑥𝐴𝐴𝑃𝑃𝑃𝑃𝑃𝑃𝑣𝑣𝑃𝑃𝑟𝑟𝑓𝑓𝑓𝑓𝑟𝑟𝑃𝑃𝑃𝑃𝑃𝑃𝑓𝑓𝑓𝑓𝑓𝑓𝑃𝑃𝑃𝑃𝑃𝑃𝑃𝑃𝑃𝑃𝑃𝑃𝑃𝑃𝑓𝑓𝑓𝑓𝑟𝑟𝑟𝑟𝑃𝑃𝑓𝑓𝑃𝑃𝑓𝑓𝑃𝑃
𝑷𝑷𝒓𝒓𝒓𝒓𝑷𝑷𝑷𝑷𝑷𝑷𝒓𝒓𝒓𝒓𝒅𝒅𝒓𝒓𝑭𝑭𝒅𝒅𝒓𝒓𝒂𝒂𝒓𝒓𝑭𝑭𝑷𝑷𝑷𝑷𝒓𝒓𝒇𝒇𝒇𝒇𝑭𝑭𝒓𝒓𝒓𝒓𝒓𝒓𝒃𝒃𝒓𝒓𝒅𝒅= 𝐹𝐹𝑃𝑃𝑓𝑓𝐹𝐹𝑃𝑃𝑃𝑃𝑃𝑃𝑃𝑃𝑃𝑃𝑃𝑃𝑃𝑃𝑃𝑃𝑃𝑃𝑃𝑃𝑃𝑃𝑃𝑃𝑃𝑃𝑃𝑃𝑃𝑃𝑃𝑃𝑥𝑥𝐹𝐹𝑃𝑃𝑃𝑃𝑃𝑃𝑃𝑃𝑃𝑃𝑓𝑓𝑃𝑃𝑓𝑓𝑃𝑃𝑓𝑓𝑃𝑃𝑃𝑃𝑃𝑃𝑑𝑑𝑥𝑥𝑃𝑃ℎ𝑃𝑃𝑓𝑓𝑖𝑖𝑓𝑓𝑃𝑃𝑟𝑟𝑟𝑟𝐴𝐴𝑃𝑃𝑃𝑃𝑃𝑃𝑓𝑓𝑓𝑓𝑓𝑓𝑃𝑃𝑃𝑃𝑃𝑃𝑃𝑃𝑃𝑃𝑃𝑃𝑃𝑃𝑓𝑓𝑓𝑓𝑥𝑥𝐿𝐿𝑃𝑃𝐿𝐿𝑟𝑟𝑃𝑃𝑑𝑑𝑣𝑣𝑃𝑃𝑟𝑟𝑓𝑓𝑓𝑓𝑟𝑟𝑃𝑃𝑃𝑃𝑃𝑃𝑟𝑟𝑟𝑟𝑃𝑃𝑓𝑓𝑃𝑃𝑓𝑓𝑃𝑃
Equation 2-1 shows the law of Darcy. The law describes what happens during the filtration process. The flow rate describes the rate with which the beer flows through the filter. This gives the brewery an idea of how long the filtration process takes. The permeability factor of a filter describes the pressure differential across the filter bed. This is laid down by the size and porosity of the filter-aid. The pressure drop is dependent on the filtration area of the filter. One of the easiest and cost effective ways to increase the capacity of filtration and therefore also the flow rate, is using a bigger filtration area. Through first centrifuging the beer after the actual brewing process, much of the solids, which are still in the mixture, are already separated from the beer. This increases the filtration performance. The filter run length is determined by the sludge capacity, the amount of filter-aid that can be put in a filter (Buttrick, 2007). The beer viscosity is improved in the last years through malt specifications that reduce beta glucans, a chain of glucose molecules, in the wort (Buttrick, 2010).
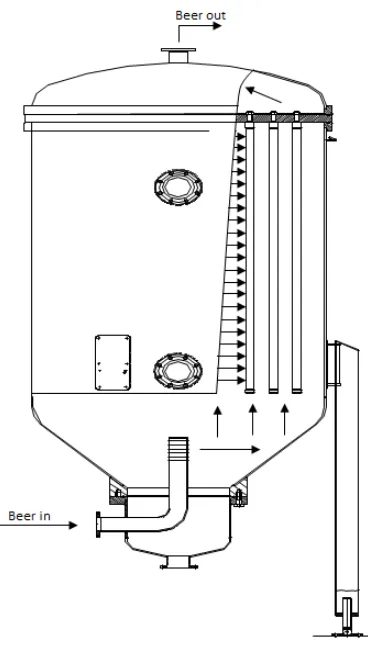
(European Brewery Convention et al., 1999). Within the process of depth-filtration beer will flow into the filter cake and the finer particles are trapped there (European Brewery Convention et al., 1999). This way only clear beer flows forward through the process. With time and when more beer passes the filter, the filter cake fills the filter and therefore has to be removed and cleaned before the process can be restarted. All the filters used in the filtration process at Grolsch are candle filters. Candle filters are vessels that encase a number of vertically mounted filter candles that are attached to a horizontal plate (European Brewery Convention et al., 1999). The candles are continuous spirals with comprised dimples, which provide spacing for the liquid flow. This type of filter can be seen in Figure 2-1.
Figure 2-1 - Candle Filter
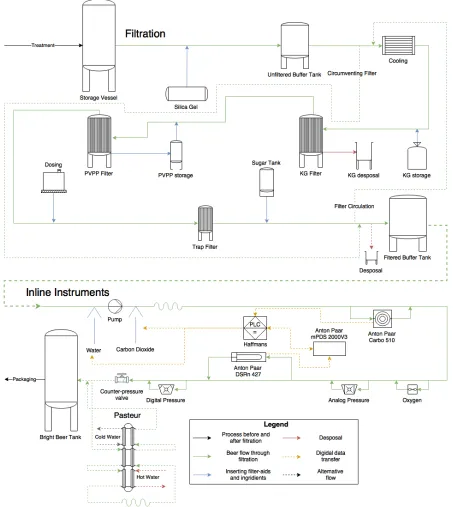
In Figure 2-2 the filtration process at Grolsch is depicted in more detail. A flow chart can also be found in Appendix B. Grolsch has three filtration lines. Line one has a lower capacity than line two and three. These are identical. In this thesis filter line two and three are described if not noted elsewhere. A table of the filter volumes can be found in Appendix C.
Figure 2-2 – Detailed Filtration Process at Grolsch
After the UBT, the beer floats through a cooling system. Cooling reduces the time necessary to insure that all haze forming substances that could change the flavor and appearance of the beer in the finished product are filtered out, since the molecules in cool beer form a cluster that makes them easily filterable (European Brewery Convention et al., 1999). This way the removal of potential haze forming materials is maximized and the shelf-life of the product is prolonged.
The next step is the Kieselguhr (KG) filter. Kieselguhr is a product made from diatomite rock or
diatomaceous earth, composed of the remains of single cell algae (European Brewery Convention et al.,
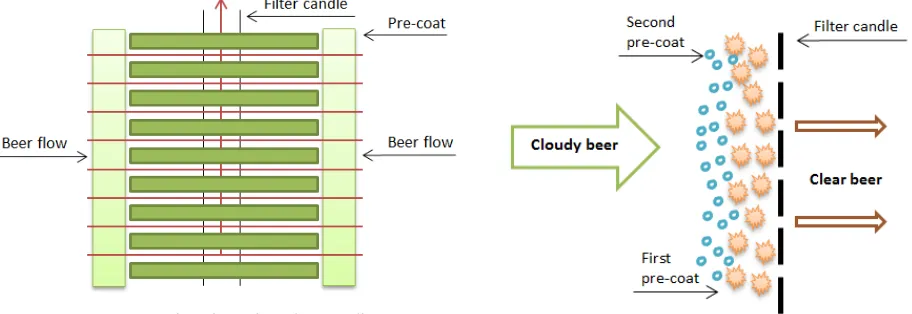
[image:21.612.77.533.372.529.2]1999). It is used to filter fine particles that would otherwise pass through and is especially designed for yeast particles. Water and kieselguhr are fed into the bottom of the filter vessel. The filter-aid then forms a cake on the outside of the candles. This process can be seen in Figure 2-3. At Grolsch, two different pre-coats of kieselguhr are used as filter-aid within the KG filter. The first pre-coat consists of rough particles and acts as a support for the second pre-coat. When the first pre-coat has surrounded the candle filters, the second pre-coat with bigger particles is inserted into the process (Figure 2-4). This way, unwanted particles are removed from the dull beer. The clear beer then flows evenly distributed into the vessel and into the filter candles. At the top of the vessel, the beer is transferred in the direction of the process flow. At the end of the filtration run, water is used to displace the remaining beer out of the filter. Once all beer is out of the vessel, the process flow within the KG filter is reversed and air is pumped into the vessel. This way, the cake is discharged and pumped into the disposal tank. This process cleans the filter at the same time.
Figure 2-3 - Beer Flow through a Filter Candle
Figure 2-4 - Beer Flow through the Pre-Coats
Further, the beer is filtered in the Polyvinylpolypyrrolidone (PVPP) filter. PVPP is often used as a fining to extract impurities (European Brewery Convention et al., 1999). During the beer brewing process it is used to remove polyphenols and thus clear beer with stable foam is produced. The filter is constructed like the KG filter. The biggest difference is that the polyvinylpolypyrrolidone can be used more than once. Other than the kieselguhr, which is pumped into the disposal tank, the PVPP filter is first, like the KG filter, cleaned with water. After that, the filter is cleaned with acid before the PVPP is pumped back into its own tank.
compatibility and the polypropylene cage and core ensure maximum mechanical stability. The filters have a retention rating from 3μm. The filter candles have to be replaced regularly depending on their usage and the hectoliters they filtered.
2.2.
INLINE INSTRUMENTS
Within the filtration process from Grolsch different instruments are used that ensure the quality of the beer. The most important instruments used for measurements, calculations and process control are:
• The Anton Paar DSRn 427 Density/Sound Velocity Transducer
- combines density and sound velocity measurement in a single compact instrument (Anton Paar, 2010).
• The Anton Paar Carbo 510 Smart Sensor
- CO2 analyzers which combines the benefits of the inline measurement with the well proven pressure-temperature-impeller method (Anton Paar, 2013).
• Haffmans Carbo-Blender
- type AGM, for automatic CO2 determination with carbonator dosing device(Haffmans, n.d.).
• The Anton Paar mPDS 2000V3 Evaluation Unit
- processor and display unit, designed for the continuous density and concentration measurement in industrial processes (Anton Paar, 2015).
Equation 2-2 - Equations for Determining Important Beer Filtration Parameters (Nielson et al., 2007)
The most important process during beer brewing is the fermentation process. Beer fermentation is a biological process in which fermentable sugars like glucose, fructose, maltose and sucrose are converted into cellular energy and during this process ethanol and carbon dioxide is produced. Original extract is the amount of sugar in the beer before fermentation:
𝑊𝑊𝑓𝑓𝑃𝑃𝑃𝑃𝑃𝑃𝑥𝑥𝑃𝑃𝑃𝑃𝑃𝑃𝑓𝑓𝑃𝑃 → 𝐴𝐴𝑃𝑃𝑓𝑓𝑓𝑓ℎ𝑓𝑓𝑃𝑃 + 𝑅𝑅𝑃𝑃𝑃𝑃𝑃𝑃𝑃𝑃𝑥𝑥𝑃𝑃𝑃𝑃𝑃𝑃𝑓𝑓𝑃𝑃3 + 𝐶𝐶𝐶𝐶2 + 𝑁𝑁𝑃𝑃𝐹𝐹𝑃𝑃𝑃𝑃𝑃𝑃𝑟𝑟𝑃𝑃 The original extract can be calculated through the strength of the wort:
𝐶𝐶𝑃𝑃𝑃𝑃𝑂𝑂𝑃𝑃𝑓𝑓𝑃𝑃𝑃𝑃𝑃𝑃𝑥𝑥𝑃𝑃𝑃𝑃𝑃𝑃𝑓𝑓𝑃𝑃 (%)
= (𝑊𝑊𝑃𝑃𝑃𝑃𝑂𝑂ℎ𝑃𝑃𝑓𝑓𝑓𝑓𝑃𝑃𝑥𝑥𝑃𝑃𝑃𝑃𝑃𝑃𝑓𝑓𝑃𝑃𝑃𝑃𝑓𝑓𝑓𝑓𝑓𝑓𝑃𝑃𝑑𝑑𝐹𝐹𝑓𝑓𝑃𝑃𝑃𝑃)/(𝑇𝑇𝑓𝑓𝑃𝑃𝑃𝑃𝑃𝑃𝐹𝐹𝑃𝑃𝑃𝑃𝑂𝑂ℎ𝑃𝑃𝑓𝑓𝑓𝑓𝑓𝑓𝑓𝑓𝑃𝑃𝑑𝑑𝐹𝐹𝑓𝑓𝑃𝑃𝑃𝑃)∗100
Based on this, Balling thought of his famous formula, which shows the relations between the original extract to the real extract and alcohol:
𝐶𝐶𝑃𝑃𝑃𝑃𝑂𝑂𝑃𝑃𝑓𝑓𝑃𝑃𝑃𝑃𝑃𝑃𝑥𝑥𝑃𝑃𝑃𝑃𝑃𝑃𝑓𝑓𝑃𝑃 (%) =
(2.0665∗ 𝑃𝑃𝑃𝑃𝑓𝑓𝑓𝑓ℎ𝑓𝑓𝑃𝑃𝑃𝑃𝑃𝑃𝐹𝐹𝑃𝑃𝑃𝑃𝑂𝑂ℎ𝑃𝑃 (% 𝑓𝑓𝑓𝑓𝑃𝑃𝑓𝑓𝑃𝑃𝑃𝑃𝑃𝑃𝑃𝑃𝑃𝑃𝑟𝑟𝑟𝑟) +𝑃𝑃𝑃𝑃𝑃𝑃𝑃𝑃𝑃𝑃𝑥𝑥𝑃𝑃𝑃𝑃𝑃𝑃𝑓𝑓𝑃𝑃 (% 𝑃𝑃𝑃𝑃𝑃𝑃𝑃𝑃𝑓𝑓)) (100 + (1.0665∗ 𝑃𝑃𝑃𝑃𝑓𝑓𝑓𝑓ℎ𝑓𝑓𝑃𝑃𝑃𝑃𝑃𝑃𝐹𝐹𝑃𝑃𝑃𝑃𝑂𝑂ℎ𝑃𝑃 (%𝑓𝑓𝑓𝑓𝑃𝑃𝑓𝑓𝑃𝑃𝑃𝑃𝑃𝑃𝑃𝑃𝑃𝑃𝑟𝑟𝑟𝑟)) ∗100
2.2.1.DENSITY AND SOUND VELOCITY TRANSDUCER
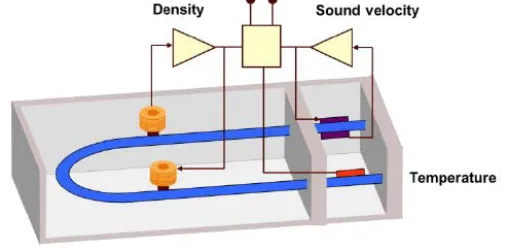
[image:23.612.179.434.455.579.2]Besides the alcoholic strength and original extract, water and CO2 are also of importance during the brewing of beer. In order to determine the concentration of all the components of a beer, the DSRn 427 combines density, sound velocity, temperature and CO2 measurements into an optimum process measurement of alcohol content, original extract and CO2. It is used to determine three concentrations in a three-component mixture.
Figure 2-5 - Density and Sound Velocity Sensor (DSRn 427) (Anton Paar, n.d.-a)
The sensor consists of a U-tube density sensor as well as an integrated sound velocity sensor and is shown in Figure 2-5. The density of a material is defined as its mass divided by the volume. With the DSRn transducer, the density measurement is based on measuring the period of oscillation of a mechanical oscillator operated at its natural frequency, precisely according to the oscillating U-tube principle (Anton Paar, n.d.-a). The density of beer is determined through measuring the periodic time of the flexural
vibration (Bismark, 2008). By means of a magneto-electrical excitation system, the U-tube is excited to a continuous oscillation at its natural frequency. The frequency is directly related to the density of the beer, which is flowing through the U-tube. At the same time sound velocity is measured over a fixed distance by an ultrasonic transmitter as well as receiver, located on one side of the U-tube (Anton Paar, n.d.-a). The velocity of propagation is determined with a repeatability of 0.01 m/s. The electronics in the U-tube measure the propagation time of ultrasonic pulses through the beer and calculate the sound velocity. Both density and sound velocity are dependent on the temperature of the beer. Therefore, the temperature has to be measured highly accurately in the U-tube and needs to be integrated in the calculations of density and sound velocity.
[image:24.612.361.502.291.464.2]In Figure 2-6 the relationship between alcoholic strength and sound velocity can be seen. With increasing strength of alcohol, the density decreases, but the sound velocity of the beer increases. In Figure 2-7 the relationship between sugar and density as well as sound velocity is described. With increasing extract, the density and sound velocity increase, too. Since the extract from beer is not a pure sugar solution but a mixture of various components, the graph of extract and sugar are not identical.
Figure 2-6 - Relationship: Alcohol and Sound Velocity (Anton
Paar, n.d.-a) Figure 2-7 - Relationship: Sugar, Density and Sound Velocity
(Anton Paar, n.d.-a) 2.2.2.CO2 SMART SENSOR
[image:24.612.77.304.293.438.2]Figure 2-8 - Measurement of CO2 Smart Sensor (Anton Paar, n.d.-a)
The CO2 content is calculated from the saturation pressure as well as the temperature, measured in the chamber. The relationship between CO2 content and saturation pressure depends on the composition of the beer as it can be seen in Figure 2-11. The CO2 content after the filtration and the CO2 content in the bottle or keg may vary due to loss of CO2 after filling or before closing the bottle or because of additional carbonization in the buffer tank.
2.2.3.HAFFMANS CARBO-BLENDER
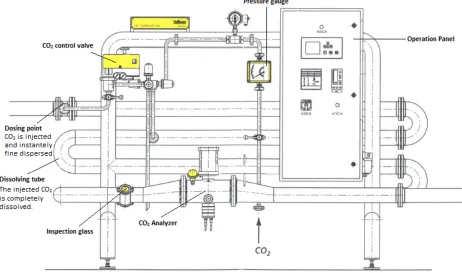
Haffmans instrument is a carbo-blender and is used for the carbonation of the beer. It can dose the feeding of CO2. The goal of carbonation is to dissolve the added CO2 as quickly and completely as possible (Haffmans, n.d.). This means that no free CO2 bubbles can be seen in the beer. The dissolving of the CO2 can be visually checked through an inspection glass in the outlet of the dissolving tube.
Figure 2-9 - CO2 Dosing Device
The instruments consist of different parts, which can be seen in Figure 2-9. The CO2 analyzer is not installed
at Grolsch. Instead of the analyzer, the Carbo 510 measures the CO2-content and communicates this value
[image:25.612.76.538.365.638.2]stores important set-points. The recipes for the beers are also stored here. The PLC also monitors the blending of water and feeding of CO2. The Carbo 510 gives its measurements to the PLC. The measurements are then used to inject the right amount of CO2 into the main beer line. In the inlet of the dissolving tube CO2 is injected and fine dispersed with several mixers. In addition, it sends the CO2-values to the mPDS. The mPDS sends the PLC in return the alcoholic strength and calculated original extract. With these values the PLC can calculate the water that needs to be added. The advantages of the beer analysis after the filtration are that the original extract measurement requires a known CO2 concentration and is therefore to be installed directly after the CO2 Doing Device.
2.2.4.EVALUATION UNIT
[image:26.612.117.489.311.498.2]The Evaluation Unit is a powerful processor and display unit, designed for the continuous density and concentration measurement in the beer filtration process. Next to the calculation of the basic properties within beer filtration, specific parameters can be stored for temperature compensation, concentration determination, alarm limit monitoring and adjustment of measuring values. This measurement is useful for continuous beer quality monitoring. How the Evaluation Unit and the inline instruments are installed in the process flow can be seen in Figure 2-10.
Figure 2-10 - Installation of the Beer Monitor (Anton Paar, n.d.-b)
When DSRn 427 and Carbo 510 are inserted into the beer line, the measurements of the two instruments can be transferred to the Evaluation Unit by wired cables. The calculations of the alcoholic content and the original extract can be made more accurate since the values from Carbo 510 can be used to compensate for the CO2 content. Without Carbo 510 the calculations can be made as well, but then an estimate is used for the CO2 content.
Figure 2-11 - Measuring Alcohol and Extract by Sound Velocity and Density (Anton Paar, n.d.-a)
2.3.
CONCLUSION
3.
INFLUENCES ON THE FILTRATION PROCESS
This chapter identifies and describes the possible causes for the inaccurate measurements of the inline instruments (Section 3.1). Further, it analyzes their influence on the filtration process and categorizes them (Section 3.2) and finally it presents conclusions on the origin and impact of the influencing factors (Section 3.3).
3.1.
POSSIBLE CAUSES FOR THE INACCURATE MEASUREMENTS
Identifying the possible causes of the inaccurate inline measurements is the main objective of this research. The possible causes, which are being identified in this chapter, are ideas of stakeholders and do not necessarily all need to be relevant for this thesis. The operators, laboratory workers and employees of the companies that produce and install the inline instruments, are the most relevant stakeholders and involved in this step of the research.
3.1.1.CAUSE AND EFFECT OF THE POSSIBLE CAUSES
Since it is challenging to find out root causes for the inaccurate measurements, an Ishikawa Diagram is used as a helping tool. The Ishikawa diagram in Figure 3-1 represents the possible causes and their effects
for Grolsch’s current problem. The main problem at Grolsch can be identified as the inaccurate inline
measurements during the filtration process. Ishikawa diagrams help to structure one’s thoughts about possible causes and the reasons behind them (Sondermann, 1994). In the end, they lead to a cause and effect diagram and help to identify potential factors causing the overall effect. The diagram for Grolsch is sketched to show the main and side causes of the problem identified above.
The diagram is made with the help of the employees from the Brewing Department. First, individual interviews are held with the operators. Here they identify problems. Then, the problems are summarized and plotted in the Ishikawa diagram. Next, a workshop is held with the manager of the Brewing Department and a few of the operators. Here the Ishikawa diagram is shown. At the meeting the problems are specified and some new problems are added.
In the Ishikawa diagram in Figure 3-1 machinery, methods, manpower, material, measurements and
management are categories that contribute to and have an influence on the main problem. For each of
the categories causes and sub-causes are found. The category machinery addresses all issues with the filters as well as inline instruments that evaluate the process and control the blending. The causes listed under manpower mainly deal with the operators and their behaviors, attitudes, as well as work style. Under materials all possible causes are added that focus on the ingredients that are needed for brewing beer and the quality of the beer that arrives at the filtration process. The category methods include all methods that the workforce uses, for example maintenance and calibration. In the category
measurements all causes that involve the values and measurements, taken during the process, as well as
the factors that influence them, are listed. Finally, the category management includes possible causes that are based on the coordination and structure of the filtration process.
3.1.2. DESCRIPTION OF THE POSSIBLE CAUSES
[image:30.612.92.512.210.407.2]During the previous research step some possible causes for the inaccurate measurements became apparent. The causes are researched by talking to the stakeholders as well as observing the process flow. The possible causes, which are shown in the Ishikawa diagram, are now combined logically with problem statements. The combination is possible by incorporating causes that belong to the topic and visualized by the colors. All possible causes for the inaccurate measurements at Grolsch can be seen in Table 3-1. Every problem will be further analyzed except problems concerning human commitment. This research focusses solely on the technical aspects, because they are most relevant.
Table 3-1 - Possible Causes for the Inaccurate Measurements
Possible Causes Further referred to as:
1 Bad maintenance and calibration of the inline
instruments Maintenance and Calibration
2 Incorrect use of product numbers and wrong or
irregular off-set of the instruments Product-Specific Adjustment 3 Wrong installation of instruments in the filter line Instrument Installation 4 Wrong regulation within the automation system Regulation
5 Pressure difference through pasteurizing Pressure Difference 6 Long reaction time from the automation system
and valves Reaction Time
7 Unstable value of important parameters Important Parameters 8 At times the batches are too small Batch Sizes
9 Brewing process provides unstable beer Unstable Lager Beer 10 Human commitment
This is the first step of the Methodological Triangulation. In this research the method is implemented as follows. Methodological Triangulation uses various methods and insights in order to check the results of one and the same subject. In this section the first phase of the process starts with the initial data gathering. The data gathering is based foremost on qualitative research. In particular, interviews and group discussions are held. The interviews are primarily held with operators, because they have the best insights into the process. In Section 3.2 the next phase of Methodological Triangulation is described.
1 - Maintenance and Calibration
Once a year, maintenance work needs to be carried out on the inline instruments. This means that the whole system has to be cleaned. Heavily worn and defect parts are replaced. This includes the diaphragms and O-rings, which need to be replaced every year. The employees do not know if this maitenance work happens according to the regulations. From Grolsch, there is no person who takes responsibility in this matter. They also don’t know who the contact person from Anton Paar is.
2 - Product-Specific Adjustment
Grolsch the inline instruments are adjusted according to labratory reference values. Since the laboratory instruments are more often calibrated, the employees assume that these values are more accurate. The reasons for deviations are especially the different measuring methods used in the laboratory and process as well as fluctuating process conditions. A product-specific adjustment is done while the line is in normal operation. The mPDS Evaluation Unit is reset according to the off-set and gain factor. This is shown in Figure 3-2. The product-specific adjustment is product number specific.
Figure 3-2 - Offset and Gain-Factor (Anton Paar, n.d.-a) 3 - Instrument Installation
[image:31.612.236.376.459.561.2]The installation of all inline instruments is described in the instruction manuals. There are a few things that have to be considered. On the one hand, the device has to be away from a turn. This is shown in Figure 3-3. After a turn, turbulences arise within the beer. If during this, measurements are taken the instruments will be exposed to rapid variation of pressure and flow velocity. This is why measurements can be imprecise.
Figure 3-3 - Distance from a Turn (Anton Paar, 2013)
4 - Regulation
The measurements from the inline instruments are used within the automation system. They are of value for calculating the amount of water and CO2 that needs to be added. It is important that the right measurements are used for these calculations. At Grolsch it is not clear if the values are taken from the right measurements. Employees speculate that there could be inconsistencies or wrong connections. 5 - Pressure Difference
Pasteurization is a process that reduces the amount of bacteria in beer and other liquids through heating
[image:32.612.177.433.394.559.2]the liquid. Some products at Grolsch, like the Weizen, are not filtered but pasteurized. It therefore circumvents the filterstreet and only passes the last part of the line with the inline instruments. As with the other beers, the inline instruments calculate the alcoholic strength and the original extract to add the necessary amount of water and CO2. After blending, the beer flows to the pasteur. The big problem with the pasteur is the pressure that is needed for this process. While the inline instruments need a pressure of five bar to dissolve the CO2 in the beer, a pressure of twelve bar is needed during the pasteurization. If the pressure during pasteurization is higher or lower than the set-point, the beer flows too fast or slow through the process and not all or too many bacteria are killed. In order for the quality of the beer to be acceptable, the pump installed in the pasteurizing process, sets the pace. This means that the inline instruments do not work within their required operating range. If the pressure in the pipe is outside of this range, the operating accuracy is lower which means that greater deviations and greater total error are to be expected. For beers that are pasteurized, this means that the measurements of alcoholic strength and original extract are less accurate than for not pasteurized beers. This can be seen in Figure 3-4. The figure shows the probabilty distrubution of Weizen, a pasteurized products, and Pils, a filtered product.
Figure 3-4 - Difference in Standard Deviation - Weizen and Pils 6 - Reaction Time
During the filtration process, water and CO2, amongst others, are added to the process. The feeding and blending depends on the values of the inline instrument measurements in the passing beer. Sometimes, during the process the values have to be changed manually in the automation system. The values mainly have to be changed because of the difference in the inline and laboratory measurements. Described below is an example for changes that have to be done.
to change the values in the automation system manually. The opposite has to be done if the alcoholic strength is too low. Other values that have the same influence on the process are the original extract and CO2. If the values of the measurements are too low or too high the values have to be adjusted. Here, the main problem is that the operators noticed that the valves need a long time to react to changing conditions. They indicate that it occasionally takes some time for the flow of the blending and feeding devices to adjust to the values that were manually adjusted.
7 – Important Parameters
For the filtration process a lot of parameters are of importance. A distinction has to be made between process condition parameters and sample beer parameters. Process condition parameters are as the name implies, parameters that describe the condition of the process. Examples are pressure, flow speed or temperature. Sample beer parameters, on the other hand, are the parameters that are important for the final product. They control the target values of the recipe and are the deciding factor for blending. Important sample beer parameters are original gravity, alcoholic strength as well as the CO2 content of the beer. For each instrument and recipe, the target values are different. Unfortunately, some values are often fluctuating. An example for this is the temperature of the unfiltered beer. Before the actual filtration process begins, the beer needs to be cooled to zero degrees. But sometimes the beer in the storage vessel is already cooler than zero degrees. If this beer arrives at the filters, it cannot be filtered consistently since ice-crystals are clogging the filters. Because not all holes can be clogged, some of the beer still passes the filter. The values that the inline instruments measure of this passing beer, are not accurate since the beer is too cold.
8 – Batch Sizes
The operators also named small batch sizes as a part of the problem with the inaccurate measurements. In the beginning of the filtration process, the values of original extract and alcohol still fluctuate. This happens because the beer on the bottom of the vessel is mixed with water. Since the storage vessels are pumped empty from the bottom, the same liquid also flows first through the pipes and towards the FBT. The problem with small batches is that the time to compensate for the unstable flow in the beginning, is short. Furthermore, operators are only able to take one or two samples to adjust the values. By the time the sample is analyzed, two thirds of the product are already in the FBT.
9 - Unstable Lager Beer
Lager Beer is beer which has not yet been filtered. This beer arrives at the UBT from the brewing process.
3.2.
INFLUENCE OF THE POSSIBLE CAUSES ON THE FILTRATION PROCESS
In this section the possible causes are analyzed and evaluated. This is the second phase of the Methodological Triangulation. Here the results found earlier are checked through follow up interviews with other operators and the outcomes are reviewed. The interviews are focused on the analysis of the problems and are highly structured. Again the operators, but also technicians, laboratory staff and employees from the companies that produce the inline instruments, are interviewed. Then the findings are reviewed and, where possible, verified by quantitative research. A categorization, based on the results of Methodological Triangulation is made in the end.
1 - Maintenance and Calibration
Through contacting Anton Paar it became apparent that Grolsch has a maintenance contract with the company. All instruments are calibrated after ordering them and before they are installed in the filter line at the company. The calibration happens with water and air at a certain temperature. After that there are no more calibrations. Exceptions are made if the process conditions of the instrument drastically change or the instrument is installed in a different area of the process. Then the instrument can be sent to Austria for a new calibration. This is not the case at Grolsch.
There are different types of maintenance: Run-to-breakdown Maintenance, Preventive Maintenance and
Condition-based Maintenance (Slack, Brandon-Jones, & Johnston, 2013). Run-to-breakdown Maintenance
means allowing the instrument to continue working until it fails and then repair or replace it. Preventive Maintenance eliminates the chance of a possible failure by checking, cleaning and replacing the instrument parts regularly in pre-planned intervals. Condition-based Maintenance only performs maintenance when the facilities require it. Anton Paar uses a mix of Preventive Maintenance and Run-to-breakdown Maintenance. Once a year, Anton Paar comes to check all the instruments. Here the condition of all parts are checked as well as the electric signals. The parts of the instruments are usually not replaced if they do not show significant problems and are used until they break down. The responsibility of maintenance is thus with Anton Paar and has recently been done successfully. In cooperation with Anton Paar it can be concluded that this is not a possible cause for the inaccurate measurements.
2 - Product-Specific Adjustment
Figure 3-5 - Off-set of Measurements
Which products belong to which product group is dependent on the adjustment values that have to be stored in the mPDS. The composition of a product influences its adjustment. Especially, the density of a product is dependent on its components. Alcohol has a higher index of refraction than water. This means that refractometer measurements, which are made on a sugar solution once fermentation has begun, result in a higher reading than the actual solids content. Ethanol is less dense and lighter than water. An ethanol-sugar-water solution gives an original extract measurment that is low compared to the dissolved sugars (Chu & Thompson, 1962). This means, that the density of products with high sugar and alcohol compensate each other and the alcoholic strength, original extract and sugar content is shown lower than it is in reality. This is why Radlers and Pils beers should never have the same Haffmans number.
Table 3-2 - Filtration Restrictions
At Grolsch the Haffmans numbers are not assigned appropriately. Sugar and non-sugar beers are put into
one group. Furthermore, products have different numbers on different filter streets. Even the groups to
Name FL1 FL2 FL3 Name FL1 FL2 FL3
Pils Bnl 1 1 1 Miller (4,7%) 1 5 1
Pils Export 1 1 1 Tyskie 1 8 1
Navigator 8.0% 1 1 Lech 1 12 1
Palm 1 1 Pale Ale 1
Premium Weizen 1 1 Weizen Cranberry 1
Admiral (oud) 1 1 Herfstbok 3 3
Kornuit fles/blik 1 1 Maximator / Kanon 5 4 4
Nav Black 1 1 Navigator 10% / Gladiator 5 11 1
De Klok Bier 1 1 Malt-Stender 9 6
Miller (4,4%) 1 5 Radler 2% 14 14
Lentebok 1 3 Radler 0.0% 14 14
IPB High Gravity bulk 1 13 Radler 0.0 + Sirup 14
FL = Filter line
HN = Haffmans Number
Possible
[image:35.612.164.450.469.674.2]three it belongs to Grolsch’s Pils beers, on filter line two it has a Haffmans number on its own and on line one it is grouped with the Maximator, another high gravity beer. All this can be seen in Table 3-2. Establishing a more stable Haffmans number allocation, where products have the same number on each filter line and are allocated to the same group on each line, is important. This has as an effect that the product-specific adjustment is done in a more stable environment. For the adjustment procedure, Anton Paar has new Excel sheets that can make the work easier for the operators.
3 - Instrument Installation
After inspecting the installation of the instruments with specialists from Anton Paar, it seems that the two installation requirements described in the previous section have no influence on the process at Grolsch.
Anton Paar recommends that instruments are installed at least 70 cm away from a turn in the pipe system.
At Grolsch the Carbo 510 is installed approximately 90 cm away and therefore we can act on the
assumption that no problems arise here.
The order of installation also does not trouble the efficiency of the process. The flow speed at Grolsch is high enough that the bubbles are dissolved quickly in the process. Even the flow speed on filter line one is still high enough. Next to that, the distance between the two instruments is approximately 70 cm, which gives the CO2 bubbles enough space and time to dissolve in the beer. For those reasons we can also act on the assumption that the wrong implementation of the instruments is no possible cause for the inaccurate measurements.
4 - Regulation
After looking at the connections of the inline instruments the regulation becomes clearer. With the help of the instrument technicians the overview of the filtration process could be made, which can be seen in Section 2.1.. The Proleit system handles the automation of the whole brewing process. The Brewmaxx system is used to make recipes and to retrieve data from the process. Proleit and Brewmaxx work closely together. If a new filter run starts, they give a signal to the Haffmans PLC. This instrument now knows which beer is brewed and gives the Haffmans number to Anton Paar’s mPDS Evaluation Unit. The product-specific adjustment values have to be stored manually in the mPDS since Haffmans only allocates a Haffmans number through the use of five bits. As far as we can see, this process is working correctly. Moreover, the connections showed that Haffmans’ and Anton Paar’s instrument do not work together. They only transfer data to each other. The data from the Carbo 510 is transferred to the mPDS and then the measurements from the Carbo 510 and DSRn 427 are used for the calculations of alcoholic strength and original extract and are then transmitted back to Haffmans. The blending values are also calculated with these transmitted measurements. After understanding this process better, it can be assumed that there are no problems within the regulation and data transfer.
5 - Pressure Difference