Where Has the Currency Gone? And
Why? The Underground Economy and
Personal Income Tax Evasion in the U.S.,
1970-2008
Cebula, Richard
Jacksonville University
12 April 2014
Online at
https://mpra.ub.uni-muenchen.de/55284/
WHERE HAS THE CURRENCY GONE? AND WHY?
THE UNDERGROUND ECONOMY AND PERSONAL INCOME
TAX EVASION IN THE U.S., 1970-2008
By Richard J. Cebula, Jacksonville University
Abstract
Unaccounted for currency in the U.S. is argued to reflect the presence of widespread income tax evasion. This empirical study seeks to identify determinants of the underground economy in the U.S. in the form of federal personal income tax evasion over the period 1970-2008. In this study, we use the most recent data available on personal income tax evasion, data that are derived from the General Currency Ratio Model and measured in the form of the ratio of unreported AGI (adjusted gross income) to reported AGI. Other studies of federal income tax evasion for the U.S. are dated and do not use data this current. It is found that personal income tax evasion was an increasing function of the maximum marginal federal personal income tax rate, the percentage of federal personal income tax returns characterized by itemized deductions, and unpopular military engagements, in this case, the War in Iraq, and a decreasing function of the Tax Reform Act of 1986 (during its first two years of being implemented), the ratio of the tax free interest rate yield on high grade municipals to the interest rate yield on ten year Treasury notes (as a measure of the incentive effect of a better return to tax avoidance, which is legal), and higher audit rates of filed federal income tax returns (as a measure of risk from tax evasion) by IRS personnel.
J.E.L. classifications: G18, G28, H26
Keywords: missing currency; tax evasion; incentives; disincentives
I. Introduction
U.S. households and firms admit to holding only about 15% of the total known stock of U.S. currency outside the banking system (Cebula, 2011). It is suspected that much of this disparity between the actual size of the stock of currency in the U.S. and the accounted for (admitted to) holdings of U.S. currency is attributable to the currency’s being used in transactions that are not reported to the IRS (Feige, 2009). In other words, unaccounted for currency in the U.S. is argued to reflect the presence of the so-called “underground economy” in the form of widespread personal income tax evasion.
2
studies are empirical in nature, deriving the data largely (if not entirely) from the experiments. Certain of these studies indicate an aversion to the prospect of being audited while others reveal a lack of such risk-averse behavior; still others imply that taxpayers may be averse to tax evasion on moral grounds. Additionally, the incentive to evade taxation by underreporting income provided by higher marginal income tax rates is also revealed in several of these studies. Third, there are those studies that largely or in some cases exclusively adopt what is referred to as "official data,” i.e., data obtained from the IRS (or its counterpart outside of the U.S.) and/or some other “official source,” i.e., a government agency. Among, the types of information thusly obtained and analyzed are data on income tax evasion, income tax rates, and audit rates. Such studies endeavor typically either seek to estimate the aggregate degree of tax evasion or to identify the determinants thereof (Tanzi, 1982, 1983; Clotfelter, 1983; Carson, 1984; Pyle, 1989; Erard and Feinstein, 1994; Feige, 1994, 1989, 1996; Cebula, 2001, 2004, 2008, 2011; Ali, Cecil, and Knoblett, 2001; Ledbetter, 2004; Alm and Yunus, 2009; Cebula and Coombs, 2009; Cebula, Coombs, and Yang, 2009).
In this literature, it is widely believed that the degree of federal personal income tax evasion in the economy as a whole is positively affected by income tax rates (Tanzi, 1982; Clotfelter, 1983; Feige, 1994). Interestingly, Yaniv (1994) characterizes Clotfelter (1983) as “the most relevant study” with respect to the impact of income tax rates on tax evasion, whereas Cox (1984) questions his findings. In any event, this perspective is simple: the higher the income tax rate, the greater the benefit (in terms of a reduced tax liability) from not reporting taxable income, ceteris paribus. It is also widely accepted that the greater the risk associated with underreporting or not reporting taxable income, the less the degree to which economic agents will choose either to not report or to underreport their taxable income (Friedland, 1982; Spicer and Thomas, 1985; De Juan, 1989; Errard and Feinstein, 1994; Cebula and Coombs, 2009).
This study seeks to add to the rich literature on income tax evasion by identifying key determinants of federal personal income tax evasion using data up to and including the year 2008. With the exception of a single study, the most recent year of tax evasion behavior in the U.S. that has been formally studied is 2005 (Cebula, 2011); for the most part, earlier studies of the U.S. do not go beyond the year 1997. Thus, by investigating tax evasion through 2008, the study period is more current than the existing published literature. The framework/model is presented in Section II. Section III provides the formal empirical analysis, whereas Section IV provides a summary of the study findings and certain policy observations.
II. A Benefit-Cost Model of Under-Reporting Taxable Income
In this study, the relative probability that the representative economic agent will under-report his/her taxable income to the IRS (pur) is treated as an increasing function of the expected gross benefits to the agent of under-reporting taxable income, egb, and as a decreasing function of the expected gross costs to the agent of under-reporting taxable income, egc. Thus, the ratio of the probability of under-reporting taxable income to the IRS, pur, to the probability of fully reporting taxable income1 to the IRS, (1-pur), is described for the representative economic agent by:
pur/(1-pur) = f(egb, egc), such that fegb > 0, fegc < 0 (1)
Expressing the probabilities described in equation (1) in relative terms possesses the virtue that it thereby reflects the form of the tax evasion data, i.e., data where (as described below in Section III) the aggregate degree of federal personal income tax evasion is expressed in such relative terms.
The Expected Gross Benefits of Under-Reporting Taxable Income
The expected benefits of income tax evasion arguably can assume two different forms: expected
direct benefits and expected secondary benefits. Expected primary or direct benefits of income tax evasion can be regarded as obvious or transparent. Expected secondary benefits are less tangible but can nonetheless be very real.
a. Expected Direct Benefits of Under-Reporting Taxable Income
The best example of direct benefits from income tax evasion would be the value of the taxes not paid to the IRS. To the extent that an individual engages in income tax evasion and underpays income taxes by, say, $X, those $X are a direct benefit to the individual, who can (in theory) spend and/or save the $X. It follows that the higher the marginal federal income tax rate that the
individual is subject to, the greater the pecuniary direct benefit from underreporting his or her income and/or from exaggerating tax deductions by any given amount. For instance, if the maximum marginal income tax rate is 10 percent, tax evasion in the amount of $5000 would be expected to directly yield the tax evader $500; however, if the individual faced a 40 percent income tax rate, the expected direct benefit of this degree of tax evasion would be $2,000. Thus, it is logical to deduce that, ceteris paribus, the higher the maximum marginal income tax rate faced by a
taxpayer, the greater the incentive to engage in income tax evasion because the higher that income tax rate, the greater the expected benefits of the tax evasion behavior.
It is standard in the tax evasion literature to hypothesize that the gross expected direct benefits from not reporting income to the IRS are an increasing function of the federal personal income tax rate (Tanzi, 1982; Clotfelter, 1983; Feige, 1994). To reflect the federal personal income tax rate, this study adopts the maximum marginal federal personal income tax rate (MAXMARGTX). This measure of the income tax rate is adopted because it can be argued that it not only is an actual income tax rate but also reflects to some degree the extent to which the income tax rate schedule at any point in time is progressive.
4
(PCTITEM),2 the greater the degree to which itemized deductions are exaggerated and hence the greater the direct expected benefits of federal personal income tax evasion/under-reporting taxable income. Interestingly, this variable, which reduces taxable income, has been effectively ignored in the official tax evasion literature to date.
Whereas higher income tax rates and the opportunity to claim exaggerated itemized deductions can yield expected direct tangible benefits from income tax evasion, there is at least one course of action that can tangibly reduce the expected direct benefits of income tax evasion. Moreover, it is a legal course of action, namely, it is legal tax avoidance. One avenue through which this course of action is made possible in the U.S. is the existence of the municipal bond market, where qualified bonds issued by cities, counties, and states in the U.S. pay interest that is free from federal income taxation to the owners of record of such bonds.3 In particular, following Cebula (2004), it can be argued that the greater the ratio of tax free interest rate yield on high grade municipals relative to
taxable interest rate yield such as that on 10-year U.S. Treasury notes, TFTEN, the greater the benefits of tax avoidance, which is legal, and hence the less the expected direct benefits of tax evasion, which of course is illegal.
b. Expected Secondary Benefits of Under-Reporting Taxable Income
Aside from the issues of tax rates and itemization of deductions, persons who have taxable income may be able in certain cases to derive secondary benefits from income tax evasion behavior, i.e., from under-reporting taxable income. For example, if people disapprove of the way in which the federal government is spending their tax dollars, they may be angered or frustrated. To relieve this anger and/or frustration, they may consider income tax evasion as a means of expressing this anger and/or frustration (Feige, 1994).
Consider the case of the U.S. military being engaged in an unpopular war. For example, there is empirical evidence (Cebula, 2001) that the unpopularity of the Vietnam War so angered the public that many chose to underreport their income and/or exaggerate their itemized tax deductions. This form of income tax evasion behavior was undertaken because of the disapproval by much of the U.S. public of the U.S. involvement in and expenditures to finance the Vietnam War using their tax dollars. As the Vietnam War raged on, at least some portion of the public received secondary
benefits/gains from the experience that they were withholding financing of that military action. Similarly, it is hypothesized in the present study that the U.S. military involvement in Iraq, i.e., the War in Iraq (IRAQWAR), that began in 2003 and was still raging on through and beyond the end of the study period for the present study was very unpopular with the U.S. populace as a whole. Indeed, Cebula, Cook, and Issa (2007), found strong empirical evidence that the War in Iraq was very unpopular with a large percentage of the U.S. population. Hence, the War in Iraq is hypothesized here to have created a circumstance for people to express their dis-satisfaction by engaging in a greater degree of income tax evasion that yielded them a secondary gain from such.
Thus, the expected gross direct and secondary benefits from income tax evasion are expressed
2 Instead of claiming the “standard deduction.”
3 In states which impose a state income tax, there is an exemption from those state taxes for
as:
egb = egb (MAXMARGTX, PCTITEM, TFTEN, IRAQWAR) (2) c. Expected Gross Costs of Under-Reporting Taxable Income
The expected gross costs of not reporting or under-reporting taxable income to the IRS and/or of reporting exaggerated itemized deductions to the IRS are hypothesized to be an increasing function of the expectedrisks/costs thereof (Pestieau, Possen and Slutsky, 1994; Erard and Feinstein, 1994; Caballe and Panades, 1997). In this study, to the representative economic agent, the expected risks/costs from from underreporting taxable income to the IRS are enhanced by an increase in
AUDIT, the percentage of filed federal personal income tax returns that is formally audited by IRS examiners/personnel, ceteris paribus. Indeed, the experience of an IRS tax audit could imply non-pecuniary ("psychic") costs (such as psychological stress) as well as direct non-pecuniary costs (including outlays for attorneys and/or other representation such as accountants or financial advisors, along with the value of one's own time) above and beyond any potential added taxes, penalties, and interest assessed by the IRS. Hence, this study adopts the probability of a formal audit as a measure of risk to the would-be tax evader.4
Hence, the expected gross costs of engaging in income tax evasion is represented in this study by:
egc = egc (AUDIT) (3)
d. A Control Variable: The Tax Reform Act of 1986
In 1987, Musgrave observed (1987, p. 59), “The Tax Reform Act of 1986 is the most sweeping reform since the early 1940s…” Indeed, the TRA [Tax Reform Act] did introduce a number of reforms, many of which are outlined in broad terms in Barth (1991), Barth and Brumbaugh (1992), Ott and Vegari (2003), and Sanger, Sirmans, and Turnbull (1990). For example, as observed in Ott and Vegari (2003, p. 279), “The Act introduced major cuts in the personal tax rate. When fully effective (1988), only two tax brackets set at 15 and 28 percent, were to replace the 14 bracket tax schedule with rates in the range of 11 to 50 percent...[while it] broadened the tax base by reducing the itemized deduction.” Furthermore, as Barth (1991, pp. 45, 124) observes, among other things, under the TRA the 10 percent investment tax credit for the purchase of equipment was repealed, and the “life” of the investment was increased for depreciation purposes. Thus, it is hypothesized here that at the time the TRA was being enacted and being fully implemented (1986-1987), there were many complex and new provisions added to the U.S. Internal Revenue Code. Consequently, taxpayers in general, including would–be tax evaders, were unfamiliar with the sweeping changes in IRS policies. It logically follows that not only honest taxpayers but also those contemplating income tax evasion required time to climb the “learning curve” associated with the TRA, resulting in at least some temporary tempering of the aggregate degree of federal personal income tax
4 Ideally, IRS penalty assessments could also be adopted as a measure of the risk associated with
6
evasion. The temporary decline is attributable to the fact that it would likely take at least some time for taxpayers to adequately understand and make adjustments to the newly revised Internal Revenue Code. Consequently, it is hypothesized here that, for the period when the TRA was initially implemented, 1986, through the year the TRA became “de factofully effective,” 1987 (Barth, 1991; Barth and Brumbaugh, 1992), the value of egb was reduced. Accordingly, (2) above is replaced by (4):
egb = egb (MAXMARGTX, PCTITEM, TFTEN, IRAQWAR, TRA) (4)
e. The Synthesized Model
To express the full model, simply requires substituting from equations (3) and (4) into equation (1) yielding:
pur/(1-pur) = f(MAXMARGTX, PCTITEM, TFTEN, IRAQWAR, TRA, AUDIT) (5)
Let AGI represent the actual total value of the aggregate federal adjusted gross income in the economy, i.e., AGI=UAGI+RAGI, where UAGI is the dollar size of the unreported aggregate federal adjusted gross income in the economy,5 and RAGI is the dollar size of the reported aggregate federal adjusted gross income in the economy. It logically follows that the relative degree of aggregate income tax evasion can be given by: (pur)/(1-pur) = UAGI/RAGI. Thus, it follows that equation (5) can be replaced by equation (6):
UAGI/RAGI = f (MAXMARGTX, PCTITEM, TFTEN, IRAQWAR, TRA, AUDIT) (6)
Equation (6) constitutes the foundation for the empirical model considered in the next Section of this study.6 For the convenience of the reader, Table 1 summarizes the expected impact of each of these explanatory variable on income tax evasion.
III.Empirical Analysis
a. The Basic Reduced-Form Empirical Model
Based on the framework provided in equation (6) above, the following reduced-form equation is to be estimated initially:
(UAGI/RAGI)t= a0 + a1MAXMARGTXt-1+ a2 PCTITEMt-1+ a3 TFTENt-1 + a4 IRAQWARt
5 For an explanation of how unreported adjusted gross income is calculated using the General
Currency Ratio model, see Feige (2009).
6 Clearly, UAGI = (pur)*AGI and RAGI = (1-pur)*AGI. It then follows that:
UAGI/RAGI = (pur)*AGI/(1-pur)*AGI = (pur)/(1-pur). Substitution of UAGI/RAGI for pur/(1-pur)
+ a5 TRAt + a6 AUDITt-1+ u (7)
where:
(UAGI/RAGI)t = the ratio of the aggregate unreported federal adjusted gross income in year t to
the aggregate reported federal adjusted gross income in year t, expressed as a percent;
a0 = constant term;
MAXMARGTXt-1= the maximum marginal federal personal income tax rate in year t-1, expressed as
a percent;
PCTITEMt-1 = the percentage of federal personal income tax returns that included Schedule A,
itemizing deductions, in year t-1;
TFTENt-1 = the ratio of the average interest rate yield on high grade tax free municipal bonds in year
t-1 to the average interest rate yield on 10-year Treasury notes in year t-1, expressed as a percentage;
IRAQWARt = a binary (dummy) variable for the 2003 through 2008, during which the U.S. was
involved in the war in Iraq; IRAQWARt = 1 for the year 2003 through 2008 and IRAQWARt = 0
otherwise;
TRAt = a binary (dummy) variable for the years 1986 and 1987: TRAt =1 for the years 1986, 1987
and TRAt =0 otherwise;
AUDITt-1= the percentage of filed federal personal income tax returns in year t-1 that was subjected
to a formal IRS audit involving IRS examiners; and
u = stochastic error term.
The study period runs from 1970 through 2008, reflecting availability of the data used in the analysis. The data are annual. For the interested reader, descriptive statistics for the study period for each of the variables are found in Table 2. Finally, a group unit root test (which assumes a common unit root process) reveals that the variables in the model are stationary in levels over the study period.7
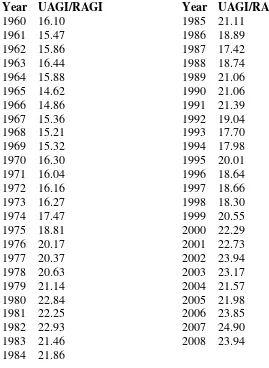
The series adopted to measure income tax evasion, in this case represented by the variable (UAGI/RAGI), were obtained from Feige (2009). Based on the General Currency Ratio (GCR) model, Feige (2009) estimated the ratio of aggregate unreported adjusted gross income to aggregate
reported adjusted gross income, using a 1973 IRS estimate for this ratio as the baseline in his computations. These data are provided in Table 3. The data for MAXMARGTX were obtained from the Internal Revenue Service (2010, Table 6). The AUDIT and PCTITEM data were obtained from the Government Accounting Office (1996: Table I.1) and the U.S. Census Bureau (1994, Table 519; 1998, Table 550; 1999, Table 556; 2001, Table 546; 2010, Table 469). The data for the variable TFTEN were obtained from the Council of Economic Advisors (2010, Table B-73). The
TRA and IRAQWAR variables are binary (dummy) variables; the Tax Reform Act of 1986 was actually signed into law by President Reagan in October of 1986.
b. The Estimation Results
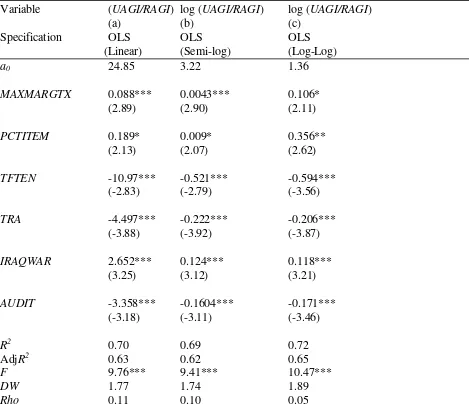
In the linear estimation of equation (7) in column (a) of Table 4, all six of the estimated coefficients exhibit the expected signs. Furthermore, five of these estimated coefficients are
8
statistically significant at the 1% level, and the remaining one is statistically significant at the 5% level. The coefficient of determination (R2) is 0.70, so that the model explains approximately seven-tenths of the variation in the independent variable. Based on the DW and Rho statistics, there is no concern regarding autocorrelation. Finally, the F-statistic is statistically significant at the 1% level, attesting to the overall strength of the model.
According to the results provided column (a) of Table 4, the coefficient on the maximum marginal federal personal income tax rate variable (MAXMARGTX) is positive and statistically significant at the 1% level. Thus, as expected, the higher the maximum marginal federal personal income tax rate, the greater the expected benefits of tax evasion and hence the greater the extent of that income tax evasion. This finding is consistent with most previous studies of income tax evasion using official data (Ali, Cecil, and Knoblett, 2001; Cebula, 2001, 2004; Clotfelter, 1983; Feige, 1994; Klepper, Nagin, and Spurr, 1991; Tanzi, 1982, 1983).
The estimated coefficient on the PCTITEM variable is positive and statistically significant at beyond the 5% level. This finding implies that the greater the percentage of taxpayers that itemizes their personal deductions (on Schedule A of Form 1040), the greater the degree to which taxable income is under-reported and hence the greater the degree of aggregate federal personal income tax evasion. This finding has not been researched in the literature to date.
The estimated coefficient on the tax free/taxable interest rate variable, TFTEN, is negative, as hypothesized, and statistically significant at the 1% level, providing compelling empirical evidence that the greater the rewards for legal tax avoidance (as measured here), the less the aggregate degree of illegal personal income tax evasion. This finding is consistent with Cebula (2004), who first proposed and tested this hypothesis, albeit with data running only through the year 1997.
Consistent with the arguments in Musgrave (1987) and findings in Cebula, Coombs and Yang (2009), the results for TRA variable are compelling. In particular, the estimated coefficient on variable TRA is negative and statistically significant at the 1% level. Thus, there is evidence that the Tax Reform Act of 1986 is shown to have reduced federal personal income tax evasion in the U.S., albeit only briefly. Given the specification of TRA as applying to the short-term period of just 1986 and 1987, these results would seem to confirm the prior findings by Cebula, Coombs and Yang (2009), who argue that it would take at least some time for taxpayers to understand the revisions in the Internal Revenue Code and to adjust to those revisions.
The estimated coefficient on the binary IRAQWAR variable is positive, as hypothesized, and statistically significant at the 1% level. Thus, it appears that taxpayers in the aggregate engage in increased federal personal income tax evasion when the U.S. is involved in an unpopular war. In principle, this finding is compatible with the empirical evidence in Cebula (2001), who found that the unpopularity of the Vietnam War so angered the U.S. public that many chose to underreport their income and/or exaggerate their tax deductions. It also is consistent with Cebula, Cook, and Issa (2007), who found strong empirical evidence that the War in Iraq was very unpopular with a large percentage of the U.S. population.
studies such as Pestieau, Possen and Slutsky (1994), Erard and Feinstein (1994), Caballe and Panades (1997), and Cebula (2001), who suggests that IRS policies such as a higher audit rate by IRS personnel impose a variety of costs, both pecuniary and psychic, that act to dissuade income tax evasion behavior.
To test the consistency of the model and provide further insights into the issues at hand, the basic model in equation (7) was estimated next in semi-log form and then in log-log form. These empirical results can be found, respectively, in columns (b) and (c) of Table 4. Overall, all 12 of the estimated coefficients in columns (b) and (c) exhibit the expected signs and are statistically significant at the 5% level, and in most case, at beyond the 5% level. The F-statistics in both estimates are statistically significant at the 1% level, and the R2 values in both cases falls in the range of 0.70, thusly explain about seven-tenths of the variation in the dependent variable.
In column (b) of Table 4, all six of the estimated coefficients exhibit the expected signs, with five being statistically significant at the 1% level and one being statistically significant at the 5% level. Thus, in this semi-log estimation for the 1970-2008 study period, the underground economy in the form of income tax evasion in the U.S. was, paralleling the estimate in column (a), an increasing function of the maximum marginal federal income tax rate (at the 1% statistical significance level), the percentage of tax filers that itemized personal deductions (at the 5% statistical significance level), and the U.S. involvement in the War in Iraq (at the 1% statistical significance level). In addition, income tax evasion was, also paralleling the results in column (a), a decreasing function of the ratio of the tax-free interest rate yield on high grade municipal bonds to the taxable interest rate yield on 10-year U.S. treasury notes (at the 1% statistical significance level), the IRS audit rate by IRS examiners (at the 1% statistical significance level), and the Tax Reform Act (at the 1% statistical significance level). Thus, the semi-log estimate provides consistent support for the initial regression results and conclusions.
Finally, there is the log-log estimate presented in column (c) of Table 4. In this estimate, each of the estimation results associated with an explanatory variable is an elasticity rather than a coefficient per se. In column (c), each of the six of the estimated elasticity values exhibits the expected sign. In addition, four of the estimated elasticity values are statistically significant at the 1% level, one elasticity is statistically significant at the 2.5% level, and the remaining one is statistically significant at the 5% level. All of these findings parallel those in the linear and semi-log estimates found in columns (a) and (d) of Table 4.
According to the findings shown in column (c) of Table 4, a 10% increase in the maximum marginal federal personal income tax rate would increase aggregate income tax evasion in the U.S. by 1.06%. Clearly, then, if this tax rate were increased, the actual tax revenue increase would be lower than forecast/expected. Next, a 10% increase in the percentage of tax returns filing with itemized deductions would raise personal federal income tax evasion by 3.56%. Clearly, the policy of allowing itemized deductions as currently practiced may warrant re-examination by the IRS and by policy-makers. On the other hand, if the TF/TEN ratio rises by 10%, there would be a 5.94%
10
evasion, apparently by about 11.8%, implying that that taxpayers experience a secondary gain from tax evasion when U.S. political leaders immerse the military in conflicts the U.S. public disapproves of (Feige, 1994; Cebula, 2011). Finally, there is the issue of IRS audits conducted by IRS examiners.8 The results in this log-log estimate imply that a 10% increase in this audit rate would reduce aggregate federal personal income tax evasion by 1.71%; thus, a more aggressive audit policy by the IRS could bear fruit in terms of added revenues, although the political unpopularity of such a policy mat restrict its implementation.
IV.Summary and Closing Observations
This empirical study of the underground economy examines a new and updated series based on the General Currency Ratio (GCR) Model on personal income tax evasion for the period 1970 through 2008, with 2008 being the most recent year for which income tax evasion data are available for the U.S. The IRS has data based on the AGI-gap approach; however, the most recent year for its data is 2005 (Internal Revenue Service, 2010, Table 6).9 Thus, the present study is more “contemporary” than previous studies using “official data.”
Adopting a cost-benefit model of income tax evasion decision-making, this study seeks to identify key determinants of aggregate federal personal income tax evasion (under-reporting of taxable income, including the exaggerating of itemized deductions, which reduces taxable income) in the U.S. over the study period. The principal conclusions are the following: federal personal income tax evasion is an increasing function of the maximum marginal federal personal income tax rate, the percentage of federal personal income tax returns that itemizes deductions, and U.S. involvement in the unpopular war, in this case, the War in Iraq. The study also finds that the Tax Reform Act of 1986 acted to briefly discourage tax evasion, whereas a higher IRS audit rate by IRS personnel acted to discourage tax evasion. Furthermore, the greater the benefits of legal tax avoidance, as measured by the ratio of the tax free interest rate yield on high grade municipals to the taxable interest rate yield on 10-year Treasury notes, the less the degree of illegal tax evasion.
The findings imply, among other things, that increasing the maximum marginal federal personal income tax rate may not be the most efficient means of attempting to raise tax revenues. Furthermore, in the pursuit of greater tax revenues, limiting the ability to itemize personal tax deductions may be a fruitful path to consider; indeed, it was a significant component of the Tax Reform Act of 1986. However, it is a path requiring careful planning so as to avoid political fall-out with the taxpaying public. Obviously, avoidance of what is likely to be an unpopular war would be wise not only on moral, ethical, and political grounds, but also on the practical grounds of avoiding tax revenue losses. Finally, although increasing the IRS examiner audit rate may yield tax revenues, political pragmatism would seem to require a conservative implementation of such a policy change. In closing, it is observed that subsequent related research might seek to identify additional factors potentially influencing income tax evasion in the U.S., such as the minimum marginal federal personal income tax rate and the presence of undocumented immigrants within U.S. borders. In addition, future research might undertake an investigation of the possibility of simultaneity issues between tax evasion and other variables (Cebula, 2001; Alm and Yunus, 2009).
8 As opposed to audits performed by IRS computers.
References
Ali, M.M., Cecil, H.W. and Knoblett J.A. (2001). The effects of tax rates and enforcement policies on taxpayer compliance: A study of self-employed taxpayers. Atlantic Economic Journal, 29(2), 186-202.
Allingham, M.G., Sandmo, A. (1972). Income tax evasion. Journal of Public Economics, 1(3), 323-338.
Alm, J., Yunus, M. (2009). Spatiality and persistence in U.S. individual income tax compliance. National Tax Journal, 62(1), 101-124.
Alm, J., Jackson, B. and McKee, M. (1992). Institutional uncertainty and taxpayer compliance.
American Economic Review, 82(4), 1018-1026.
Baldry, J.C. (1987). Income tax evasion and the tax schedule: Some experimental results. Public Finance / Finances Publiques, 42(2), 357-383.
Barth, J.R. (1991). The great savings and loan debacle. Washington, D.C.: American Enterprise Institute.
Barth, J.R., Brumbaugh, R.D. (1992). The reform of federal deposit insurance. New York: Harper Business.
Bawley, D. (1982). The subterranean economy. New York: McGraw-Hill.
Caballe, J., Panades, J. (1997). Tax evasion and economic growth. Public Finance / Finances Publiques, 52(3-4), 318-340.
Carson, C. (1984). The underground economy: An introduction. Survey of Current Business, 64(1), 24-35.
Cebula, R.J. (2011). Aggregate income tax evasion: Empirical results from 2SLS estimation.
International Economics, 68(4), 345-362.
Cebula, R.J. (2001). Impact of income - detection technology and other factors on aggregate income tax evasion: The case of the United States. Banca Nazionale del Lavoro Quarterly Review, 54(4), 401-415.
Cebula, R.J. (2004). Income tax evasion revisited: The impact of interest rate yields on tax - free municipal bonds. Southern Economic Journal, 71(2), 418-423.
Cebula, R.J., Cook, J., and Issa, T.A. (2007). Economics, wars, and scandals: Their Impacts on the US public approval ratings of its president over the long run, Journal of Applied Economics,
6(3), 31-39.
Cebula, R.J., Coombs, C. (2009). Do government - spending - induced federal budget deficits ‘crowd out’ tax compliance in the U.S.? Tax Notes, 56(9), 1007-1012.
Cebula, R.J., Coombs, C. and Yang, B.Z. (2009). The tax reform act of 1986: An assessment in terms of tax compliance behavior in the U.S., International Economics, 51(2), 247-259. Clotfelter, C.T. (1983). Tax evasion and tax rates: An analysis of individual returns. Review of
Economics and Statistics, 65(2), 363-373.
Council of Economic Advisors (2010). Economic Report of the President, 2010. Washington, D.C.: U.S. Government Printing Office.
12
Das-Gupta, A. (1994). A theory of hard - to - get groups. Public Finance/Finances Publiques, 49 (Supplement), 28-39.
De Juan, A. (1989). Fiscal Attitudes and Behavior: A Study of 16-35 year old Swedish citizens.
Stockholm, Sweden: Stockholm School of Economics.
Erard, B., Feinstein, J.S. (1994). The role of moral sentiments and audit perceptions in tax Compliance. Public Finance/Finances Publiques, 49 (Supplement), 70-89.
Falkinger, J. (1988). Tax evasion and equity: A theoretical analysis. Public Finance/Finances Publiques, 43(3), 388-395.
Feige, E.L. (2009). New estimates of overseas U. S. currency holdings, the underground economy,
and the ‘tax gap’. Munich personal RePec archive, MPRA paper No. 30353. Munich, Germany: University Library of Munich.
Feige, E.L. (1994). The underground economy and the currency enigma. Public Finance / Finances Publiques, 49 (Supplement), 119-136.
Friedland, N. (1982). A note on tax evasion as a function of the quality of information about the credibility of threatened fines: Some preliminary research. Journal of Applied Psychology, 12(1), 54-59.
Government Accounting Office (1996). Individual Audit Rates. Available at:
http://www.gao.gov/archive/1996/gg96091.pdf.
Internal Revenue Service (2010). Aggregate Unreported Income Statistics. Available at:
http://www.irs.gov/taxstats/article/0,,id=175807,00.html.
Internal Revenue Service (1957-1997). Annual report of the commissioner and chief counsel of the Internal Revenue Service. Washington, D.C.: U.S. Government Printing Office.
Internal Revenue Service (2003). Statistics of income. Washington, D.C.: U.S. Government Printing Office.
Klepper, S., Nagin, D. and Spurr, S. (1991). Tax rates, tax compliance, and the reporting of long term capital gains. Public Finance / Finances Publiques, 46(2), 236-251.
Ledbetter, M. (2004). A comparison of BEA estimates of personal income and IRS estimates of adjusted gross income. Survey of Current Business, 84(4), 8-22.
Musgrave, R.A. (1987). Short of euphoria. Journal of Economic Perspectives, 1(1), 59-71.
Ott, A.F., Vegari, S.B. (2003). Tax reform: Chasing the elusive dream. Atlantic Economic Journal,
31(3), 266-282.
Pestieau, P., Possen, U. and Slutsky, S. (1994). Optimal differential taxes and penalties. Public Finance / Finances Publiques, 49 (Supplement), 15-27.
Sanger, G.C., Sirmans, C.F. and Turnbull, G.K. (1990). The effects of tax reform on real estate: Some empirical results. Land Economics, 66(4), 409-424.
Spicer, M.W., Lundsted, S.B. (1976). Understanding tax evasion. Public Finance / Finances Publiques, 31(2), 295-305.
Spicer, M.W., Thomas, J.E. (1982). Audit probabilities and the tax - evasion decision: An experimental approach. Journal of Economic Psychology, 2(2), 241-245.
Tanzi, V. (1982). The underground economy in the United States and abroad. Lexington, MA: Lexington Books.
Tanzi, V. (1983). The underground economy in the United States: Annual estimates, 1930-1980.
Thurman, Q.C. (1991). Taxpayer noncompliance and general prevention: An expansion of the deterrence model. Public Finance / Finances Publiques, 46(2), 289-298.
U.S. Census Bureau (1994). Statistical abstract of the United States, 1994. Washington, D.C.: U.S Government Printing Office..
U.S. Census Bureau (1998). Statistical abstract of the United States, 1998. Washington, D.C.: U.S Government Printing Office..
U.S. Census Bureau (1999). Statistical abstract of the United States, 1999. Washington, D.C.: U.S Government Printing Office.
U.S. Census Bureau (2001). Statistical abstract of the United States, 2001. Washington, D.C.: U.S Government Printing Office.
U.S. Census Bureau (2010). Statistical abstract of the United States, 2010. Washington, D.C.: U.S Government Printing Office.
14
Table 1. Expected Impacts of Variables on Aggregate Personal Income Tax Evasion
Variable Expected Impact on Aggregate Personal Income Tax Evasion (+ or -)
MAXMARGTX +
PCTITEM +
TFTEN -
IRAQWAR +
TRA -
-Table 2. Descriptive Statistics
Variable Mean Standard Deviation Period: 1970-2008:
(UAGI/RAGI) 21.013 2.027
MAXMARGTX 48.157 15.73
TRA 0.0513 0.224
PCTITEM 31.863 3.692
TFTEN 89.9 10.8
AUDIT 1.362 0.4
16
Table 3. Data for Dependent Variable, UAGI/RAGI, by Year, 1960-2008
Year UAGI/RAGI Year UAGI/RAGI
1960 16.10 1985 21.11 1961 15.47 1986 18.89 1962 15.86 1987 17.42 1963 16.44 1988 18.74 1964 15.88 1989 21.06 1965 14.62 1990 21.06 1966 14.86 1991 21.39 1967 15.36 1992 19.04 1968 15.21 1993 17.70 1969 15.32 1994 17.98 1970 16.30 1995 20.01 1971 16.04 1996 18.64 1972 16.16 1997 18.66 1973 16.27 1998 18.30 1974 17.47 1999 20.55 1975 18.81 2000 22.29 1976 20.17 2001 22.73 1977 20.37 2002 23.94 1978 20.63 2003 23.17 1979 21.14 2004 21.57 1980 22.84 2005 21.98 1981 22.25 2006 23.85 1982 22.93 2007 24.90 1983 21.46 2008 23.94 1984 21.86
Table 4. Empirical Estimates, 1970-2008
Variable (UAGI/RAGI) log (UAGI/RAGI) log (UAGI/RAGI)
(a) (b) (c)
Specification OLS OLS OLS (Linear) (Semi-log) (Log-Log)
a0 24.85 3.22 1.36
MAXMARGTX 0.088*** 0.0043*** 0.106* (2.89) (2.90) (2.11)
PCTITEM 0.189* 0.009* 0.356** (2.13) (2.07) (2.62)
TFTEN -10.97*** -0.521*** -0.594*** (-2.83) (-2.79) (-3.56)
TRA -4.497*** -0.222*** -0.206*** (-3.88) (-3.92) (-3.87)
IRAQWAR 2.652*** 0.124*** 0.118*** (3.25) (3.12) (3.21)
AUDIT -3.358*** -0.1604*** -0.171*** (-3.18) (-3.11) (-3.46)
R2 0.70 0.69 0.72
AdjR2 0.63 0.62 0.65
F 9.76*** 9.41*** 10.47***
DW 1.77 1.74 1.89
Rho 0.11 0.10 0.05