The Impact of Training Data on
Automated Short Answer Scoring Performance
∗Michael Heilman and Nitin Madnani Educational Testing Service
Princeton, NJ, USA
Abstract
Automatic evaluation of written responses to content-focused assessment items (automated short answer scoring) is a challenging educa-tional application of natural language process-ing. It is often addressed using supervised ma-chine learning by estimating models to predict human scores from detailed linguistic features
such as wordn-grams. However, training data
(i.e., human-scored responses) can be difficult to acquire. In this paper, we conduct exper-iments using scored responses to 44 prompts from 5 diverse datasets in order to better un-derstand how training set size and other fac-tors relate to system performance. We believe this will help future researchers and practition-ers working on short answer scoring to answer practically important questions such as, “How much training data do I need?”
1 Introduction
Automated short answer scoring is a challenging ed-ucational application of natural language process-ing that has received considerable attention in recent years, including a SemEval shared task (Dzikovska et al., 2013), a public competition on the Kaggle data science website (https://www.kaggle.com/
c/asap-sas), and various other research papers
(Leacock and Chodorow, 2003; Nielsen et al., 2008; Mohler et al., 2011).
The goal of short answer scoring is to create a pre-dictive model that can take as input a text response to a given prompt (e.g., a question about a reading pas-sage) and produce a score representing the accuracy
∗Michael Heilman is now a data scientist at Civis Analytics.
or correctness of that response. One well-known ap-proach is to learn a prompt-specific model using de-tailed linguistic features such as wordn-grams from a large training set of responses that have been pre-viously scored by humans.1
This approach works very well when large sets of training data are available, such as in the ASAP 2 competition, where there were thousands of labeled responses per prompt. However, little work has been done to investigate the extent to which short answer scoring performance depends on the availability of large amounts of training data. This is important be-cause short answer scoring is different from tasks where one dataset can be used to train models for a wide variety of inputs, such as syntactic parsing.2
Current short answer scoring approaches depend on having training data for each new prompt.
Here, we investigate the effects on performance of training sample size and a few other factors, in order to help answer extremely practical ques-tions like, “How much data should I gather and la-bel before deploying automated scoring for a new prompt?” Specifically, we explore the following re-search questions:
• How strong is the association between train-ing sample size and automated scortrain-ing perfor-mance?
1Information from the scoring guidelines, such as exemplars
for different score levels, can also be used in the scoring model, though in practice we have observed that this does not add much predictive power to a model that uses student responses (Sak-aguchi et al., 2015).
2Syntactic parsing performance varies considerably
depend-ing on the domain, but most applications use parsdepend-ing models that depend almost exclusively on the Penn Treebank.
• If the training set size is doubled, how much improvement in performance should we ex-pect?
• Are there other factors such as the number of score levels that are strongly associated with performance?
• Can we create a model to predict scoring model performance from training sample size and other factors (and how confident would we be of its estimates)?
2 Short Answer Scoring System
In this section, we describe the basic short answer scoring system that we will use for our experiment. We believe that this system is broadly representative of the current state of the art in short answer scor-ing. Its performance is probably slightly lower than what one would find for a system highly tailored to a specific dataset. Although features derived from au-tomatic syntactic or semantic parses might also re-sult in small improvements, we did not include such features for simplicity.
The system uses support vector regression (Smola and Sch¨olkopf, 2004) to estimate a model that pre-dicts human scores from vectors of binary indica-tors for linguistic features. We use the implemen-tation from the scikit-learn package (Pedregosa et al., 2011), with default parameters except for the complexity parameter, which is tuned using cross-validation on the data provided for training. For fea-tures, we include indicator features for the follow-ing:
• lowercased word unigrams
• lowercased word bigrams
• length bins (specifically, whether the log of 1 plus the number of characters in the response, rounded down to the nearest integer, equalsx, for all possiblexfrom the training set)
Note that word unigrams and bigrams include punc-tuation.
3 Datasets
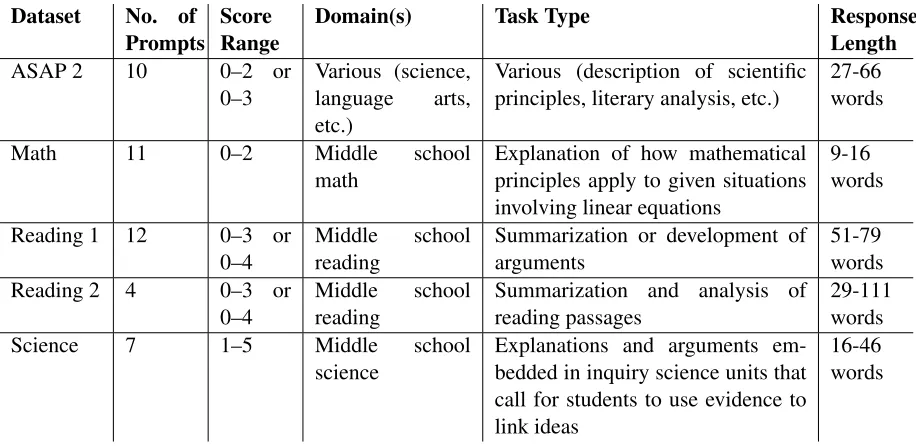
We conducted experiments using responses to 44 prompts from five different datasets. The data for each of the 44 prompts was split into a training set
and a testing set. Table 1 provides an overview of the datasets.
The ASAP 2 dataset is from the 2012 pub-lic competition hosted on Kaggle (https://
www.kaggle.com/c/asap-sas) and is
pub-licly available.3 The MathandReading 1datasets
were developed as part of the Educational Test-ing Service’s “Cognitively Based Assessment of, for, and as Learning” research initiative (Bennett, 2010).4 The Reading 2 dataset was developed as
part of the “Reading for Understanding” framework (Sabatini and O’Reilly, 2013). TheSciencedataset was developed and scored as part of the Knowledge Integration framework (Linn, 2006). Note that only the ASAP 2 dataset is publicly available.
For all prompts, there are at least 359 training ex-amples (at most 2,633).
4 Experiments
For each prompt, we trained a model on the full training set for that prompt and evaluated on the test-ing set. In addition, we trained models from ran-domly selected subsamples of the training set and evaluated on the full testing set. Specifically, we created 20 replications of samples (without replace-ment) of sizes2n∗100(i.e., 100, 200, 400, . . . ) up
to the full training sample size. We trained models on these subsamples and evaluated each on the full testing set.
Following the ASAP 2 competition
(https://www.kaggle.com/c/asap-sas/
details/evaluation), we evaluated models
using quadratically weightedκ(Cohen, 1968). For subsamples of the training data, we averaged the results across the 20 replications before further analyses. We used the Fisher Transformation z(κ)
when averaging because of its variance-stabilization properties. The same transformation was also used
3For the ASAP 2 dataset, we used the “public leaderboard”
for the testing sets.
4The math data came from the 2012 multi-state
Dataset No. of
Prompts ScoreRange Domain(s) Task Type ResponseLength
ASAP 2 10 0–2 or
0–3 Various (science,language arts, etc.)
Various (description of scientific
principles, literary analysis, etc.) 27-66words
Math 11 0–2 Middle school
math Explanation of how mathematicalprinciples apply to given situations involving linear equations
9-16 words
Reading 1 12 0–3 or
0–4 Middlereading school Summarization or development ofarguments 51-79words Reading 2 4 0–3 or
0–4 Middlereading school Summarization and analysis ofreading passages 29-111words Science 7 1–5 Middle school
science Explanations and arguments em-bedded in inquiry science units that call for students to use evidence to link ideas
[image:3.612.78.536.53.276.2]16-46 words
Table 1: Descriptions of the datasets. TheResponse Lengthcolumn shows the range of average response lengths (in
number of words) across all prompts in a dataset.
N mean s.d. med. min. max.
100 .600 .095 .596 .343 .782 200 .649 .085 .638 .418 .810 400 .688 .085 .692 .473 .828 800 .730 .079 .742 .540 .851 1600 .747 .074 .761 .590 .863
Table 2: Descriptive statistics about performance in terms
of averaged quadratically weightedκfor different
train-ing sample sizes (N), aggregated across all prompts.
“med.” = median, “s.d.” = standard deviation
by the ASAP 2 competition as part of its official evaluation.
z(κ) = 12ln1 +1−κκ (1)
κaverage = z−1(
X
prompt
z(κprompt)) (2)
[image:3.612.84.287.330.411.2]This gives us a dataset of averaged κ values for different combinations of prompts and sample sizes. Table 2 shows descriptive statistics.
For each data point, in addition to theκvalue and prompt, we compute the following:
• log2SampleSize:log2of the training
sam-ple size,
Variable r
log2SampleSize .550
log2MinSampleSizePerScore .392
meanLog2NumChar -.365
numLevels .033
Table 3: Pearson’s r correlations between training set
characteristics and human-machineκ.
• log2MinSampleSizePerScore:log2 of
the minimum number of examples for a score level (e.g.,log2(16)if the least frequent score level in the training sample had 16 examples),
• meanLog2NumChar: The mean, across
train-ing sample responses, oflog2of the number of characters (a measure of response length),
• numLevels: The number of score levels.
For each of these variables, we first compute Pear-son’s r to measure the association between κ and each variable. The results are shown in Table 3.
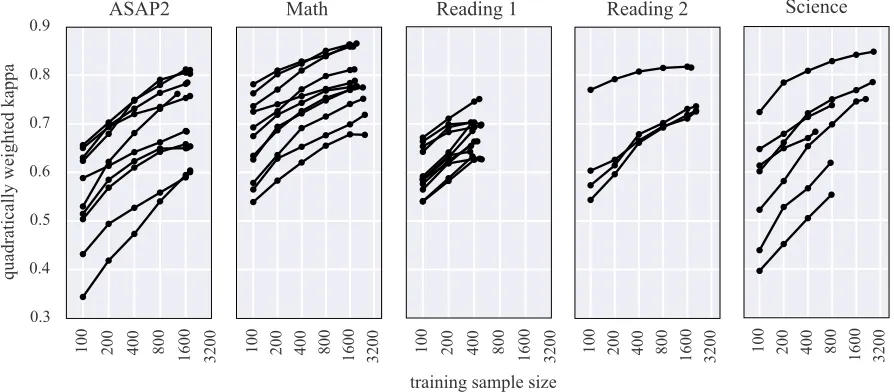
Not surprisingly, the variable most strongly asso-ciated with performance (i.e., κ) is the log2 of the number of responses used for training. However, having a large sample does not ensure high human-machine agreement: the correlation betweenκand
log2SampleSize was only r = .550.
[image:3.612.104.298.539.593.2]illus-10
0
20
0
40
0
80
0
160
0
320
0
0.3 0.4 0.5 0.6 0.7 0.8 0.9
qua
dra
ti
ca
ll
y w
ei
ght
ed ka
pp
a
Reading 1
10
0
20
0
40
0
80
0
160
0
320
0
Science
10
0
20
0
40
0
80
0
160
0
320
0
training sample size
ASAP2
10
0
20
0
40
0
80
0
160
0
320
0
Math
10
0
20
0
40
0
80
0
160
0
320
0
Reading 2
Figure 1: Plots of human-machine agreement versus sample size, for various prompts from different datasets.
trated in Figure 1.
Next, we tested whether we could predict human-machine agreement for different size training sets for new prompts. We used the dataset of κ val-ues for different prompts and training set sizes de-scribed above (N = 224). We iteratively held out each dataset and used it as a test set to evaluate performance of a model trained on the remaining datasets. For the model, we used a simple ordinary least squares linear regression model, with the vari-ables from Table 3 as features.5 For labels, we used z(κ) instead of κ, and then converted the models predictions back toκvalues using the inverse of the
zfunction (Eq. 1). We report two measures of corre-lation (Pearson’s and Spearman’s) and two measures of error (root mean squared error and mean absolute error). The results are shown in Table 4.
5 Discussion and Conclusion
In response to the research questions we posed ear-lier, we found that:
• The correlation between training sample size and human-machine agreement is strong, though performance varies considerably by prompt (Table 2 and Figure 1).
5We prefer to use a simpler linear model instead of a more
complex hierarchical model for the sake of interpretability.
Dataset pearson spearman RMSE MAE
[image:4.612.80.527.63.259.2]ASAP2 .650 .654 .080 .064 Math .558 .523 .095 .076 Reading 1 .708 .617 .039 .031 Reading 2 .497 .467 .070 .063 Science .438 .464 .173 .139
Table 4: Results for the predictive model of
human-machineκ.
• If the training sample is doubled in size, then performance increases .02 to .05 in κ (Ta-ble 2). This rate of increase was fairly consis-tent across prompts. However, as with other supervised learning tasks, there will likely be a point where increasing the sample size does not yield large improvements.
• Variables such as the minimum number of ex-amples per score level and the length of typical responses are also associated with performance (Table 3), though not as much as the overall sample size.
scoring rubrics, and student populations might lead to better predictions.
In this paper, we investigated the impact of train-ing sample size on short answer scortrain-ing perfor-mance. Our results should help researchers and practitioners of automated scoring answer the highly practical question, “How much data do I need to get good performance?”, for new short answer prompts. We conducted our experiments using a basic sys-tem with only n-gram and length features, though it is likely that the observed trends (e.g., the rate of increase inκ with more data) would be similar for many other systems. Future work could explore is-sues such as how much performance varies by task type or by the amount of linguistic variation in re-sponses at particular score levels.
Acknowledgements
We would like to thank Randy Bennett, Kietha Big-gers, Libby Gerard, Rene Lawless, Marcia Linn, Ly-dia Liu, and John Sabatini for providing us with the various datasets used in this paper. We would also like to thank Aoife Cahill and Martin Chodorow for their help with the research. Some of the material used here is based upon work supported by the Na-tional Science Foundation under Grant No. 1119670 and by the Institute of Education Sciences, U.S. De-partment of Education, under Grant R305F100005. Any opinions, findings, conclusions, or recommen-dations expressed in this material are those of the au-thors and do not necessarily reflect the views of the National Science Foundation, the Institute of Educa-tion Sciences, or the U.S. Department of EducaEduca-tion.
References
Randy Elliot Bennett. 2010. Cognitively based assess-ment of, for, and as learning (CBAL): A preliminary theory of action for summative and formative
assess-ment. Measurement: Interdisciplinary Research and
Perspectives, 8(2–3):70–91.
J. Cohen. 1968. Weighted kappa: Nominal scale agree-ment with provision for scaled disagreeagree-ment or partial
credit. Psychological Bulletin, 70(4).
Myroslava Dzikovska, Rodney Nielsen, Chris Brew, Claudia Leacock, Danilo Giampiccolo, Luisa Ben-tivogli, Peter Clark, Ido Dagan, and Hoa Trang Dang.
2013. SemEval-2013 Task 7: The Joint Student Re-sponse Analysis and 8th Recognizing Textual
Entail-ment Challenge. InSecond Joint Conference on
Lexi-cal and Computational Semantics (*SEM), Volume 2: Proceedings of the Seventh International Workshop on Semantic Evaluation (SemEval 2013), pages 263–274, Atlanta, Georgia, USA, June.
C. Leacock and M. Chodorow. 2003. c-rater: Scoring of
short-answer questions. Computers and the
Humani-ties, 37.
Marcia C. Linn. 2006. The Knowledge Integration
Per-spective on Learning and Instruction. Cambridge Uni-versity Press, Cambridge, MA.
Michael Mohler, Razvan Bunescu, and Rada Mihalcea. 2011. Learning to Grade Short Answer Questions using Semantic Similarity Measures and Dependency
Graph Alignments. In Proceedings of ACL:HLT,
pages 752–762, Portland, Oregon, USA, June. Rodney D. Nielsen, Wayne Ward, and James H. Martin.
2008. Classification Errors in a Domain-Independent
Assessment System. In Proceedings of the Third
Workshop on Innovative Use of NLP for Building Edu-cational Applications, pages 10–18, Columbus, Ohio, June.
F. Pedregosa, G. Varoquaux, A. Gramfort, V. Michel, B. Thirion, O. Grisel, M. Blondel, P. Prettenhofer, R. Weiss, V. Dubourg, J. Vanderplas, A. Passos, D. Cournapeau, M. Brucher, M. Perrot, and E. Duches-nay. 2011. Scikit-learn: Machine learning in Python. Journal of Machine Learning Research, 12:2825– 2830.
J. Sabatini and T. O’Reilly. 2013. Rationale for a new generation of reading comprehension assessments. In
B. Miller, L. Cutting, and P. McCardle, editors,
Un-raveling Reading Comprehension: Behavioral, Neu-robiological and Genetic Components. Paul H. Brooks Publishing Co.
Keisuke Sakaguchi, Michael Heilman, and Nitin Mad-nani. 2015. Effective Feature Integration for
Au-tomated Short Answer Scoring. In Proceedings of
NAACL, Denver, Colorado, USA.
Alex J. Smola and Bernhard Sch¨olkopf. 2004. A Tutorial
on Support Vector Regression. Statistics and
Comput-ing, 14(3):199–222.