Munich Personal RePEc Archive
Strategy in practice: a quantitative
approach to target setting
Fafaliou, Irene and Zervopoulos, Panagiotis
University of Piraeus, Open University of Cyprus
4 January 2014
1
STRATEGY IN PRACTICE: A QUANTITATIVE APPROACH TO TARGET SETTING
Irene Fafaliou
Department of Economics, University of Piraeus, 80 Karaoli & Dimitriou St, 185 34 Piraeus, Greece
Tel. : +30 2104142157 [email protected]
Panagiotis D. Zervopoulos
Faculty of Economics and Management, Open University of Cyprus, Latsia, 2252 Nicosia, Cyprus
Tel.: +30 2102912810 [email protected]
ABSTRACT
An extended quality-driven efficiency-adjusted data envelopment analysis (QE-DEA) method is developed to measure the performance of service units. Performance is measured based on efficiency and users’ satisfaction. The extended QE-DEA method identifies as benchmarks only units that are qualified both in efficiency and satisfaction and ensures that all of the units will be qualified in both dimensions of performance when their performance becomes maximal. If there are efficient units which fail to provide satisfactory services, an adjustment procedure is applied to their outputs before the assessment of the units’ performance. Optimal output targets that lead every unit to maximal performance are defined by the extended QE-DEA. The presented expression relaxes the main assumption of the original QE-DEA method that is the fixed weights between original and adjusted outputs. The extended expression is applied to fifty public one-stop shops.
Keywords: Data envelopment analysis, Performance management, Efficiency,
2
STRATEGY IN PRACTICE: A QUANTITATIVE APPROACH TO TARGET SETTING
1. INTRODUCTION
In this study, an extended quality-driven efficiency-adjusted data envelopment analysis (QE-DEA) expression is developed for target setting and is applied to fifty public one-stop shops. The objective of the extended expression is to identify outputs that lead the units under evaluation to achieve optimal performance, securing at the same time desirable levels of users’ satisfaction with the services provided by every unit. The peculiarity that the applied method manages to deal with is the determination of the optimal balance between two inversely related variables: efficiency and users’ satisfaction, which are incorporated in the analysis.
The extended QE-DEA method draws on DEA and algebraic analysis. DEA is a linear programming method put forth by Charnes et al. (1978). DEA measures the efficiency of operational units by forming a production frontier which consists of best-practice units. Input or/and output targets are then defined for the remaining units in order to be projected to the production frontier. Unlike stochastic methods, DEA requires an assumption for a production function as it is implicitly defined by the available empirical data.
Since the seminal paper of Charnes et al. (1978), DEA has been widely extended and applied to numerous areas (Emrouznejad et al., 2008). DEA has become a major technique for performance measurement and target setting. Lin (2011) and Amirteimoori and Mohaghegh Tabar (2010) extended DEA, facilitating target setting under the constraint of a fixed resource for the inputs of all of the units under evaluation. Knox Lovell and Pastor (1997) developed a modified DEA expression for performance measurement and target setting for the produced outputs of the units. The two scholars used a constant input in their program as the input information was incorporated in the outputs. Lim and Zhu (2013) modified three DEA expressions (i.e. radial, slacks-based and Nerlove-Luenberger) in order to attain user-determined targets for input and output variables.
The extended QE-DEA method identifies optimal outputs or inputs by setting a base target for users’ satisfaction which applies to all sample units. In addition to the base target, the trade-off between the dimensions of performance is a constraint that should also be considered. The extended QE-DEA method relaxes a major assumption of the original method regarding the flexibility of weights when a modification is applied to outputs of partially qualified units (i.e. efficient units that do not meet the base target for users’ satisfaction).
3
2. FOUNDATIONS OF THE APPLIED TARGET-SETTING METHOD
The applied target-setting method is an extension of the QE-DEA method, put forth by Zervopoulos and Palaskas (2011). The scope of the latter method was the performance measurement and the operational restructuring of organizational units while the former method focuses on performance measurement and target setting. In other words, the QE-DEA algorithm is modified in order to accommodate an output-oriented analysis. In addition, the modified algorithm relaxes the assumption of fixed weights between original and adjusted variables, which was introduced by Zervopoulos and Palaskas (2011).
The extended QE-DEA method measures performance scores for every operational unit under evaluation and also target output levels which satisfy both efficiency and users’ (e.g. customers’ or citizens’) satisfaction attainment. The QE-DEA method identifies benchmark units which are regarded as relatively efficient (i.e. efficiency score = 1.000) and also users report high levels of satisfaction from their provided services (i.e. satisfaction score ≥ 4, Table 1). Any unit that satisfies one of the two criteria cannot be a benchmark for the units that are disqualified in both criteria. Hence, the former unit cannot influence the procedure for determining target output levels for the latter units.
A novelty of the QE-DEA method is that partially qualified units are neither excluded from the analysis nor considered as fully disqualified. Instead, their input or output levels are adjusted appropriately (i.e. the inputs are increased when an input-oriented approach is selected, and the outputs are decreased in the case of the output orientation) to meet high users’ satisfaction standards. The applied adjustment implies a trade-off between efficiency and users’ satisfaction. In the context of target setting (e.g. output-oriented analysis), maximal output levels for a partially disqualified unit cannot be attained without deterioration of users’ satisfaction (Gustafsson and Johnson, 2002; Kamakura et al., 2002; Lau, 2000; Zeithaml, 2000; Anderson et al., 1997) holding the amount and cost or resources, and technology used by every operational unit fixed. The QE-DEA algorithm does not require any assumption about the magnitude of trade-off between the two variables.
[image:4.595.195.408.578.667.2]Users’ satisfaction is measured on a five-point Likert scale, on which one represents ‘very dissatisfied’ and five stands for ‘very satisfied’. The five-point scale is transformed into a percentage scale in order to be comparable with the efficiency scale which ranges from 0.0 to 1.0 (Table 1).
Table 1. Transformation of satisfaction scores
Five-point scale Equivalent percentage scale 1.00 - 1.99 (0.2, 0.4) 2.00 - 2.99 [0.4, 0.6) 3.00 - 3.99 [0.6, 0.8) 4.00 - 5.00 [0.8, 1.0]
A unit is deemed qualified from a user’s perspective when it scores at least four out of five or 80%.
4
Nomenclature
efficiency score (
1)ij
x ith input of the jth unit
io
x ith input of the jth reference unit
rj
y rth output of the jth unit
ro
y rth output of the jth reference unit
j
non-negative scalarp performance score
j
s users’ satisfaction score of the jth unit
j
s users’ satisfaction score of the jth reference unit
S average users’ satisfaction score of the units that are qualified in efficiency
and users’ satisfaction
1 ' inverse adjusted efficiency score 1o
inverse efficiency score lower bound
A
s original users’ satisfaction score
o
s users’ satisfaction score lower bound
'
A
s adjusted users’ satisfaction score
,
i r
v u non-negative multipliers
*
v free in sign scalar
The first step for applying the target-setting method is to run an output-oriented variable returns to scale (VRS) DEA program (Banker et al. 1984).
max
1
. . 1,...,
n
j ij io j
s t
x x i m
1
1,...,
n
j rj ro j
y y r t
1
1
n
j j
j 0 (1)5
maxp
1
. . 1,...,
n
j ij io j
s t
x x i m
1 1,..., nj rj ro j
y py r t
1 nj j o j s s
1 1 n j j
j 0 (2)and
if s
otherwise o o o s S s S
If an efficient unit that does not meet the high users’ satisfaction standards is present, then the outputs should be limited to ensure a high satisfaction score for this unit. The control over the outputs will have negative impact on the efficiency score of the unit. The new efficiency score is defined from formula (3) (Zervopoulos and Palaskas, 2011):
1/2
2 1 2 2
1 1
2 1 2 2 2 1 2
' '
[( ) ( 1) ]( ) '
[( ) ( 1) ]( ) ( ) ( 1)
A o A o
A o A o A o
s s s s
s s s s s s
(3)where
1 '1.Unlike the original QE-DEA model, its modified expression draws on the multiplier VRS DEA program to determine the adjusted output of the partially qualified units. To be more precise: * 1 min m i io i
v x v
1
. . 1
t
r ro r s t u y
* 1 1 t mr rj i ij
r i
u y v x v
(4), 0
v u and v* is free in sign
6 1 min t r rc r u y
1. . 1
t
r rc r s t u y
1 *1 1
'
t m
r rc i ic c
r i
u y v x v
(5)where c j, yrcad yrc, ad 2
1 'rc c rc
y
y , v u, 0 and *
v is free in sign
The obtained outputs and weights are the adjusted outputs (yrcad) and their assigned
weights (urad).
The adjustment process secures that all of the efficient units will also provide high users’ satisfaction level.
Subsequent to the adjustment process, the performance of the units under evaluation is measured by applying the following program:
maxp
1
. . 1,...,
n
j ij io j
s t
x x i m
, 1 1,..., ; nt t t ad
j rj ro rj rj j c rc
j
y py r t y y y
, 1 nt t t
j j o j j j c c j
s s s s s
1 1 n j j
j 0 (6)where c j and
if s
7
3. APPLICATION OF THE TARGET-SETTING METHOD
3.1 Presentation of the data
The applicability of the proposed target-setting method will be explicit through a numerical example. In the following example, we used data from the Greek Citizen Service Centers (CSCs) which are public one-stop shops appointed to the provision of administrative services to citizens (users). In particular, the sample consists of 50 CSCs. There are six input variables (i.e. employees, weekly working hours, PCs, fax machines, printers, and surface area) and two output variables (i.e. e-services and manual services provided to citizens). In addition, 764 citizens’ satisfaction questionnaires were collected from all of the sample CSCs. The number of satisfaction questionnaires that were answered by citizens for every sample CSC ranges from 20 to 30. The design of the satisfaction survey drew on the SERVQUAL methodology developed by Parasuraman et al. (1988).
3.2 Numerical example
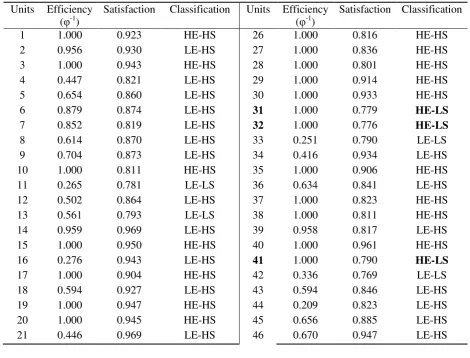
[image:8.595.66.537.419.777.2]Prior to the application of the extended QE-DEA algorithm, the linear program (1) is used to classify the units and particularly to identify the units that are efficient but are not qualified in satisfaction (i.e. satisfaction score < 0.800). In Table 2, five out of fifty sample units (i.e. units 31, 32, 41, 49, and 50) are regarded as partially qualified as they are efficient but they fail to deliver satisfactory services to users.
Table 2.Units’ classification
Units Efficiency (φ-1)
Satisfaction Classification Units Efficiency (φ-1)
Satisfaction Classification
1 1.000 0.923 HE-HS 26 1.000 0.816 HE-HS 2 0.956 0.930 LE-HS 27 1.000 0.836 HE-HS 3 1.000 0.943 HE-HS 28 1.000 0.801 HE-HS 4 0.447 0.821 LE-HS 29 1.000 0.914 HE-HS 5 0.654 0.860 LE-HS 30 1.000 0.933 HE-HS 6 0.879 0.874 LE-HS 31 1.000 0.779 HE-LS
7 0.852 0.819 LE-HS 32 1.000 0.776 HE-LS
8 0.614 0.870 LE-HS 33 0.251 0.790 LE-LS 9 0.704 0.873 LE-HS 34 0.416 0.934 LE-HS 10 1.000 0.811 HE-HS 35 1.000 0.906 HE-HS 11 0.265 0.781 LE-LS 36 0.634 0.841 LE-HS 12 0.502 0.864 LE-HS 37 1.000 0.823 HE-HS 13 0.561 0.793 LE-LS 38 1.000 0.811 HE-HS 14 0.959 0.969 LE-HS 39 0.958 0.817 LE-HS 15 1.000 0.950 HE-HS 40 1.000 0.961 HE-HS 16 0.276 0.943 LE-HS 41 1.000 0.790 HE-LS
8
22 0.486 0.808 LE-HS 47 0.535 0.920 LE-HS 23 1.000 0.808 HE-HS 48 0.648 0.956 LE-HS 24 1.000 0.810 HE-HS 49 1.000 0.666 HE-LS
25 1.000 0.872 HE-HS 50 1.000 0.694 HE-LS
HE: high efficiency (efficiency score = 1.000); LE: low efficiency (efficiency score < 1.000); HS: high satisfaction (satisfaction score 0.800); LS: low satisfaction (satisfaction score < 0.800)
In this context, the outputs of the five partially qualified units should be adjusted to ensure that all of the benchmark units of the sample both are efficient and deliver satisfactory services to users. Drawing on formula (3), which is applied to every partially qualified unit, a satisfaction score is arbitrarily selected (e.g. s'A= 0.800). This score should be at a minimum equal to the lower-satisfaction bound (i.e. 0.800, Table 1). The obtained efficiency score from formula (3) is not a relative measure but rather a stand-alone. In other words, the adjusted efficiency score of a unit does not take into account the movement of the remaining units towards the production frontier. This movement is probable, due to the modification of the outputs of the partially qualified unit. In addition, in formula (3),
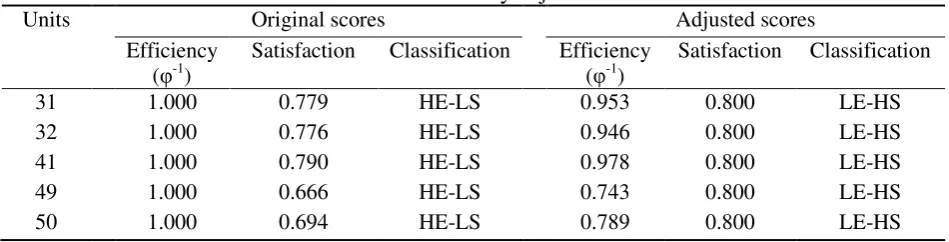
o1 and so are set equal to 0.200. According to Paradi et al. (2004), when efficiency scores lower than 0.200 are present, the dataset should be reviewed for faulty entries. The lower users’ satisfaction bound is defined by the percentage transformation of the users’ satisfaction scores which are measured in a five-point scale (Table 1). [image:9.595.65.540.433.554.2]The inverse relationship between efficiency and satisfaction is presented in the adjusted efficiency scores (Table 3). The adjusted efficiency scores are lower than the original efficiency scores after the increase of the level of satisfaction.
Table 3. Efficiency adjustment
Units Original scores Adjusted scores Efficiency
(φ-1)
Satisfaction Classification Efficiency (φ-1)
Satisfaction Classification
31 1.000 0.779 HE-LS 0.953 0.800 LE-HS 32 1.000 0.776 HE-LS 0.946 0.800 LE-HS 41 1.000 0.790 HE-LS 0.978 0.800 LE-HS 49 1.000 0.666 HE-LS 0.743 0.800 LE-HS 50 1.000 0.694 HE-LS 0.789 0.800 LE-HS
9
Table 4. Adjusted outputs
Units Original outputs Adjusted outputs E-services Services E-services Services 31 11764 9721 10285 8584 32 42216 322231 38229 283870 41 16901 62846 15427 55323 49 1699 1015 1493 921 50 3786 1348 3300 1211
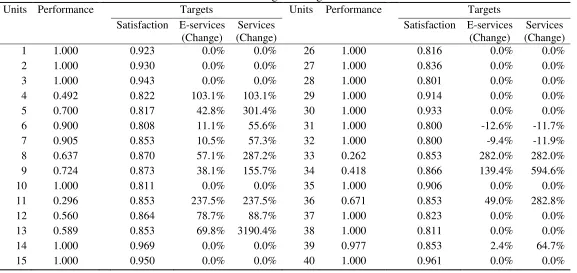
The adjusted outputs replace the original outputs in the dataset, and then linear program (6) is applied. The scores displayed in columns two and seven of Table 5 represent the performance of the sample units. For defining performance, satisfaction was incorporated in the optimization together with input and output variables. Unlike the latter two variables, users’ satisfaction is not fully controlled by the units. However, as was stated in the previous section, there is an underlying relationship between the activity of the units, which is expressed in terms of efficiency and users’ satisfaction.
Columns 3-5 and 8-10 of Table 5 display the target levels for satisfaction and the two outputs which are optimal solutions for the optimization problem. All of the units which were partially qualified (i.e. units 31, 32, 41, 49, and 50) are regarded as benchmarks after the adjustment of their outputs according to the extended QE-DEA algorithm. These units, however, need to decrease their output levels compared to their original output levels.
The goal of the presented target-setting method is to define output targets which secure synchronous optimal operation and high users’ satisfaction level. In many cases (e.g. units 5, 6, 16), the attainment of optimal (target) outputs is associated with the sacrifice of users’ satisfaction, which never becomes unacceptable.
Table 5. Target-setting results
Units Performance Targets Units Performance Targets Satisfaction E-services
(Change)
Services (Change)
Satisfaction E-services (Change)
[image:10.595.18.596.493.766.2]10
16 0.276 0.844 262.3% 1111.7% 41 1.000 0.800 -8.7% -12.0% 17 1.000 0.904 0.0% 0.0% 42 0.350 0.853 186.0% 186.0% 18 0.608 0.892 64.4% 64.4% 43 0.660 0.853 51.6% 86.2% 19 1.000 0.947 0.0% 0.0% 44 0.224 0.853 345.7% 345.7% 20 1.000 0.945 0.0% 0.0% 45 0.668 0.885 49.7% 199.0% 21 0.446 0.822 163.2% 124.2% 46 0.704 0.883 42.0% 42.0% 22 0.694 0.853 44.0% 3062.2% 47 0.536 0.920 86.5% 274.9% 23 1.000 0.808 0.0% 0.0% 48 0.648 0.910 54.4% 54.4% 24 1.000 0.810 0.0% 0.0% 49 1.000 0.800 -12.1% -9.3% 25 1.000 0.872 0.0% 0.0% 50 1.000 0.800 -12.8% -10.2%
4. CONCLUSIONS
The proposed target-setting method is an extension of the QE-DEA method. In particular, the algorithm of the QE-DEA method was modified appropriately to relax its major assumption regarding the fixed weights between the original and the adjusted variables and also to enable output-oriented analysis. The extended QE-DEA method applies twofold performance measurement, incorporating in the analysis both efficiency and users’ satisfaction. The identified benchmark units always are efficient and deliver high -satisfaction services to users. In addition, unlike the original QE-DEA method, its extended expression ensures that all of the sample units will attain efficiency and high users’ satisfaction when performance becomes maximal.
The managerial implications of the extended QE-DEA method were presented in the application to fifty public one-stop shops. However, the applicability of the method is not limited to public organizations.
REFERENCES
Amirteimoori, A. and Mohaghegh Tabar, M. (2010), Resource allocation and target setting in data envelopment analysis, Expert Systems with Applications 37: 3036-3039.
Anderson, E.W., Fornell, C. and Rust, R.T. (1997), Customer satisfaction, productivity, and profitability: differences between goods and services, Marketing Science 16 (2): 129-145.
Banker, R.D., Charnes, A. and Cooper, W.W. (1984), Some models for estimating technical and scale inefficiencies in data envelopment analysis, Management Science 30 (9): 1078-1092.
Charnes, A., Cooper, W.W. and Rhodes, E. (1978), Measuring the efficiency of decision making units, European Journal of Operational Research 2 (6): 429-444.
11
Gustafsson, A. and Johnson, M.D. (2002), Measuring and managing the satisfaction-loyalty-performance links at Volvo, Journal of Targeting, Measurement and Analysis for Marketing 10 (3): 249-258.
Kamakura, W.A., Mittal, V., de Rosa, F. and Mazzon, J.A. (2002), Assessing the service-profit chain, Marketing Science 21 (3): 294-317.
Knox Lovell, C.A. and Pastor, J.T. (1997), Target setting: an application to a bank branch network, European Journal of Operational Research 98: 290-299.
Lau, R.S.M. (2000), Quality of work life and performance: an ad hoc investigation of two key elements in the service profit chain model, International Journal of Service Industry Management 11 (5): 422-437.
Lim, S. and Zhu, J. (2013), Incorporating performance measures with target levels in data envelopment analysis, European Journal of Operational Research 230: 634-642.
Lin, R. (2011), Allocating fixed costs or resources and setting targets via data envelopment analysis, Applied Mathematics and Computation 217: 6349-6358.
Paradi, J., Vela, S. and Yang, Z. (2004) Assessing bank and bank branch performance: modeling considerations and approaches, in Cooper, W.W, Seiford, L. and Zhu, J. (eds) (2004) Handbook on Data Envelopment Analysis, Kluwer Academic Publishers, London: 349-400.
Parasuraman, A., Zeithaml, V.A. and Berry, L. (1988), SERVQUAL: a multiple-item scale for measuring consumer perceptions of service quality, Journal of Retailing 64: 12-40.
Zeithaml, V.A. (2000), Service quality, profitability, and the economic worth of customers: what we know and what we need to learn, Journal of the Academy of Marketing Science 28 (1): 67-85.