Analysis of Foreign Language Teaching Methods:
An Automatic Readability Approach
Nasser Zalmout, Hind Saddiki and Nizar Habash
Computational Approaches to Modeling Language Lab New York University Abu Dhabi, UAE
{nasser.zalmout,hind.saddiki,nizar.habash}@nyu.edu
Abstract
Much research in education has been done on the study of different language teaching methods. However, there has been little investigation using computational analysis to compare such methods in terms of readability or complexity progression. In this paper, we make use of existing readability scoring techniques and our own classifiers to ana-lyze the textbooks used in two very different teaching methods for English as a Second Language – the grammar-based and the communicative methods. Our analysis indicates that the grammar-based curriculum shows a more coherent readability progression com-pared to the communicative curriculum. This finding corroborates with the expectations about the differences between these two methods and validates our approach’s value in comparing different teaching methods quantitatively.
1 Introduction
In today’s highly interdependent economies and intercultural exchange, learning a second lan-guage has become increasingly valued. With over 1.5 billion speakers, including 360 million native speakers, English is the most common second language worldwide. The study of differ-ent language teaching methods has been a dominant research pillar of education literature, with numerous contributions spanning various domains (Allen and Widdowson, 1974; Richards and Renandya, 2002) However, there has been little investigation using computational analysis of various teaching methods, and how they compare against each other in terms of readability or complexity progression.
In this paper, we make use of existing readability scoring techniques to analyze the textbooks used in two very different teaching methods for English as a Second Language (ESL). The first method follows a grammar-based approach, and is represented with school textbooks spanning grades 1 through 12 of the educational system of a non-English speaking country (Palestine). The second method uses a communicative approach, and is represented with four graded text-books from a generic ESL course called Lane’s English as a Second Language Course. We use several commonly used readability scoring metrics, and we implement machine learning readability classifiers exploiting various syntactic and lexical features. We employ these tools to make inferences regarding the language readability progression, with increasing grade levels, for the two teaching methods and their affiliated textbooks.
In the next section, we discuss some related work. This is followed by a detailed presentation of our dataset (Section 3) and readability algorithms (Section 4). We finally present and discuss our results in Section 5.
2 Related Work
2.1 Foreign Language Teaching Methods
Previous ESL teaching methods relied heavily on grammar-based methods, where there is more focus on sentence structure rather than sentence flow. This trend continued throughout the 60s and 70s (Richards and Renandya, 2002), and found its way into many ESL school-based curric-ula still in use today. Recently, more consideration is given to the actual needs and backgrounds of the learners themselves (Lane, 1978). Teaching methods have generally shifted away from grammar-based methods and have come to rely more on lexical factors such as frequency and word count. The communicative approach later emerged (Allen and Widdowson, 1974), fo-cusing on linguistic patterns, and facilitated by audio support. However, this approach has been criticized since relying on pure communicative contexts would still require building up sufficient vocabulary and grammar knowledge beforehand (Lane, 1978). Many of the English language textbooks for non-native speakers follow a variation of this approach. These textbooks exhibit more emphasis on grammar and vocabulary in the early grade levels, then shift to a more com-municative approach in subsequent grades. The school textbooks used in this paper follow this trend. Another recent variation for learning English focuses much more on the communicative approach, but with emphasis on gradual rules and patterns. When students are exposed to these, they can experience proper communication and gather the momentum to carry them through the new and unfamiliar parts. This approach is used for Lane’s course.
2.2 Previous Work on Readability Analysis
In the scope of this paper, analyzing the readability of a given text involves quantifying lexical and syntactic features of the text and obtaining a measure of its difficulty or readability. Some of the early contributions for readability scoring date back to the 40s, using approximate and generic regression formulas to get an indicative score of the observed readability. These scores reflect the readability of the text in terms of grade levels or bound score tag. Such algorithms include:
• Flesch Reading Ease scores (FRE) (Flesch and others, 1949): Scores run from 0 to 100, with lower FRE scores indicating more complex, i.e. less readable text.
• The Flesch-Kincaid Grades (FKG) (Kincaid et al., 1975): Text readability is expressed through the most fitting grade tag from around 0.3 to 12, 12 being the highest.
• Dale-Chall (DC) scores (Dale and Chall, 1948): A grading scheme similar to FKG is ap-plied (ranging from 4.9-or-lower to 9.0-9.9), but with greater emphasis placed on vocabu-lary by using a list of 3000 commonly used words in English.
the more traditional scores involving more elaborate feature analysis. As computational methods for natural language processing and machine learning matured, researchers began addressing the readability issue from this new angle, with increasingly promising results (Francois and Milt-sakaki, 2012). More recent attempts at readability scoring, including (Collins-Thompson, 2014; Pil´an et al., 2014; Pil´an et al., 2016), discuss utilizing machine learning and Support Vector Ma-chines (SVM), among other classifiers, to predict readability levels. Collins-Thompson (2014) discusses feature set selection, and classification algorithm choices, among other implementa-tion details. Existing work analyzing second languages mostly treats the foreign language as a single coherent entity, without looking into different methods or resources for the learning pro-cess (Collins-Thompson, 2014), and without delving into the various factors that might affect the learning process such as contexts, teaching methods, teaching resources, or the students’ first language. Our work investigates readability progression spanning several grade levels of two sets of textbooks, each of which follows a different ESL teaching method. We apply estab-lished formulaic algorithms and build our own machine learning classifier to assess readability.
3 Dataset
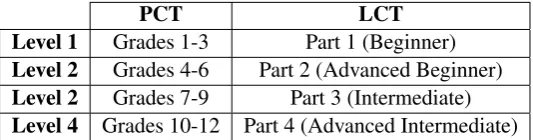
The grammar-based textbooks we use in this paper pertain to the English language curriculum of a non-English speaking country (Palestine), henceforth referred to as thePalestinian Curriculum Textbooks(PCT). The communicative textbooks are fromLane’s English as a Second Language Course, henceforth referred to asLane’s Course Textbooks(LCT). The textbooks are divided into 12 grades for PCT (spanning grades 1 through 12) and four consecutive levels for LCT (beginner, advanced beginner, intermediate, advanced intermediate). The PCT textbooks are grouped into four parts, as shown in Table 1, and detailed in the following section.
In some of the experiments, we also include a control corpus comprised of four excerpts from literature used for teaching various school grades in the State of New York, henceforth referred to asNew York Curriculum Textbooks(NYCT).
We perform a number of pre-processing steps for all the textbooks, including eliminating irrelevant fragments, such as repeated instructions or text intended for instructors rather than students.
PCT LCT
Level 1 Grades 1-3 Part 1 (Beginner)
Level 2 Grades 4-6 Part 2 (Advanced Beginner)
Level 2 Grades 7-9 Part 3 (Intermediate)
[image:3.595.165.432.476.546.2]Level 4 Grades 10-12 Part 4 (Advanced Intermediate) Table 1: Restructuring the curricula into four parts.
3.1 PCT: Grammar-Based Method
In the Palestinian educational system, English is taught as a second language from first grade, all through high school and the first year of university. Softcopies of the textbooks were acquired through direct communication with the Palestinian ministry of education.
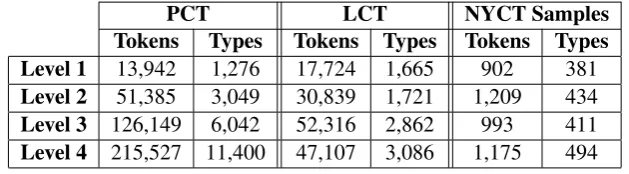
PCT LCT NYCT Samples Tokens Types Tokens Types Tokens Types Level 1 13,942 1,276 17,724 1,665 902 381
Level 2 51,385 3,049 30,839 1,721 1,209 434
Level 3 126,149 6,042 52,316 2,862 993 411
[image:4.595.140.455.70.157.2]Level 4 215,527 11,400 47,107 3,086 1,175 494
Table 2: Dataset statistics: Palestinian Curriculum Textbooks (PCT), Lane’s Course Textbooks (LCT), and New York Curriculum Textbooks (NYCT) samples
3.2 LCT: Communicative Method
Lane’s course, LCT, is a generic English learning textbook with four different levels: Beginner, Advanced Beginner, Intermediate and Advanced Intermediate. The textbooks are designed per the communicative teaching method. It also uses a controlled vocabulary set that is gradually augmented with new words that can be put together and inflected in various ways. Table 2 provides statistics about LCT, grouped by the different parts.
In addition to difference in teaching method between PCT and LCT, we observe other factors that could affect the readability evaluation. PCT targets learners with a specific first language (L1), which might influence the structure and language of the corresponding textbooks. LCT, on the other hand, is not tailored to a specific type of learner. PCT is also designed to be taught over a 12-year period, spanning the Palestinian educational system, while LCT is not restricted to any specific duration. In fact, LCT is most likely be taught at a much accelerated pace.
Another major difference between the two curricula is the age range of the intended target audience. PCT’s target learners fall within the 6-18 age bracket, whereas LCT likely caters to an older target audience, although no explicit mention of that was found in the textbooks.
3.3 NYCT Samples
For samples of English learning as L1, we use excerpts of English literature recommended for various grades within the educational system of the State of New York. The full text for the works of literature were difficult to get ahold of. We used excerpts of each piece instead, which was sufficient for our purposes. Table 2 presents some details and statistics of the used texts.
4 Readability Algorithms
In this section, we present the different readability algorithms we employ in this paper. We group them in two sets. First are conventional readability algorithms that have been extensively used for English. And second are two Support Vector Machine (SVM) readability classifiers that we train on the specific datasets – PCT and LCT. All readability algorithms are applied to all the datasets discussed above. The results are discussed in Section 5.
4.1 Conventional Readability Analysis Algorithms
We use three traditional readability analysis tools: Flesch Reading Ease scores (FRE), Flesch-Kincaid Grades (FKG) and Dale-Chall (DC) scores. Both FRE and FKG rely on the same text features to quantify readability: word length and sentence length, but they vary in relative weights attributed to these factors, as well as the interpretation of their respective scores. While FRE increasing scores indicate decreasing reading difficulty, FKG results of increasing grade levels correlate with increasing reading difficulty.
words are defined by a set of 3,000 words considered accessible to 4th grade level US students and above. Any words outside that list are considered difficult.
4.2 Readability Classification Using Machine Learning
The traditional readability algorithms discussed above provide a generic view of text. To create a more domain and context-specific readability analysis, we build our own machine learning classifiers trained on the specific datasets we study in this paper (PCT and LCT). In designing our classifiers, we build on previous contributions that study relevant features for readability analysis using SVM (Heilman et al., 2008; Petersen and Ostendorf, 2009; Feng et al., 2010).1 We use a number of lexical and syntactic features, which we discuss next.
Lexical features The lexical features reflect the significance of the words and vocabulary of the analyzed text towards the overall readability of the text, capturing word and phrase-level (as bigrams) attributes. The following lexical features are used in the classifier learning: unigrams, bigrams, syllable counts, types-to-tokens ratio (TTR), and ratio of function words, such as arti-cles, particles and pronouns, among others. Pre-processing includes lowercasing and punctua-tion removal.
Syntactic features We use the Stanford Parser (De Marneffe et al., 2006) to obtain dependency parses for the sentences. The Stanford Parser produces syntactic structures in the form of triplets, containing the relation name, governor (and its POS) and dependent (and its POS). We only use the POS tags of the governor and dependent words and their relation name. The idea is to use the de-lexicalized syntactic patterns that are observed in the document.
We measure the accuracy of the classifiers using 10-fold cross-validation on the training datasets. The cross-validation accuracy scores for PCT are noticeably higher than those of LCT, with around 83% and 72% respectively. We cannot draw any concrete readability conclusions based on the classifier accuracy since the training used different training datasets with different sizes.
5 Results and Analysis
We first present an overview of the vocabulary sizes in Section 5.1, and the results for the read-ability algorithms in Section 5.2. Then we discuss the results for the readread-ability classifier in Section 5.3.
5.1 Vocabulary Size and Growth Rate
Coverage Growth Coverage Intersection
PCT LCT PCT LCT
Level 1 9.6% 29.4% 29.9% 23.9%
Level 2 25.5% 46.9% 27.3% 36.6%
Level 3 53.4% 74.67% 24.2% 42.7%
Level 4 100.0% 100.0% 21.3% 52.4%
[image:5.595.143.453.568.665.2]Total Vocabulary 13,388 5,442 13,388 5,442
Table 3: TheCoverage Growth presents ratios of PCT and LCT cumulative vocabularies over their respective total vocabularies. TheCoverage Intersectionpresents ratios of intersections of PCT and LCT cumulative vocabularies over their respective total vocabularies.
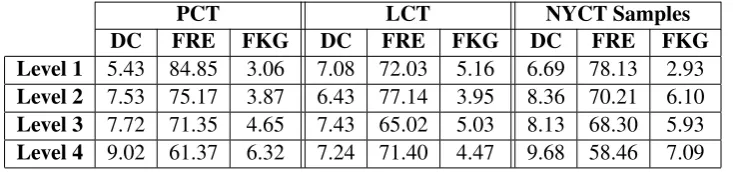
PCT LCT NYCT Samples
DC FRE FKG DC FRE FKG DC FRE FKG
Level 1 5.43 84.85 3.06 7.08 72.03 5.16 6.69 78.13 2.93
Level 2 7.53 75.17 3.87 6.43 77.14 3.95 8.36 70.21 6.10
Level 3 7.72 71.35 4.65 7.43 65.02 5.03 8.13 68.30 5.93
[image:6.595.116.483.70.156.2]Level 4 9.02 61.37 6.32 7.24 71.40 4.47 9.68 58.46 7.09
Table 4: Readability scores of all datasets: Palestinian Curriculum Textbooks (PCT), Lane’s Course Textbooks (LCT), and New York Curriculum Textbooks (NYCT) samples
In Table 3, we present two sets of results comparing the vocabulary progression at different levels for PCT and LCT –Coverage GrowthandCoverage Intersection.
Coverage Growth Coverage Growth is defined as the ratio of PCT and LCT cumulative vo-cabularies over their respective total vovo-cabularies:
Coverage Growth(P CT) = ||P CT1P CT1,i|
,4| Coverage Growth(LCT) =
|LCT1,i|
|LCT1,4| WhereP CT1,i and LCT1,i represent the cumulative vocabulary for Level 1 up to Level iof PCT and LCT, respectively. The actual counts of total vocabularies are indicated in the last row of Table 3. The difference between PCT and LCT is stark. LCT introduces a relatively bigger portion of the overall vocabulary at Level 1, and maintains a smaller growth rate than PCT. PCT, on the other hand, starts with a relatively small percentage of the vocabulary at Level 1, but maintains a much higher growth rate. This difference in vocabulary growth rates is consistent with the expected vocabulary use in the grammar-based and communicative methods.
Coverage Intersection Coverage Intersection is defined as the ratio of the intersectionof PCT and LCT cumulative vocabularies over their respective total vocabularies. The Coverage Intersection formula below is for PCT, to calculate the metric for LCT replace the denumerator with the corresponding LCT values.
Coverage Intersection(P CT) = |P CT1,i∩LCT1,i|
|P CT1,4|
While the total vocabulary of PCT is over twice as large as LCT, the intersection between the two only accounts for half of LCT and one-fifth of PCT. Furthermore, while the intersection ratio of PCT in Level 1 is higher than that for LCT in Level 1, the intersection ratios for PCT drop slowly, while those for LCT grow at a higher rate. These observations indicate that in addition to the difference in vocabulary coverage growth discussed above, the choice of vocabulary is rather different. This is likely to affect how readability algorithms will perform on these two textbook collections.
5.2 Conventional Readability Analysis Algorithms
Table 4 shows the various readability scores (DC, FRE, FKG) of the different textbook sets (PCT, LCT, NYCT) for Levels 1 through 4.
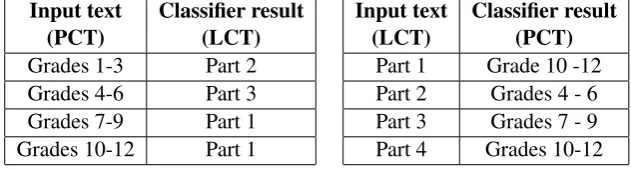
Input text
(PCT) Classifier result(LCT)
Grades 1-3 Part 2
Grades 4-6 Part 3
Grades 7-9 Part 1
Grades 10-12 Part 1
Input text
(LCT) Classifier result(PCT)
[image:7.595.139.455.72.157.2]Part 1 Grade 10 -12 Part 2 Grades 4 - 6 Part 3 Grades 7 - 9 Part 4 Grades 10-12 Table 5: Classifying the texts of each set by the classifier of the other.
Input text
(NYCT) Classifier result(PCT) Classifier result(LCT)
The Stupid Smelly Bus (2nd grade) Grades 1 - 3 Part 2
The Giver (6th grade) Grades 7 - 9 Part 4
A House on Mango Street (8th grade) Grades 10 - 12 Part 1 Things Fall Apart (12th grade) Grades 10 - 12 Part 4 Table 6: Classifying the US excerpts (NYCT Samples) by each of the classifiers.
the readability behavior. It is worth noting here is that the negative correlation is the result of the FRE score indicating the ease, rather than the complexity, of the readability.
For LCT, the readability scores show no clear pattern with the course levels they indicate as they progress. Level 1 shows noticeable high scores across all metrics for a beginner’s course, for example. FRE, DC and FKG values show clear fluctuations in the overall complexity values they reflect. The fluctuations in all these metrics, however, seem to correlate with each other as shown at the table, indicating that the fluctuating behavior is not a result of bias at certain metrics. The correlation coefficient R scores for the three pairs also show consistency here as well. The R value for FKG and DC is 0.773, FKG and FRE is 0.737 and DC and FRE is -0.92. The high R values indicate a correlation between the readability scores, and hence show consistency of the readability behavior
Finally, for NYCT Samples, the results match the actual grade designation of the texts. This also agrees with the pattern of the L2 school textbooks (PCT) in following an incremental grade growth.
5.3 Domain-Specific Readability: Machine Learning Classification
Table 5 presents the results for the text of each level of each collection (PCT or LCT) as an input to the classifier trained on the other textbook collection (LCT or PCT, respectively). The results for LCT show that the tags do not follow a clear readability progression pattern. The results for PCT, on the other hand, fit the original grade progression pattern of the educational system well. Table 6 shows the results for classifying the NYCT Samples by both classifiers. The results show a more structured readability progression pattern for the PCT classifier, similar to the patterns we have seen before for this set. The results for LCT classifier, however, do not follow the original levels progression of the NYCT Samples. This indicates no clear pattern of the readability progression of LCT, as seen for the previous results. Finally, the NYCT Samples have higher readability levels than both PCT and LCT, which matches the intuition of studying English as an L1 versus L2 language.
5.4 Discussion
the other hand, used as an example of the grammar-based teaching method, showed a clear complexity progression with increasing grades. More samples of both approaches need to be analyzed before making a generalization, but this should serve as a cue. Moreover, results indi-cate that the complexity of both sets is relatively lower than that of the US text samples, as an L1. The lack/presence of the progression structure may indicate higher/lower dependency on the textbooks themselves in the learning process, where the lack of structure in LCT might poten-tially be compensated by more effort from the teacher’s side. The domain-specific readability classifier, implemented using machine learning approaches, served well in supporting the vo-cabulary progression claim also by showing clear progression complexity for the PCT classifier when classifying the NYCT texts, compared to the LCT classifier.
6 Conclusions and Future Work
We presented a computational approach for analyzing ESL teaching methods. We did so by performing readability progression analysis on textbooks following two different methods (grammar-based and communicative). Our experiments indicated that the grammar-based riculum showed a more coherent readability progression compared to the communicative cur-riculum. This finding corroborates with the expectations about the differences between these two methods and validates our approach’s value in comparing different teaching methods quan-titatively.
Future work includes analyzing more textbooks that follow each of the covered teaching meth-ods, along with other methods. It will also be interesting to consider L2 language teaching for varied L1 languages. The two curricula we studied were differently paced. It will also be inter-esting to consider other curricula targeting different initial age-groups and with different planned durations. Finally, we will extend the classifier to be able to classify other texts to the most rel-evant teaching method and level, which may be of great value to education research.
Acknowledgement
We would like to thank the Palestinian Ministry of Education and Higher Education for providing us with the Palestinian English curriculum textbooks.
References
John PB Allen and Henry G Widdowson. 1974. Teaching the communicative use of english. IRAL-International Review of Applied Linguistics in Language Teaching, 12(1-4):1–22.
Rebekah George Benjamin. 2011. Reconstructing readability: Recent developments and recommenda-tions in the analysis of text difficulty. Educational Psychology Review, 24(1):63–88.
Kevyn Collins-Thompson. 2014. Computational assessment of text readability: A survey of current and future research. ITL-International Journal of Applied Linguistics, 165(2):97–135.
Scott A Crossley, David F Dufty, Philip M McCarthy, and Danielle S McNamara. 2007. Toward a new readability: A mixed model approach. InProceedings of the 29th annual conference of the Cognitive Science Society, pages 197–202.
Edgar Dale and Jeanne S Chall. 1948. A formula for predicting readability: Instructions. Educational research bulletin, pages 37–54.
Marie-Catherine De Marneffe, Bill MacCartney, Christopher D Manning, et al. 2006. Generating typed dependency parses from phrase structure parses. InProceedings of LREC, volume 6, pages 449–454.
William H DuBay. 2008. Unlocking language: The classic readability studies. IEEE Transactions on
Lijun Feng, Martin Jansche, Matt Huenerfauth, and No´emie Elhadad. 2010. A comparison of features for automatic readability assessment. InProceedings of the 23rd International Conference on Compu-tational Linguistics: Posters, pages 276–284. Association for Computational Linguistics.
Rudolf Franz Flesch et al. 1949. Art of readable writing.
Thomas Francois and Eleni Miltsakaki, 2012. Do NLP and machine learning improve traditional read-ability formulas?, pages 49–57. Association for Computational Linguistics.
Michael Heilman, Kevyn Collins-Thompson, and Maxine Eskenazi. 2008. An analysis of statistical models and features for reading difficulty prediction. InProceedings of the Third Workshop on Inno-vative Use of NLP for Building Educational Applications, pages 71–79. Association for Computational Linguistics.
J Peter Kincaid, Robert P Fishburne Jr, Richard L Rogers, and Brad S Chissom. 1975. Derivation of new readability formulas (automated readability index, fog count and flesch reading ease formula) for navy enlisted personnel. Technical report, DTIC Document.
Richard R Lane. 1978. English as a second language. EIC.
Edward Loper and Steven Bird. 2002. Nltk: The natural language toolkit. InProceedings of the ACL-02 Workshop on Effective Tools and Methodologies for Teaching Natural Language Processing and
Com-putational Linguistics - Volume 1, ETMTNLP ’02, pages 63–70, Stroudsburg, PA, USA. Association
for Computational Linguistics.
Fabian Pedregosa, Ga¨el Varoquaux, Alexandre Gramfort, Vincent Michel, Bertrand Thirion, Olivier Grisel, Mathieu Blondel, Peter Prettenhofer, Ron Weiss, Vincent Dubourg, Jake Vanderplas, Alexan-dre Passos, David Cournapeau, Matthieu Brucher, Matthieu Perrot, and ´Edouard Duchesnay. 2011. Scikit-learn: Machine learning in python.J. Mach. Learn. Res., 12:2825–2830, November.
Sarah E Petersen and Mari Ostendorf. 2009. A machine learning approach to reading level assessment.
Computer speech & language, 23(1):89–106.
Ildik´o Pil´an, Elena Volodina, and Richard Johansson. 2014. Rule-based and machine learning approaches for second language sentence-level readability. InProceedings of the Ninth Workshop on Innovative
Use of NLP for Building Educational Applications, pages 174–184.
Ildik´o Pil´an, Sowmya Vajjala, and Elena Volodina. 2016. A readable read: Automatic assessment of language learning materials based on linguistic complexity.arXiv preprint arXiv:1603.08868. Janice Redish. 2000. Readability formulas have even more limitations than klare discusses. ACM
Journal of Computer Documentation, (3):132–137.
Jack C Richards and Willy A Renandya. 2002. Methodology in language teaching: An anthology of current practice. Cambridge university press.
Lixiao Zhang, Zaiying Liu, and Jun Ni. 2013. Feature-based assessment of text readability. In2013
Seventh International Conference on Internet Computing for Engineering and Science, pages 51–54.