Population Projections
By MR. J. F. KNAGGS and MR. T. KEANE
{Read before the Soriety on JO December, 1971)
The Central Statistics Ot¥ce has developed a fairly general computer programme for making population projections. This paper is intended to give details of how the programme works and of the type of assumptions which form the computer input. The factors which enter into the calcula-tions are rates of mortality, net emigration or immigration, fertility and marriage and assumptions are made concerning the levels of these factors as they affect each age group over various periods in the future. The paper also eontains/spmd of the results obtained on assumptions which appear reasonable on the basis of present trends.
It is, of course, not essential to have a computer to produce population projections. The necessary arithmetic can be done using desk calculating machines and the Central Statistics Off ce has, in the past, prepared many such projections. Among these I might mention the projections contained in the N.I.E.C. Report on Full Employment .The disadvantage of manual methods is that the amount of arithmetic involved is very great even when simplifying methods are used such as working in five-year age groups rather than single years of age. When a range of assumptions is to be tested or when projections are to be done for regions of the country, the amount of work quickly becomes prohibitive. With the computer, however, once the necessary input material has been prepared, a projection for a series of years may be made in a few minutes and a set of county pro-jections in less than an hour.
V
31
While I have just spoken of the number of women aged 20 in 1971, the age classifications from the 1971 Census of Population are not yet available and the most recent census information on ages is for 1966. AH that is yet available from the 1971 census are the preliminary total population figures, for the State and various units of area. The computer input therefore comprises the 1966 classification of the population by ages and the 1971 figures given in the paper are derived as projections of the 1966 position. However, since the total numbers of births, deaths and net emigrants in 1966-71 are already known, these are used as input assump-tions for the programme so that the 1971 total population agrees with the census. Of course, when the 1971 age classifications become available, these will be used as computer input for future work.
I now want to consider the various assumptions and methods in greater detail. Taking mortality first, Table 1 shows the factor Lx+5/Lx, denoted by Sx, from the 1951, 1961 and 1966 Life Tables. This factor shows the proportion of persons aged x last birthday surviving five years when subject to the mortality rates observed at each of these dates. While there was a fairly substantial increase in the proportion surviving five years between the 1951 and 1961 Life Tables, both for males and females and over all age groups, the improvement between 1961 and 1966 was not nearly so marked, particularly for males. In the case of males, the only
TABLE 1
PROPORTION OF PERSONS AT CERTAIN AGES SURVIVING 5 YEARS ACCORDING TO THE 1951, 1961 AND 1966 LIFE TABLES
Age last birthday
0 5 10 15 20 25 30 35 40 45 50 55 60 65 70 75 80 85 90
Males 1951
•97965 •99582 •99655 •99373 •99007 •98848 •98635 •98311 •97655 •96416 •94451 •91651 •87585 •81062 •70967 •55968 •40373 •26240 14932
1961 •99079 •99759 •99784 •99629 •99480 •99379 •99206 •98853 •98338 •97226 •95166 •92345 •87891 •81650 •73415 •59716 •41915 •24549 •11270
1966 •99281 •99784 •99792 •99619 •99461 •99443 •99342 •98955 •98378 •97355 •95238 •92309 •87249 •80888 •72059 •60520 •43649 •26205 •12302
i ' 1
Females1951 •98268 •99656 •99637 •99320 •98987 •98824 •98663 •98298 •97895 •97092 •95696 •93459 •90087 •84506 I •74652 •60859 •46272 •32481 •20701
1961 •99201 •99806 •99857 •99795 •99690 •99587 •99318 •99039 •98685 •97808 •96398 •95101 •92020 •87127 •78645 •65555 •49126 •32448 •18298
1966 •99378 •99837 •99872 •99819 •99758 •99644 •99505 •99278 •98744 •97924 •96719 •95212 •92217 ! •87888 I •78759 •66736 i •50789 •34112 •19579
TABLE 2
EXPECTATION OF LIFE AT CERTAIN AGES
Ireland Age 0 5 15 25 35 45 55 65 75 85 1951 64-53 63-55 5400 44-76 35-76 26-98 18-97 1212 6-79 3-68 Males 1961 6813 65-67 55-95 46-39 36-96 27-83 19-50 12-56 7 1 4 3-54 1966 68-58 65-70 55-95 46-41 36-90 27-72 19-33 12-44 7-29 3-67 1951 67 08 65-38 55-81 46-64 37-68 28-92 20-63 13-32 7-57 4-23 Females 1961 71-86 68-97 59-20 49-47 39-93 30-70 22-14 14-37 8 1 3 4-21 1966 72-85 69-63 59-83 5005 40-42 31-08 22-43 14-65 8-35 4-35
England and Wales
Age 0 5 15 25 35 45 55 65 75 85 1951 65-8 63-5 53-9 44-4 3 5 1 25-9 17-8 1 1 2 6-4 3 1
Males
1960-2
68 0 6 5 1 55-3 45-8 36-3 27 0 18-7 1 2 0 7-1 3-9 1965-7 68-7 65-4 55-6 46-2 36-6 27-3 18-9 12-2 7-3 4.0 1951 70-9 6 8 1 58-4 48-8 39-3 3 0 1 21-5 13-8 7.6 3-8 Females 1960-2
7 4 0 70-6 60-8 51 0 41-4 3 2 0 23-2 15-2 8-8 4.5 1965-7 74-9 71-3 61 5 51-8 42-1 32-7 23-9 15-9 9.4 5 0 Sweden Age 0 5 15 25 35 45 55 65 75 85 Males 1941-5
6 7 1 6 5 1 55-7 4 7 0 3 8 1 29-3 21 0 13-7 7-8 4 0 1961 71-6 68-2 58-5 4 9 0 39-5 30-2 21-5 1 4 0 8 1 4-2
1967
71-9 6 8 1 58-3 48-8 39-4 30-2 21-5 1 4 0 8-2 4-4
1941-5
33
U.S.A.
Age
0 5 15 25 35 45 55 65 75 85
1950
59-2 58 0 48-5 39-7 31-5 23-8 17-6 13-3 9-3 6 0
Males
1962
66-8 6 4 1 54-4 45-1 35-9 2 7 0 19 3 129 8 0 4-3
1967
6 7 0 63-9 54-2 4 5 1 35-9 27-1 19-3 1 3 0 8-3 4-7
1950
63-2 61-4 51-9 42-9 34-4 26-6 20-2 15-6 1 1 0 7.4
Females
1962
73-4 70-3 60-6 50-9 41-4 32-2 23-7 15-9 9-5 4-8
1967
74-2 70-9 611 51-5 41 0 32-8 24-2 16-4 1 0 0
5-0 j i
improvement was in the case of the youngest ages and, apparently, at ages 75 and over although at these later ages it is difficult to say whether the improvements are genuine or are due to minor inaccuracies in the statement of age at death or at the census of population. In the case of females, although the rate of improvement between 1961 and 1966 was not as great as between 1951 and 1961, nevertheless it extended to all age groups. As a further guide to likely future trends in mortality in Ireland we looked at the position in a number of other countries. The expectation of life figures for Ireland, England and Wales, the U.S.A. and Sweden are shown in Table 2 (Expectation of life figures, rather than proportions surviving were chosen because they were more readily available). All show a similar picture, namely that while female mortality is continuing to ' decline, male mortality is levelling off and the excess in female life expect-ancy is increasing. We have therefore assumed, for the projections given * in this paper, that male mortality will improve slightly, following the 1961-66 trend, at ages undgr 15 years and will remain steady, at the 1966 level for higher ages. For females we have assumed that mortality will continue to fall, at the 1961-66 rate for all ages up to 80 years and that it will remain steady at the 1966 level after 80 years of age.
EMIGRATION
five-year period (although, if desired, the relative numbers of males and females may be varied). The 1961 and 1966 census age distributions also form part of the computer input and, using these, the rates of net emigration for individual ages^on the\1961-66 experience are calculatedJ3iese~fates are scaled up or down to give the desired total for each five-year interval. This means that, whatever the absolute numbers assumed to emigrate in any period, the relative values of the rates for the different ages remain constant or, in other words, the shape of the emigration rale curve shown-tfr The appended diagram remains unchanged, although its amplitude may vary. You will notice from the diagram that there was immigration at ages 25-40 years for males and at a lesser extent, at ages 25-35 for females and also at ages 62-72 for both males and females between 1961 and 1966. The programme maintains this pattern in all subsequent periods. Provision has been made in the programme to vary these relative rates if desired although, in anything done to date, we have not departed from the 1961-66 pattern. It may occur to you that we have chosen a rather elaborate way of feeding in the emigration assumptions. It would have been much simpler to specify the assumptions as regards emigration rates from the State at the different ages in advance, rather than to have the programme calculate them from the 1961 and 1966 population figures, However, a general programme was required which could be utilised not only for the State, but also for particular regions, with their differing emigration by age patterns. It would have been extremely difficult to find an acceptable set of age-specific emigration rates to be applied to the different regions giving emigration figures consistent with those for the State, not merely as regards totals, but for each year of age. The method adopted achieves this to a very close degree of approximation.
35
As regards ages over 1 year, the allocation of net emigration over the individual years of age is done in the following way:—Comparing the 1961 and 1966 Census results by ages| the proportion surviving in the State from\age x in 1961 to age x + 5 in 1966 is calculated for each age (for each sex separately). Call this Rx.
(1966) p(1961)
i.e. Rx-P
X+5 X
There are two sources of decrement here, death and emigration. Assum-ing no emigration the proportion survivAssum-ing would be Sx (already referred to) and the value would be for the mid-point on the curve between 1961 anoM9£fLIf one calculates M X=RX/SX the Mx represents the proportion 'Surviving five years if there was emigration but no deaths. Although this is an abstract concept, the resulting calculations are mathematically perfectly valid. A jagged set of values of Mx is obtained on the 1961-66 experience. A smoothed set of Mxs form the basis of the emigration assumptions. Emigration rate =Q2 X=1-MX. All the Q2s are scaled up or down by a constant factor K to produce the desired total emigration. The total net emigration at ages over 1 year, assuming 1961-66 rates apply, is given by
the formula: ^ (1966)
S P x Q ' x d - i Q ' x )
Suppose for the period 1971-76 for males, this figure worked out at 40,000. The assumption we are aiming at is 27,000 i.e. half of the 54,000 mentioned earlier. By multiplying the Q2x s by the factor 27,000/40,000 the net emigration for males over one year is adjusted to 27,000. Then the survivors in Ireland in 1976 out of the population aged x in 1971, i.e.
(1976) (1971)
P is P SX(1-KQ2X).
x+5 X
In this way the number of males and females at each year of age over five years is calculated. Persons aged under 5 years in 1971 would not, of course, have been born in 1966 so that to calculate these, assumptions about marriage and fertility rates must be made.
TABLE 3
AVERAGE ANNUAL NET EMIGRATION IN INTER CENSAL PERIODS, 1926 TO 1971
!
Period
! 1926-36 1936-46 1946-51 1951-56 1956-61 1961-66 1966-71
1926-71
i Net I
Persons
j 16,675 ' 18,712 24,384 ! 39,353 42,400 1 16,121 j 12,184
22,798
emigration (annual)
Males
7,255 11,258 10,309 21,657 21,914 7,523 5,627 ;
11,558 ;
Females
9,420 7,454 14,075 17,696 20,486 8,598 6,557
11,240
Females per 1,000 males
1,298 662 1,365 817 935 1,143 1,165
The net emigration assumption for periods in the future is the most critical item, at least in the short-term, in affecting the level of the pro-jected population. In making assumptions on this item, one will naturally have regard to the levels in the past, as set out in Table 3.
The final figure in this table is our justification for assuming that equal numbers of males and females will emigrate in the future. Although there will probably continue to be fairly wide fluctuations in the male/female ratio among emigrants in succeeding five-year periods, overja .long-period one would expect this ratio to remain near unity on the basis of the 1926-71 experience, v
The NIEC Report on Full Employment included, among other popula-tion projecpopula-tions, one assuming an annual average net emigrapopula-tion of 18,000 persons in the period 1966-71, 13,000 persons in 1971-76, 8,000 in 1976-81 and 5,000 per annum after 1981. The Buchanan Report considered that these assumptions would be consistent with the future employment opportunities which might be achieved in favourable circumstances for economic growth. As the work of Buchanan was the most detailed projec-tion yet carried out for Ireland these emigraprojec-tion assumpprojec-tions are an obvious choice to be tested on the C.S.O. programme.
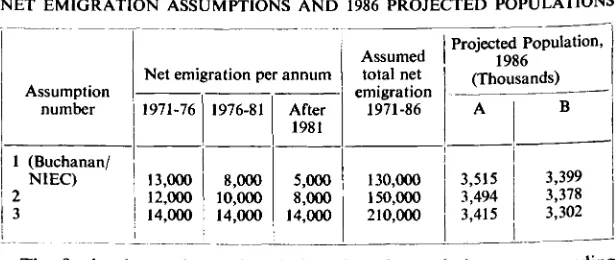
[image:7.364.44.352.365.495.2]While we experimented with many di.Terent emigration assumptions, ranging from zero to 20,000 per annum, a number of these appeared unrealistic when taken with present-day marriage and fertility trends. For this paper we have confined our attention to two sets of assumptions in addition to the Buchanan/NIEC projection already mentioned. Our three sets of emigration assumptions are as set out in Table 4.
TABLE 4
NET EMIGRATION ASSUMPTIONS AND 1986 PROJECTED POPULATIONS
Assumption number
1 (Buchanan/ NIEC) 2 3
Net emigration per annum
1971-76
13,000 12,000 14,000
1976-81
8,000 10,000 14,000
After 1981
5,000 8,000 14,000
Assumed total net emigration
1971-86
130,000 150,000 210,000
Projected Population, 1986
(Thousands)
A
3,515 3,494 3,415
B
3,399 3,378 3,302
\ lower, 81,000 in 1961-66Jand 61,000 in/l966-71i Using factors provided in w the Buchanan Report (Technical Volume I, Table 23), we calculate that r his 1986 projection should be increased by )95,400 to correct for this overstatement of net emigration. This gives a "Buchanan" projection for , 1986 of 3,597,000 compared with the CSO projection on fairly similar
assumptions of 3,515,000.
» ALTERNATIVE APPROACH TO EMIGRATION ASSUMPTIONS
The principle of specifying emigration figures for future periods has" been criticised on the grounds that emigration is not something that can be directly determined by policy decisions but can be influenced only indirectly by numbers of jobs provided.vft was suggested that the computer programme would be more valuable if the total number at work, dis-tinguishing males and females, at various dates in the future were to form the input while the emigration corresponding to this emerged as output, v We modified our original programme to do this or rather so that the total labour force (at work plus out-of-work) formed the input, It was necessary also to feed into the computer assumptions about future participation rates so that it could convert from labour force to total population figures. While this approach worked reasonably well for males it failed to give useful results for females for the reason that the participation rates, which were critical in determining the resulting emigration levels, could not be projected with sufficient precision. As emigration is concentrated mainly in the working age groups and as the participation rates for males in most age groups are over 90 per cent, this means that, as far as males are concerned, one job more is one emigrant less. For females aged 15-64 years, however, the participation rate is about 35 per cent so that one job more is equivalent to three emigrants less. Looking at it another way we calculated that, given a figure for the total female labour force at a future date, say 1981, the effect of changing the participation rate from 36 to 37 per cent would be equivalent to changing the female net emigration in the preceding five years from 7,000 to 29,000. With the many conflicting factors affecting the female participation rate including on the one hand longer periods of education, earlier marriages, higher marriage rates and earlier retirement, and on the other more employment opportunities for women, single or married, it is difficult to predict the overall participation H|te_to_ within ten per cent, let alone to the fraction of a per cent needed if the future jobs are7 to be used as a means of arriving at future population. If one sets the participation rate too low, or the number of jobs too high, the programme reconciles the two by calculating a substantial female immigration.
MARRIAGE RATE ASSUMPTIONS
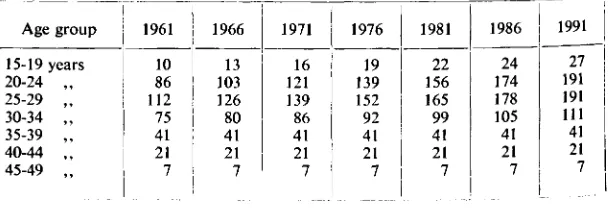
to date, as to the future trend in marriage rates. The number of women at each year of age marrying per 1,000 single women of that age was calculated for the years 1961 and 1966. It is assumed that the corresponding rates for future years are linear projections of the 1961-1966 trend. The overall marriage rates for the State only are used, even for regional or county projections. A complication arises due to the large number of couples who emigrate immediately after marriage. It will be seen from the Report on Vital Statistics, 1968 that, although 18,993 marriages took place in that year, in 2,293 of these the area of future residence of the couple was stated to be outside Ireland. The foregoing calculations were, therefore, carried out excluding such marriages and the rates entering into the projections are, in fact, what might be called ''marriage, stay at home, rates". The rates assumed in the projections are shown in Table 5.
TABLE 5
ASSUMED "MARRIAGE, STAY AT HOME RATES" PER 1,000 SINGLE WOMEN, 1966-1991
Age group 15-19 years 20-24 „ 25-29 „ 30-34 „ 35-39 „ 40-44 ,, 45-49 ,,
1961 10 86 112 75 41 21
1966 13 103 126 80 41 21 7
1971 16 121 139 86 41 21 7
1976 19 139 152 92 41 21
1
1981 22 156 165 99 41 21 7
1986 24 174 178 105 41 21 7
1991 27 191 191 111 41 21
7 ...
Despite the steep rise in marriage rates shown in this table, the resultant percentages single, even by 1991, would not be exceptionally low by present-day international standards, as is shown in Table 6.
TABLE 6
PERCENTAGES OF WOMEN SINGLE AT AGES 15 TO 49 YEARS IN IRELAND, 1946-1991, AND IN VARIOUS COUNTRIES ABOUT
1961 Country and Year Ireland 1946 Ireland 1951 Ireland 1956 Ireland 1961 Ireland 1966 Ireland 1971 Ireland 1976 Ireland 1981 Ireland 1986 Ireland 1991 Albania 1955 Austria 1961 Czecheslovakia 1961 Denmark 1960 Germany (BRD) 1961 Greece 1961 Hungary 1960 Netherlands 1960 New Zealand 1961 Norway 1960 Peru 1961 Poland 1960 Portugal 1960 Spain 1960 Sweden 1960 United King- |
dom 1961 | United States | 1960 I Venezuela 1961 1 15-19 98-4 98-9 99-1 98-9 98-4 98-4 98 0 97-8 97-4 97-2 75-4 94 0 91-3 9 5 1
94-9 94-2 85-3 96-3 91 6 95-2 83-4 90-9 95-3 97-9 97-3 93-4 83-9 77-3 20-24 82-5 82-3 81-3 78-2 74-8 7 4 0 70-5 67-2 6 4 1 6 1 1
23-8 5 8 0
32-8 45-9 54-6 65-3 31 4 59-4 40-5 49-8 44-2 40-3 6 2 1 73-4 57-5 42 0 28-3 41-8 25-29 57-5 54-4 53-3 45-1 37-8 38-6 34-2 29-6 25-5 21-9 7-7 24-2 100 14-5 20-8 34-7 11-2 20-5 12 4 17-8 25 0 17-3 32 0 34-9 20-7 15-7 10-5 j 26-8 [ ! Age group 30-34 38-8 36-4 33-3 29-6 24 1 23-6 21 2 17-8 14 6 11-8 3-8 15 9 6-9 9-4 13-3 18-2 8-5 12 1 i 7-8 i 11-6 ! n-s : 140 21-8 ! 20-1 | 11 9 10 9 6 9 221 35-39 321 28-5 27-4 23-5 21-2 190 17 4 15-4 12-7 104 2-5 14-4 6-5 8-2 12-7 10 1 7-6 104 7-3 109 : 13 2 ! 1 5 1 I 18-2 ! 15 3 ! 100 | i 9-8 j 6 1 21 3 ! 40-44 27-6 26-7 23-6 2 2 0 19 5 18-2 16 4 14 9 13 2 10 8 1-7 12 4 6-2 8 1 10-8 8-2 7-4
i o i !
7-4 11 2 146 190 ! 16 9 15 5 ;
9 5 !
9-5 6 1 24 1 45-49 i 26-3 26-3 24-6 221 20-4 " 18-8 ; 17-2 15-4 140 .2-4 1-5 | 12 1 1 6-2 ! 9-4 j
9-3 ! n.a. 7-3 110 8-3 12-0 14-5 24.3 , 15 9 ' 14 6 110 10 5 6-5 24-6 FERTILITY ASSUMPTIONS
by Duration of Marriage" matrix was adjusted to mid-1968, i.e. the mid-point of the 1966-71 interval. The fertility rates derived from the 1961 inquiry were adjusted so that, when applied to this matrix, the total of legitimate births for the period 1966-71 was obtained.
The main part of the work in projecting the number of legitimate births in each five-year period consists of constructing this "Age at marriage by Duration of marriage" matrix at the mid-point of each five-year interval. This is done by applying suitable survivorship factors to the matrix for the period five years earlier. Thus the 0-4 years duration group in mid-1968 becomes the 5-9 years duration group in mid-1973. It is also necessary to insert the line of the matrix for duration of marriage 0-4 years, i.e. those marrying in the preceding five-year interval, as calculated from the marriage rates, already derived.
[image:11.362.87.300.352.486.2]Having obtained the "Age at marriage by Duration of marriage" matrix, fertility rates are applied to each cell of this matrix to give the legitimate births in the five-year period. The programme is arranged so that any desired assumptions may be made (in terms of a percentage increase or decrease on the 1966-71 level) for the fertility rate in each cell of the matrix. When it comes to making assumptions about future trends in fertility we are in a particularly difficult area because striking changes in the pattern and level of fertility have taken place in the most recent years. Table 7 shows an overall fertility index based on the ratio of actual legitimate births registered each year to the number expected if the population of married women experienced the age-specific fertility of the year 1961.
TABLE 7
FERTILITY OF MARRIAGE INDEX (1961=100)
Year 1951 1956 1957 1958 1959 1960 1961 1962
Index 97-4 991 100-6 98-2 99-8 101 1 1000 101-3
Year 1963 1964 1965 1966 1967 1968 1969 1970
Index 101-9 101-3 98-6 949 920 90-1 91-7 92-3
41
The 1971 Census results, and particularly the analysis of married women by age at marriage, duration of marriage and number of children will throw considerable light on the composition of these trends but in the meantime we must deduce what we can from the current birth registration statistics. These show that the decline in fertility from 1964 to 1968 was by no means evenly spread over all ages and parities. The greatest reduc-tions were in the case of older women and particularly those who already had large families. On the other hand the numbers of births to women who had been more recently married showed little evidence of a decline. Table 8 shows index numbers of fertility for two duration of marriage ranees for the years 1961 to 1970.
TABLE 8
FERTILITY OF MARRIAGE INDEX NUMBERS SPECIFIC FOR DURATION (1961=100)
Year
Duration of marriage
0-4 years 5 years and over
1961 1962 1963 1964 1965 1966 1967 1968 1969 1970
1000 103-2 1061 107-2 1060 103-7 10!-2 101-9 105-6 106-6
1000 101 3
101-6 990 98-4 94-7 92-2 890 89-5 90-3
For the projections given in this paper we have made two sets of fertility assumptions, expressed in terms of births per annum per married woman compared with the average for 1966-71, as
follows:-Assumption
A B
Duration of marriage
0-4 years
Constant
Decreasing by 1 % per annum
5 years and
Decreasing by I % Decreasing by 2%
over
per annum per annum
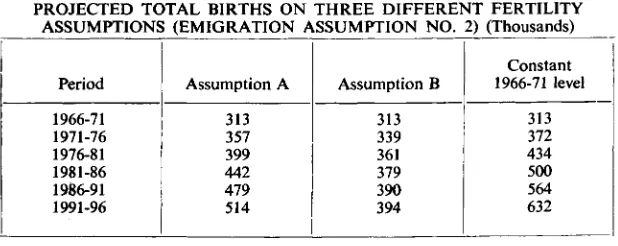
The total births in each five year period from 1971 to 1996 on assump-tions A and B are shown in Table 9. For comparison we have also done the projection assuming fertility constant at the 1966-71 level.
TABLE 9
PROJECTED TOTAL BIRTHS ON THREE DIFFERENT FERTILITY ASSUMPTIONS (EMIGRATION ASSUMPTION NO. 2) (Thousands)
Period
1966-71 1971-76 1976-81 1981-86 1936-91 1991-96
Assumption A
313 357 399 442 479 514
Assumption B
313 339 361 379 390 394
Constant 1966-71 level
313 372 434 500 564 632
The assumed rates of decrease of fertility may seem on the large side, especially when applied over an extended period. However, if we consider women aged 20-24 at marriage, their average completed family size on the basis of 1966-71 fertility rates would be 5-17 children. Taking our assumption B which involves the greater rate of decline, the average completed family size to women aged 20-24 at marriage on the basis of the 1991-96 fertility rates would be 3-63 children. In England and Wales the estimated mean completed family size for women marrying at ages 20-24 years in 1971 is 2-30 children.*
THE RESULTS
[image:13.363.41.350.118.241.2]The results of our six different projections are set out in the Appendix in which are given the population by five-year age groups at "Census" dates up to 1996. The population given by each projection is shown in Table 10.
TABLE 10
PROJECTED POPULATIONS
Projection No.
1A IB 2A 2B 3A 3B
1971
2,971 2,971 2,971 2,971 2,971 2,971
1976
3,092 3,074 3,097 3,080 3,086 3,069
1981
3,275 3,221 3,271 3,217 3,236 3,181
1971 TO
1986
3,515 3,399 3,494 3,378 3,415 3,302
1996 (Thousands)
1991
3,794 3,591 3,750 3,548 3,618 3,423
1996
4,113 3,790 4,039 3,721 3,843 3,539
Percentage increase
1971-96
38 28 36 25 29 19
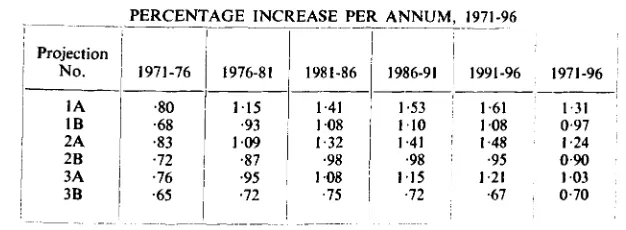
None of these projections could be said to show a startling rise in population. Projection 1A which assumed net emigration falling to 5,000 per annum and a slow rate of decline in fertility, shows a 38 per cent rise in population over the twenty-five year period 1971-96. Projection 3A, which assumes a steady net emigration of 14,000 per annum over the whole period coupled with a sharper fall in fertility, shows a 19 per cent increase. Table 11 shows the average percentage increase per annum in each five year period and over the entire period 1971-96.
TABLE 11
PERCENTAGE INCREASE PER ANNUM, 1971-96
Projection No.
1A IB 2A 2B 3A 3B
1971-76
•80 •68 •83 •72
•76
•65
1976-81
115 •93 109 •87 •95 •72
1981-86
1 41 108 1 32
•98 108 •75
1 i
1986-91 1991-96
1-53 i 1 61 110 108 141 I 148 •98 ! -95 115 121 •72 -67
1971-96
1 31 0-97 1 24 0 9 0 1 03 0-70
In each of the A projections the percentage rate of increase rises between successive five year periods. In the B projections also this rate rises in the earlier periods and then tends to level oT. Between the 1966 and 1971 censuses the average annual increase in population was 0-5 per cent and between the 1961 and 1966 censuses 0-4 per cent. None of the projections therefore involves a rate of increase which appears excessive when compared with that attained between 1961 and 1971. To carry the exercise further and to speculate as to which projection is likely to come closest to actual future developments is not possible without going into questions of future job availability, unemployment rates and participation rates which I have not attempted to do for this paper. I have simply chosen one of these projections, somewhat arbitrarily, as a basis for the county projections referred to later.
tables owe their origin to the distortions in the age structure brought about by the very heavy emigration in the 1951-61 period.
Thus of the persons in each of the age groups 10-14 years and 15-19 years in 1951, almost 40 per cent had emigrated by 1961. The losses from these age groups in other intercensal periods were not nearly so great, with the result that a dip in the age distribution curve, in respect of people born in the 1930s, will be noticeable for many years.
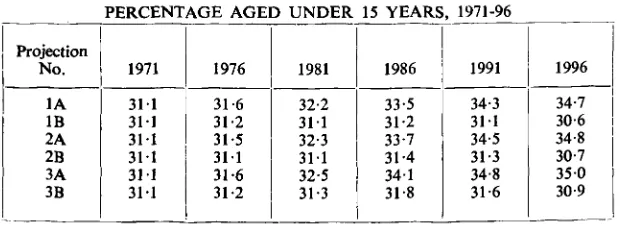
[image:15.363.43.353.196.310.2]Table 12 shows the percentage of the total population aged under 15 years in each of the projections.
TABLE 12
PERCENTAGE AGED UNDER 15 YEARS, 1971-96
Projection N o .
1A IB 2A 2B 3A 3B
1971
3 1 1 3 1 1 3 1 1 3 1 1 31 1 3 1 1
1976
31 6 31-2 31-5 3 1 1 31 6 31-2
1981
32-2 3 1 1 32-3 3 1 1 32-5 31-3
1986
33-5 31-2 33-7 31-4 3 4 1 31 8
1991
34-3 3 1 1 34-5 31-3 34-8 31-6
1996
34-7 30-6 34-8 30-7 3 5 0 30-9
It will be seen that the proportion of children under 15 in the population depends mainly on the fertility assumptions made. On the A assumption (involving a slow decline in fertility) the proportion of children rises steadily but not spectacularly, the percentages in the case of projections 1A, 2A and 3A all being very similar. In the B projections (involving a steeper decline in fertility) the proportion of children stays remarkably constant, at the 1971 level, all the way up to 1996.
[image:15.363.42.352.458.576.2]Table 13 shows the "dependency ratio", that is the ratio of persons aged under 15 and 65 and over to the number aged 15 to 64 years on each projection.
TABLE 13 DEPENDENCY RATIO
Projection No.
1A IB 2A 2B 3A 3B
1971
72-7 72-7 72-7 72-7 72-7 72-7
1976
7 4 0 73 0 73-8 72-8 74-3 73-3
1981
7 5 1 72-2 75-4 72-5 76-7 73-7
1986
77-3 71-4 78-3 72-4 80-4 74-5
1991
77-2 69-1 78-4 70-2 80-7 72-5
1996
In the case of each of the A projections, the dependency ratio rises to a peak somewhere between 1981 and 1991 and then begins to decline. In the case of projections IB and 2B, the dependency ratio reaches its peak value in 1976 and subsequently declines. In the case of projections 3B this peak value occurs in 1986.
REGIONAL PROJECTION
For planning purposes the country has been divided into nine Develop-ment Regions and we had thought, originally, that it would be sufficient to prepare projections for these regions. It has since become clear that the Regional Development Organisations are interested in obtaining projec-tions, not only for their entire areas, but also for the counties making up these areas and, if possible, for smaller districts, including individual towns. We have not gone into the problem of making tow projections to any extent but, as I mentioned earlier, the programme as it stands is perfectly suited to making county projections—provided, that is, the necessary input assumptions are available.
All the items involving assumptions, namely mortality, marriage, fertility and net emigration rates show differences between counties. As far as mortality is concerned, we have ignored county differences, applying the national rates to every county. We did this in the case of marriage and fertility rates also, but found that we got some sizable differences as regards county distribution between the actual births which occurred in 1966-71 and these calculated by the programme, although the total for the State was correct. For the county projections given in this paper we therefore applied overall correction factors to the fertility rates to give the observed numbers of births in each county in 1966-71. We applied these same factors to the county fertility rates for all periods up to 1991-96 assuming, in other words, that the present-day differences between counties as regards fertility will continue all the way up to 1996.
Projections up to 1996 are of somewhat academic interest and the various planning organisations are principally concerned with projections for the more immediate future, for 1976 and, at the furthest, 1986. Here the dominating factor is net emigration. Even though a figure may be set with some degree of confidence on the level of total net emigration from the State, the net emigration from or net immigration to counties, which are governed mainly by migration within Ireland, is much less predictable.
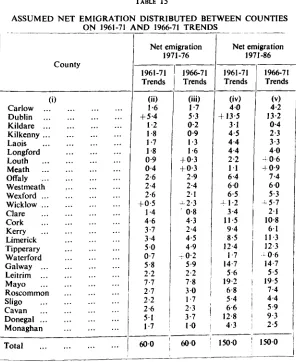
For this paper we have prepared one set of county projections only, corresponding to the projection No. 2A for the State. We allocated the assumed total net emigration (i.e. 60,000 in 1971-76, 50,000 in 1976-81 and 40,000 in each five year period thereafter) between counties pro-rata with the county distribution of net emigration actually observed in the ten years 1961-71. While there are a number of objections to this procedure it at least has the advantage of simplicity added to which it results in projected migration figures which are a composite of the "planned" and "secular" elements of the actual 1961-71 experience. The totals of the projected county population obtained in this way would not, in theory, be expected to be identical with the projected figures for the State as a whole, that is projection No. 2A. In fact, however, the differences are not sufficiently great to be of importance for most practical purposes. A closer degree of agreement could be obtained by modifying the county emigration assump-tions on the basis of the results obtained from the first computer run and preparing a second set of county projections. However, as each county projection takes the same length of time as a projection for the State, this was not thought to be worthwhile. The projected county totals are given
TABLE 14
COUNTY PROJECTIONS, 1971-96
! County Carlow Dublin j Kildare Kilkenny Laois Longford ! Louth
Meath ... ,.. Offaly Westmeath : Wexford Wicklow Clare i Cork Kerry ... Limerick Tipperary Waterford ... ! Galway Leitrim Mayo ... Roscommon Sligo Cavan Donegal Monaghan Total 1971
in Table 14. This information is, of course, available in much greater detail as regards age groups in the computer records.
We would hope that planning organisations interested in obtaining county projections would regard our results as a starting point for their work rather than the finished product, since they are in a much better position than we to say how local developments will influence, upward or downward, the migration figures used in our calculations. One can get a fair idea of how alternative emigration assumptions affect projected county populations from Table 15. Columns (ii) and (iv) of this table show the actual net emigration figures used in deriving the projections in Table 14. The assumed 60, net emigrants from the State in 1971-76 and the assumed 150,000 net emigrants from the State in 1971-86 are divided
pro-TABLE 15
ASSUMED NET EMIGRATION DISTRIBUTED BETWEEN COUNTIES ON 1961-71 AND 1966-71 TRENDS
County
Net emigration 1971-76
1961-71 Trends
1966-71 Trends
Net emigration 1971-86
1961-71 Trends
1966-71 Trends
(i)
Carlow Dublin ... Kildare ... Kilkenny ... Laois Longford Louth Meath Offaly Westmeath Wexford ... Wicklow ... Clare Cork Kerry Limerick Tipperary Waterford Galway ... Leitrim ... Mayo Roscommon Sligo Cavan Donegal ... Monaghan
Total
1-6 + 5-4 1-2 1-8 1-7 1-8 0-9 0-4 2-6 2-4 2-6 +0-5 1-4 4-6 3-7 3-4 5 0 0 7 5-8 2-2 7-7 2-7 2-2 2-6 5 1 1-7
600
(iii) 1-7 5-3 0-2 0-9 1-3 1-6 + 0-3 +0-3 2-9 2-4 2 1 - 2 - 3 0-8 4-3 2-4 4-5 4-9 -fO-2 5-9 2-2 7-8 3 0 1-7 2-3 3-7 1 0
600
(iv) 4 0 + 13-5 3 1 4-5 4-4 4-4 2-2 1 1 6-4 6 0 6-5 -J-I-2 3-4 115 9-4 8-5
12-4 1 7
14-7 56 19 2 6-8 5-4 6 6 12 8 4-3
150 0
(v) 4-2 13-2
04 2-3 3-3 4 0 -t 0 6
+ 0 9 7-4 6 0 5-3 ^5-7 21 10 8
61
11-3
12 3 0 6 147
5-5 19 5 7-4 4 4 5-9
9 3 2-5
[image:18.351.22.318.212.574.2]rata with the observed 1961-71 experience. In columns (iii) and (v) an alternative division is made, on the basis of the 1966-71 experience. For most counties the choice of 1961-71 or 1966-71 experience makes little difference. In the case of Dublin, Wicklow, Louth, Meath, Kildare and Waterford the 1961-66 and 1966-71 net emigration patterns were ver) different, so that the choice of 1961-71 or 1966-71 trends has a fair amount of influence on the results.
However, to return to the reason for introducing this table, it is to point out that, for any particular county, the eTect of increasing or decreasing the 1971-76 net emigration by 1,000 is simply to decrease or increase the 1976 population by 1,000. The effect of raising the 1971-86 net emigration figure for a county by 1,000 is rather greater than simply decreasing the 1986 population by 1,000 on account of the births and deaths which would have occurred among the 1,000 people and would have been credited to their home county had they not emigrated. The precise factor depends on how the net emigration is spread over the period 1971-86 and varies from county to county but we calculate roughly that 1,000 emigrants in 1971-86 is equivalent to a loss of population of 1,400 by 1986 on the basis of the various assumptions entering into projection 2A.
CONCLUSION
-49
Net 1971-76 12,000 emigration 1976-81 8,000 per 1981 and 5,000 annum after
APPENDIX
Fertility: Duration 0-4 years Duration 5 years-h constant — / %per annum
1 Age Group
0- 4 years 5- 9 „ 10-14 „ 15-19 ,, 20-24 „ 25-29 „ 30-34 „ 35-39 „ 40-44 „ 45-49 „ 50-54 „ 55-59 ,, 60-64 „ 65-69 „ 70-74 „ 75+ „ Total Males
0- 4 years 5- 9 „ 10-14 „ 15-19 „ 20-24 „ 25-29 „ 30-34 „ 35-39 „ 40-44 „ 45-49 „ 50-54 „ 55-59 ,, 60-64 „ 65-69 „ 70-74 ,, 75+ „ Total Females 0-14 years 15-44 „ 45-64 „ 65+ „ Total Persons i 1971 159-4 160-6 151-3 134-6 115 2 89-5 75-8 74-5 75-9 79-4 8 0 0 78-4 6 8 1 53 1 44-3 52-2 1,492-4 152-3 1541 145-7 128-5 109-4 86-8 74-2 72-7 76-2 8 0 0 79-2 761 6 6 0 i 56-5 5 2 1 68-8 1,478-9 PROJECTION NO. MALES 1976 181-0 158-7 159-3 138-7 114-3 108-4 90-6 76-7 74 0 74-5 75-9 74-3 70-3 58-8 42-9 53-7 1,552-1 1981 201-2 180-2 157-8 150-9 125-6 1100 109 0 9 1 0 7 6 0 72-6 71-4 70-9 66-8 60-3 46-9 53-5 1,644-2 I FEMALES 172-4 151*7 153-2 134-4 112-2 1051 86-5 74 0 71-2 7 4 0 1 76-5 , 74-7 70-5 59-9 49-6 73-6 ; 1,539-5 191-6 171-9 1511 145-9 : 1241 109-5 104-8 86-2 ' 72-8 69-5 71-2 72-8 69-7 6 4 0 51 9 74-3 1,631-2 | 1A 1986 : 223-1 200-4 179-5 152-7 142-2 122-5 1101 1090 9 0 0 74-6 69-8 67 0 63-9 57-1 47-5 55-9 1,765-1 212-4 191 0 171-3 146-7 1391 1221 1091 104-3 I 851 71-3 67-2 ! 681 68 0 63-3 54-9 75-7 1,749-8 TOTAL PERSONS—SUMMARY 923-5 1,113-5 607-2 327-1 2,971*2 976-3 1,1861 590-6 338-6 3,091-6 1,053-7 1,305 9 564-9 350-9 i 3,275-3 1,177-7 i 1,432-9 ! 549-9 354-4 , 3,514-9 ( j 1991 I 144-7 222-2 199-6 1741 144-4 138-9 122-5 110 0 107-8 88-3 71-8 65-5 60-4 54-5 44-9 57-6 1,907-0 232-9 211 7 190-4 166-7 140-2 1371 121-7 108-6 102-9 83-4 6 9 0 64-3 63-7 61 -8 54-2 78-6 1,887-4 1,301 6 1,574-8 566-4 351-5 3,794-4 Thousands) 1996 265-3 ' 243-7 221-4 1941 165-5 141-3 138-9 122-3 108-8 105-7 851 67-3 591 51 6 I 42-8 1 56-5 |
2,069-3
BIRTHS, DEATHS, NET EMIGRATION, "STAY AT HOME" MARRIAGES IN EACH 5 YEAR PERIOD
Births Deaths Net Emigration Marriages 1966-71 312-8 164-6 60-9 84-2 1971-76 3560 170-6 65 0 93-7 1976-81 398-5 174-8 40 0 105-2 1981-86 443-6 1790 25 0 118-4 1986-91 486-8 182-3 2 5 0 130-2 1991-96 528-3 184-9 25 0 143-4 Net emigration per annum 1971-76 1976-81 1981 and after 13,000 8,000 5,000
Fertility: Duration 0-4 years
—/ % per annum
PROJECTION NO. IB
MALES
Duration 5
years-\-—2% per annum
(Thousands)
Age Group
0- 4 years 5- 9 „ 10-14 , 15-19 , 20-24 , 25-29 , 30-34 , 35-39 , 40-44 , 45-49 , 50-54 , 55-59 , 60-64 , 65-69 , 70-74 , 754- , Total Males 1971 159-4 160-6 151-3 134-6 115-2 89-5 75-8 74-5 75-9 79-4 80 0 78-4 681 531 44-3 52-2 1,492-4 1976 172-2 158-7 159-3 138-7 114-3 108-4 90-6 76-7 7 4 0 74-5 75-9 74-3 70-3 58-8 42-9 53-7 1,543-3 1981 1820 171-4 157-8 150 9 125-6 110 0 109 0 91 0 7 6 0 72-6 71-4 70-9 66-8 6 0 3 46-9 53-5 1,616-2 1986 191-8 181-2 170-7 152-7 142-2 122-5 1101 1090 9 0 0 74-6 69-8 67 0 63-9 57-1 47-5 55-9 1,705-9 1991 199-6 1910 180-5 165-5 144-2 138-8 122-5 110 0 107-8 88-3 71 8 65-5 60-4 54-5 44-9 57-6 1,803-0 1996 203-9 198-9 190 3 175-2 156-8 141 0 138-8 122-4 108-8 105-8 851 67-3 591 51 6 42-8 56-5 1,904-1 FEMALES
0- 4 years 5- 9 „ 10-14 „ 15-19 „ 20-24 „ 25-29 „ 30-34 „ 35-39 ,, 40-44 „ 45-49 „ 50-54 ,, 55-59 ,, 60-64 ,, 65-69 ,, 70-74 „ 75-f „ 152-3 154 1 145-7 128-5 109-4 86-8 74-2 72-7 76-2 8 0 0
79-2 76 1 66 0 56-5 52 1 68-8 1641 151-7 153 2 134-4 112 2 105 1 86-5 740 71-2 740 76-5 74-7 70-5 59-9 49 6 73-6 173-3 163-5 151-1 145-9 1241 109-5 104-8 86-2 72-8 69-5 71-2 72-8 69-7 6 4 0 51 9 74-3 182-6 172-7 163 0 146-7 1391 1221 1091 104-3 851 71-3 67-2 68 1 68 0 63-3 54-9 75-7 1901 1820 172-2 158 5 1401 1370 121 7 108-6 102 9 83-4 6 9 0
64-3 63-7 61 8 54-2 78-6 194-2 189-5 181-5 167-7 151-8 1381 136-5 121 I 107-2 1009 80-8 660 60-2 57-9 52-9 79-7
0-14 years 15-44 „ 45-64 ,, 65 +
51
TOTAL PERSONS—SUMMARY
923-5 1,113-5 607-2
327-1
959-1 ,1861 590-6 338-6
999-1 1305-8 564-9 350-9
1,062 I
1,432-8 549-9 354-4
1,115 5 1,557-7
566-4 351-7
1,158-2 1,665-6 625-1
341-3
Total Persons 2,971-2 3,074-4 | 3,220-6 3,399-3 I 3,591-2 3,790-2
BIRTHS, DEATHS, NET EMIGRATION, "STAY AT HOME" MARRIAGES IN EACH 5 YEAR PERIOD
Births Deaths Net emigration Marriages
1966-71
312-8
164-6
60-9 84-2
1971-76
338-4 170 2
650 93-7
1976-81 | 1981-86 1986-91 1991-96
360 1
173-9 400 105 2
380-9
177-2
2 5 0 118-4
3969 180 0 2 5 0 129 6
405-5 181-5 2 5 0
139 2
Net 1971-76 emigration 1976-81 per annum 1981 and
after
12,000 10,000 5,000
Fertility: Duration 0-4 years constant
PROJECTION NO. 2A
MALES
Duration 5 years
— / " o per annum
(Thousands)
Age Group 1971 1976 1981 1986 1991
0- 4 years 5- 9 „ 10-14 „ 15-19 ,, 20-24 ,, 25-29 „ 30-34 „ 35-39 ,, 40-44 „ 45-49 ,, 50-54 „ 55-59 „ 60-64 „ 65-69 „ 70-74 „ 7 5
-159-4 160-6 151 3 1346 1152 89-5 75-8 74-5 75-9 79-4 800 78-4 68 1 531 44-3 52 1
1810 158-7 159-4 1397 1159 108-9 904 76-6 740 74-5 760 74-4 704 58-8 42-8 53-7
201 9 180 2 157-7 149 1 123-4 110 5 1098 91 I 760 72-6 71 3 70-8 669 605 471 53-4
222-6 2010 179 2 1496 135 6 118 9 t i l l 110 2
903 74-5 69-7 66 6 63-7 57-3 48 0 56 0
241 2 221-7 200 0 170 7 136 8 130 8 1194 1115
109 2
88-6 71 6 65 1
60.0
54-5 45-5 58 0
1996
258-7 240 2
2206
191 4 1576 132 5 131 2
119 6 110 4 107-1
85 2 670 58 h 51 4
43 1
57-1
FEMALES
0- 4 years 5- 9 , 10-14 , 15-19 , 20-24 , 25-29 , 30-34 , 35-39 , 40-44 , 45-49 , 50-54 , 55-59 , 60-64 , 65-69 , 70-74 , 75+ ,
Total Females
152-3 1541 : 145-7 128-5 109-4 86-8 74-2 72-7 76-2 8 0 0 79-2 7 6 1 66 0 56-5 5 2 1 68-8
1,478-9
172-4 ! 151-7 153-2 135-2 113-4 105-4 86-5 73-9 71-2 74-1 76-6 74-9 70-6 6 0 0 49-5 73-7
1,542-2
192-3 171 9 1510 144-3 122-4 1101 1051 86-3 72-6 69-4 7 1 1 72-7 69-6 6 4 1 52-2 74-1
1,629-2
2120 I 191-6 171-2 1440 133-6 119-5 109-8 104-7 84-9 71 0 66-9 67-7 6 7.7 63-3 55-4 76 0
1,739-2
229-7 211-3 190-9 163-8 133-9 130-6 1191 109-3 103-1 83 0 68-4 63-7 6 3 1 61-5 54-6 79-2
1,865-3
246-4 228-9 210-5 183-5 153-4 131-2 130-2 118-6 107-7 100-8 80-2 65-3 59-5 57-3 53 0 80-4
2,006-9
0-14 years 15-44 ,, 45-64 ,, 6 5+ „
Total Persons
TOTAL PERSONS—SUMMARY 923-5
1,113-5 607-2 327-1
2,971-2
976-5 1,191-2 591-2 338-2
3,097-1
1,054-8 1,300-7 564-3 351-5
3,271-3
1,177-7 1,412-2 547-8 3560
3,493-6
1,294-7 1,538-2 563-5 353-4
3,749-9
1,405-4 1,667-4 623-7 342-3
4,038-8
BIRTHS, DEATHS, NET EMIGRATION, "STAY AT HOME" MARRIAGES IN EACH 5 YEAR PERIOD
1966-71 1971-76 1976-81 1981-86 1986-91 1991-96
Births Deaths Net Emigration Marriages
312-8 164-6 60-9 84-2
356-5 170-6 6 0 0 94 0
3991 174-9 50 0 1051
441-5 179-2 4 0 0 1161
478-7
182-4 400 125 6
53
PROJECTION NO. 2B
Net 1971-76 12,000 Fertility: Duration 0-4 years emigration 19/o-si JU.UOO
per annum 1981 and 8,000 after
Age Group
0- 4 years 5- 9 ,, 10-14 „ 15-19 „ 20-24 „ 25-29 „ 30-34 35-39 40-44 45-49 50-54 55-59 60-64 , 65-69 , 70-74 , 75+ , y > Total Males
0- 4 years 5 - 9 „ 10-14 ,, 15-19 „ 20-24 „ 25-29 „ 30-34 „ 35-39 „ 40-44 „ 45-49 „ 50-54 „ 55-59 „ 60-64 „ 65-69 „ 70-74 „ 75+ „ Total Females 1971 159 4 160-6 151-3 134-6 115 2 89-5 75-8 ! 74-5 75-9 79-4 8 0 0 78-4 6 8 1 53 1 44-3 52-1 1,492-4 152-3 1541 145-7 128-5 109-4 86-8 74-2 72-7 ' 76-2 i 8 0 0 ! 79-2 7 6 1 6 6 0 56-5 5 2 1 68-8
1,478-9
—/ % per annum
MALES 1976 172-2 158-7 159-4 139-7 115-9 108-9 90-4 76-6 7 4 0 74-5 7 6 0 74-4 70-4 58-8 42-8 53-7 1,546-0 1981 182-6 171-4 157-7 1491 123-4 110 5 109-8 9 1 1 76 0 72-6 71-3 70-8 66-9 60-5 47-1 53-4 1,614-1 1 FEMALES 1640 151-7 153-2 135-2 113 4 105-4 86-5 73-9 71-2 i 74-1 76-6 74-9 70-6 6 0 0 49-5 73-7
1,533-8 !
173-9 1 163-5 i 150 8 144-3 1 122-4 1101 1051 86-3 i 72-6 I 69-4 ! 711 i 72-7 69-6 641 52-2 7 4 0
1,602-5 1986 191-4 181-8 170-5 149-6 135-5 118-8 1111 110-2 90-3 74-5 69-7 66-6 63-7 57-3 48 0 560 i 1,695-3 ! i 182-3 ! 173-4 162-8 1440 133-6 119-5 j 109-8 104-7 84-9 71 0 66-9 67-7 67-7 , 63-3 {
55-4 i 7 6 0
1,682-9
Duration 5 years +
—2 % per annum
(Thousands) i 1991 196-9 190-6 180-9 162-2 136-5 130-7 119-4 111-5 1092 88-6 71-6 65 1 6 0 0 54-6 45-5 580 ! 1,781-3 \ i 187-5 181 7 172-7 155-7 133-8 130-5 119-1 109-3 103-1 83 0 68-4 63-7 631 61 5 54-6 79-2 1,767-0 1996 198-9 1961 189-7 172-6 148-9 S 1320 131-2 ' 1197 110 4 1071 I 85-2 66-9 58-6 51 4 43-2 57-1 1,869-1 1895 186 9 181 0 165-5 145-3 130 9 130 1 118-6 107-7 1008 80 1 65-2 59-4 57-3 53 0 80-5 1,851-9 0-14 years 15-44 „ 45-64 ,, 65+ „ TOTAL PERSONS—SUMMARY 923-5 1,113-5 607-2 327-1 959-2 1 1,191-2 i 591-2 338-2 i 1,000 1 1,300 7 564-3 351-5 1,062-3 1,412-1 547-7 356 0 1,110-1,521 563- 353-3 0 5 5 1,142 1 1,613-0 623-4 342-5
BIRTHS, DEATHS, NET EMIGRATION, "STAY AT HOME", MARRIAGES IN EACH 5 YEAR PERIOD
1966-71
Births 312-8 Deaths 164-6 Net Emigration 60-9 Marriages i 84-2
1971-76 338-8 170-2 60 0 94 0 1976-81 360-6 173-8 5 0 0 1051
1981-86
379-2 177-6 4 0 0 1161
PROJECTION NO. 3A
Net 1971-76 14,000 emigration 1976-81 14,000 per 1981 and 14,000 annum after
Age Group
0- 4 years 5- 9 „ 10-14 15-19 20-24 25-29 30-34 35-39 40-44 45-49 50-54 55-59 60-64 , 65-69 70-74 75 + 1971 159-4 160-6 151-3 134-6 115 2 ! i 89-5 75-8
I J 74-5
75-9 79-4 8 0 0 78-4 6 8 1 5 3 1 ! 44-3 •
Total Males
52-2
1,492-5
0- 4 years 152-3 5- 9 ,, 1541 10-14 ,, j 145-7 15-19 ,, 128-5 20-24 „ 109 4
25-29 „ ! 86-8
30-34 „ j 74-2 35-39 „ 72-7 40-44 ,, 76-2 45-49 ,, 8 0 0 50-54 ,, ; 79-2 55-59 „ 761 60-64 „ 66 0 65-69 ,, : 56-5 70-74 ,, 52-1 i 75+ ,, ' 68-8
! Total Females 1,478-9
Fertility. Duration constant MALES 1976 1810 158-7 159-2 137-8 112-8 108 0 90-7 76-8 7 4 0 74-5 75-8 74-2 70-3 58-9 43 0 53-7 1,549-4 1981 200-3 1801 157-3 144-8 115-3 105-7 109-5 9 2 0 76-4 72-7 7 1 1 70-3 66-5 60-7 47-8 53-7 1,624- 3 FEMALES 172-4 151-7 1531 133-5 111-0 104-8 86-6 74 0 71 1 73-9 76-3 74-6 70-4 59-9 49-8 73-7 1,536-8 190 9 171-8 150-7 140-6 115-7 106-5 104-6 86-4 72-4 69 0 70-6 7 2 0 69 1 63-9 52-8 74-5 1,611-5 0-4 years 1986 217-5 199-4 178-7 143-3 121-7 1081 107-2 110 9 91-4 74-9 69-4 65-9 63 0 57-5 49 1 56-8 1,714-9 207-2 190-2 170-8 138-6 122-2 111-1 106-3 104-3 84-6 70-3 65-9 66-6 66-7 62-8 56-2 76-7 1,700-4 1986-91 390-2 1801 4 0 0 1251
1991-96
394-4 181-7 4 0 0 133-7
Duration 5 years+
—/ % per annum
(Thousands) 1991 230-6 216-5 197-9 163-7 121-5 114-5 109-5 108-5 110-2 89-7 71-6 64-4 59-2 54-4 46-4 59-3 1,817-6 219-6 206-4 1891 157-8 121-3 117-5 110 8 106 0 102-2 82-2 67-2 62-3 61-7 60-6 5 5 1 80-3 1,800-1 1996 243-1 229-5 214-9 1831 141-5 1150 115-7 110-6 107-7 1081 85-9 66-6 57-9 51 0 43-7 58-4 1,932-6 231-6 218-9 205-3 1761 ! 1400 117-1 117-3 110-5 103-9 99-4 78-8 63-6 57-8 5 6 0 52-9 81 4
55 0-14 years 15-44 „ 45-64 „ 65+ „ Total Persons TOTAL PERSONS—SUMMARY 923-5 1,113-5 607-2 327-1 2,971-2 976-2 1,181-0 5900 3390 3,086-2 1,051-3 1,269-8 561-2 353-4 3,235-8 1,163-8 1,349-7 542-8 3590 3,415-2 i 1,260 1 1,443-4 558-3 3560 3,617-7 1,343-3 1,538-5 6181 343-4 3,843-2
BIRTHS, DEATHS, NET EMIGRATION, "STAY AT HOME" MARRIAGES IN EACH 5 YEAR PERIOD
Births Deaths Net Emigration Marriages 1966-71 312-8 164-6 60-9 84-2 1971-76 355-6 170-6 7 0 0 93-3
1976-81
394-5 174-9 7 0 0 1021
1981-86
428-8 179-4 7 0 0 109-4
1986-91
455 1 182-6 7 0 0 115-8
1991-96
480-4 184-9 7 0 0 126 5
PROJECTION NO. 3B
Net 1971-76 14X>00 emigration J976-8i' 14,000 per 1981 and 14,000
annum after
Age group
0- 4 years 5- 9 , 10-14 ,. 15-19 , 20-24 , 25-29 , 30-34 , 35-39 , 40-44 , 45-49 , 50-54 , 55-59 , 60-64 , 65-69 , 70-74 , 75 + Total Males i 1971 159-4 160-6 151-3 134-6 1152 89-5 75-8 74-5 75-9 79-4 8 0 0 78-4 681 5 3 1 44-3 5 2 1
1,492-4
Fertility: Duration 0—4 years
—/ % per annum
MALES 1976 172-2 158-7 159-2 137-8 112-8 108 0 90-7 76-8 7 4 0 74-5 75-8 74-2 70-3 58-9 43 0 53-7
1,540 6 1 1981 ; 181-3 171 4 157-3 144-8 115 3 105-7 109-5 9 2 0 76-4 72-7 711 70-3 66-5 60-7 47-8 53-7 596-5 1986 187-2 180-5 1700 143 2 121 7 1081 1072 110 9 91 4 74-9 69-4 65-9 63 0 57-5 49 1 56-7 1,656-8
Duration 5 vears I
—2% per annum
FEMALES
0- 4 years 5- 9 , 10-14 , 15-19 , 20-24 , 25-29 , 30-34 , 35-39 , 40-44 , 45-49 , 50-54 , 55-59 , 60-64 , 65-69 , 70-74 , 75+ ,
Total Females
152-3 1541 145-7 128-5 109-4 86-8 74-2 72-7 76-2 8 0 0 79-2 7 6 1 6 6 0 56-5 52 1 68-8
1,478-9
1641 151-7 1531 133-5 1110 104-8 86-6 7 4 0 7 1 1 73-9 76-3 74-6 70-4 59-9 49-8 73-8
1,528-4
172-8 163-5 150-7 140-6 115-7 106-5 104-6 86-4 72-4 69 0 70-6 7 2 0 6 9 1 63-9 52-8 74-4
1,585-0
178-3 172-2 162-5 138-6 122-2 1111 106-3 104-3 84-6 70-3 65-9 66-6 66-7 62-8 56-2 76-8
1,645-1
179-5 177-7 1711 149-8 1210 117-5 110-8 1060 102-2 82-2 67-2 62-2 61-6 60-6 5 5 1 80-3
17,04-9
178-2 178-9 176-7 158-6 1320 116-6 117-2 110-5 103-9 99-3 78-7 63.5 57-7 5 6 0 53 0 8 1 4
1,762-2
0-14 years 15-44 „ 45-64 ,, 65+ „
Total Persons
TOTAL PERSONS—SUMMARY
923-5 1,113-5 607-2 327-1
2,971-2
959 0 1,181-0 5900 3390
3,069-0
997 0 1,269-8 561-2 353-4
3,181-5
1,050-6 1,349-6 542-8 3590
3,3020
1,082-2 1,426-2 558-1 3561
3,422-6
1,093-3 1,484-5 617-6 343-8
3,539-1
BIRTHS, DEATHS, NET EMIGRATION, "STAY AT HOME" MARRIAGES IN EACH 5 YEAR PERIOD
1966-71 1971-76
Births 312-8 3380 Deaths 164-6 170-2 Net Emigration | 60-9 7 0 0 Marriages ' 84-2 j 93-3
i i
1976-81
356-5 1740 7 0 0 102 1
1981-86
368-3 177-8 7 0 0 109-4
1986-91
3710 180-4 7 0 0 115-2
1991-96
57
PROPORTIONS ]
APPENDIX B
IN BROAD AGE GROUPS IN IRELAND 1971
AND IN CERTAIN
Country
Ireland: Projection 2A
Projection 2B
Albania (1) Austria
Belcium
Czechoslovakia (2) Denmark
England and Wales German (BRD) ... Greece
Hungary ... Netherlands Norway Poland Portugal Spain Sweden
1971 1976 1981 1986 1991 1996 1971 1976 1981 1986 1991 1996
OTHER COUNTRIES IN
0-14
311 31-5 1 32-3 33-7 34-5 34-8 311 311 311 31-4 31 3 30-7 38-6 241 23-8 24-3 23-8 23-3 22-5 i 25-2 21 9 27-5 : : 24-6
29-3 1 28-8 281 ! 21 0
15-44
i
37-5 38-5 39-8 40-4 41 0 41 3 37-5 38-7 40-4 41-8 42-9 43-3 41 6 3 9 0 4 0 4 43-2 41 1 3 9 3 4 0 9 4 4 9 43-7 42-3 38 5 43-5 41 -3 42 0 4 0 2
1968*
45-64
20-4 191 17-3
15 7
150 15 4 20-4 19 2
17-5
16 2
15 9
16 8 13 3 231 22-7 22 0 23-2 24-6 23-2 2 0 4 23 1 20 1 24-2 '
192 21 1 20 5 25-6
TO 1996
65 +
| 110
1 1 0
10-7
102 9 4 8-5 110
11 0
109 105 100 9 2 6-3
13 8 13 1
104 117 126
13 2
9 6 111 9 9
12-7
7-9 8-7 9 2
13 2
(1) 1950. (2) 1967.
Dr. Brendan Walsh: We have heard a sophisticated and meticulous paper whose importance and relevance to several aspects of Irish research needs no underlining. Rather than waste the limited time at my disposal in expressing admiration for the quality of the work of Knaggs and Keane, which must be taken as selfevident, I should like to raise a few of the multitude of points suggested by the paper.
First, with regard to methodology. Since the subject matter of popula-tion projecpopula-tions is of interest to a very wide range of people it is to be recommended that the bare bones of the methodology be presented in very simple terms, for application on a trial basis by all those interested in special regions or topics. In this connection, it would be valuable to know whether much, if any, precision is lost by use of quinquennial age groups as opposed to (in some cases smoothened) rates by single years of age. It would be feasible to ignore deaths at all ages up to, say, age 40, (except, of course, among infants). In the calculations of total net emigration, the model would be simplified by assuming that all emigration occurs at the very end of the time period (thereby allowing one to ignore the problem of deaths among migrants, in any event a minor problem at the relevant age groups). Of course, this does not imply that the full model should not retain the existing degree of refinement. It would also be interesting to see whether an approach working from the county level, and county projections made by people with detailed local knowledge, would be a useful alternative basis for building up a national projection.
In connection with the estimation of emigration, I greatly prefer the approach that takes the labour force as given and obtains emigration as a residual from the population. However, the treatment of female participa-tion rates greatly complicates matters: although the arithmetic dictates it, one is unhappy to see a positive association between (female) participation rates and emigration. In practice I think that female participation will rise during periods of low unemployment and emigration. Perhaps a way round this dilemma would be to predetermine the level of the male and female labour force, the male participation rate, and the sex ratio of the * emigrant stream: hence, the program would calculate the male emigration numbers, and from them, the female emigration numbers; the female participation rate would then follow automatically from the relation between the female stay at home population and labour force. This places a heavy burden of adjustment on the female participation rate, but then this variable has been found to be flexible in other countries in the post-war period.
Turning to the results: the 1966 Life Table data are of great interest. It is gratifying to see the continued improvement in female life expectancy, although whereas the Irish male now has almost an identical expectancy at birth to the British male, the Irish female still falls over two years behind the British female.
59
results shown in Table 13. It is alarming to see that under all versions using fertility assumption A, our total dependency ratio continues to rise, and even with the rapid decline in fertility posited in B, our level of young dependency at the end of the century remains higher than that found in any other European country (except Albania) today. The widespread but mistaken impression that most of the abnormality in our age structure is due to the impact of emigration is clearly dispelled by these results, and they deserve the widest possible readership.
Finally, as regards the range of values used in preparing the actual projections presented tonight: I have a hunch, and it is no more, that both nuptiality and fertility may change more radically than is allowed for in any of the six assumptions. In particular, our marriage patterns may come into line with those of England or France over the next 15 or 20 years. At the same time, our average family size may fall to close to the European norm of between 2 and 3 children well before the end of the century. Of course, the value of tonight's paper is that this, or any other, assumption can now be used to prepare detailed projections and hence the implications of such assumptions, especially for the population age structure, may be made very explicit.
The authors deserve our congratulations and gratitude for their excep-tional piece of research.
Mr. Kirwan: I have been privileged to be associated with the previous speakers and the authors of this paper in work on this subject of popula-tion. Not surprisingly, therefore, Mr. Hyland has voiced many of the comments which I had intended to make as indeed has the proposer of the vote of thanks. The general trend of my remarks will consequently be in elaboration of what they had to say on the integration of population and employment forecasting. I should like to say, however, that when in constant working contact with people as I am with the authors of the paper, that one tends to take their efforts very much for granted. It gives me pleasure, therefore, to take this opportunity of complimenting Messrs Knaggs and Keane on their very valuable work.
mentioned by Mr. Hyland, of supplementing the main programme described in tonight's paper, by manual calculations relating to the projected supply and demand for labour. It should be mentioned that with this procedure also, the burden of adjustment to a balanced situation would fall on the participation rates for women and especially married women. Some experiments which I have made indicate that the degree of adjust-ment required might be quite substantial.
Those are the principal points I wished to make. However, I should like to put an additional one to the authors in the form of a question about the discussion in the paper of the future course of marriage rates. I noted that the linear extrapolation of the change in marriage rates between 1961 and 1966 underestimated the estimated number of marriages between 1966 and 1971. I wonder is this due to the relevant curve being non-linear or is it a purely random feature? Have we the data required to make annual estimates of the rates on the definition used in the paper, since such data could possibly facilitate time-series analysis? I should like to conclude, Madame Chairman, by again complimenting the authors of the paper.
Dr. Geary: As a pioneer in this field—Society papers of 1935 and 1941— tonight's paper is of great interest to me. Like tonight's authors I produced several extrapolations with different assumptions about future death, fertility, marriage and emigration rates. Our authors' horizon is a prudent 25 years; mine a heroic 100. There is no point in comparing our numerical results: as based on a much more recent census and with a shorter time horizon their extrapolations to say 1996 are far more dependable than mine.
In my 1941 paper I had an appendix giving a formula for extrapolation given any set of values for the variables. Could I ask the lecturer if his computer programme could readily produce extrapolations classified by age and sex, given the values of the variables (death-rates etc.), these possibly varying during the future period?
I recall that in my papers I tried to establish relations between the variables (I was more interested in these than in forecasting) with a view to reducing them in numbers, i.e. reducing sources of error. In particular I found an inverse relationship between marriage rate and fertility rate, using countries and Irish counties separately as units, suggesting that the crude birthrate is more stable than either of the other two and therefore more suitable for forecasting. The late Per Jacobeon, in the discussion of one of the papers, called me a "neo-Malthusian". As I recall it, the main impulsion for my extrapolations was to kill the political idea rife at the time that an objective of the nation should be to restore the population to the pre-Famine 8^ million (all-Ireland). I showed that this would be impossible and was duly savaged for lack of patriotism in a monthly of the time, long since vanished.
61
unpredictable of all, the emigration rate. As I found to my cost, quite small changes in the variables resulted in large changes in the extrapolations. I agree with Dr. Walsh that our authors have been rather conservative in the range of values they have given the variables, thereby unintentionally giving too optimistic an impression of reliability. Truth to say, as I found, the sets of extrapolations one produces (i.e. the sets of values one gives the variables) is coloured by one's state of mind. Mine in 1936-1941 was distinctly that there would be no change in population, proved right in the event.
Yet these figures as forecasts are of great importance and we must try to improve them. The only suggestion I can make is to keep them constantly under review. If the variables show a level or trend in any recent interval, publish series of extrapolations based on these values.
Di\ J. Harte: In congratulating the authors on their paper, I should like to make three small points. The first concerns the linear projection of the 1961-6 trend made in Table 5. Mr. Kirwan has suggested that the reason that 1966-71 marriages were under-forecast by this method was that the true relationship was curvilinear. Why alternatively do the authors not use the 1951-66 trend? Second, the assumption that equal numbers of males and of females will emigrate in each quinquennium seems to be doubtful, and hard to justify from the last column of Table 3, where there are wide fluctuations in the past. Lastly, no reference is made in the paper to the effect of Ireland's possible entry into the European Economic Community, particularly on emigration and on the possible disturbance of the homo-genous character of the Irish population that has existed up to the present. Mr. R. Curran: Like a number of other speakers my interest is con-centrated on the effect on the population forecasts of changes in the assumptions made. Dr. Geary has referred back thirty years to his pioneer-ing papers; I would like to look forward thirty years, and to suggest that by then there will be a demand on authors presenting papers to bring the computer along with them, and to allow the audience to test for them-selves the response to changes in the assumptions. In this way the audience could get a feel for the extent to which particular assumptions were critical. More seriously, another way of doing this might perhaps be to calculate numerical values of elasticities. These would be defined in the normal way, that is the proportional change in the dependent variable divided by the proportional change in the independent variable. Thus one could have a set of elasticities of mortality, fertility and emigration on population. The mortality elasticity of population, for example, would be the percentage change in population at a stated date divided by the percentage deviation of future mortality from its predicted level. There would be a set of such numbers, one for each of the years for which a projection is made.
inter-censal period. I would think it likely that the very marked peak of emigration in the 10-20 age group shown for 1961-66 in the diagram attached to the paper was reduced in the period 1966-71 because of the recent marked changes in education. What effect will this change, if it occurred, have on the populations of future years and their age distribu-tions? The authors' assumptions about the level of emigration are phrased in terms of its absolute volume during given intercensal periods. To appreciate the implications of emigration assumptions I think it would be useful to rephrase them in terms of emigration rates. A rising population and a falling volume of emigration can involve a rapidly falling emigration rate; even a stable volume of emigration can do so. Calculation of assump-tions in terms of emigration rates might bring home to us with greater force the extent to which our assumptions involve a radical departure from past experience.
I would like to join with other speakers in congratulating the authors on a paper which will, I am sure, find an unusually wide readership and use. Dr. T. Beere: I would like to add my congratulations to the authors of this excellent paper which has served to stimulate a most interesting discussion of a uniformly high standard.