" AND SOCI.(~L: :
:-I~,E SEAECH INS.~ ITUTE
MEMOtt, ANDUM :SERIES
¯
NO; 1416 : ’ .] ¯¯ :,
. ’- . .- .. k
PROFIT SHARING FOR IRELAND?
\
.f - . .¯-.
t .
December 1981
M. Dempsey andR. C. Geary
- . " .
i f
¯
k-.L
’k
¯ t¯
. . /- ’ k
I
¯ ~¯ k
¯ - ¯ . k " ’
Confiden~ia[T. ,,-~Not "[o be quoted
un~i t e perrni t
t I~
ssion of he Author
~
.
,and the Inst:itute is obtained.- i ....
Acknowledgment
Our best thanks are due to Dr J.I. FitzPatrick, Director,
the Planned Sharing Research Association, for consultation,
correspondence and documentation. We are also grateful to
the internal Readers J. Durkan mid J.J. Sexton, as a result
of whose comments the first draft has been considerably revised.
1:
2.
3.
4.
Contents
A Brief Survey of Profit Sharing Abroad
some statistical A spects of Profit in Ireland
Irish Experience with Profit Sharing
Conclu sion J
I. A Brief Survey of Profit Sharing,
Profit sharing may be defined as an ag~.:eement between an
employer and workers to pay a share of the profits or wealth created by the
organisation in addition to wages and direct incentives. It is a recognition
of the worker’s right to a share in the results of the organisation, just as the
right of those wllo provide the capital. Profit sharing is regarded frequently
as a direct incentive to employees whose extra efforts can increase the
profitability of an enterprise; it should not be confused with productivity
scheme s, ’however.
There are many ways in which profit sharing may be operated:
(i) it may be a cash distribution; (ii) it may take the form of share allocation
or of share option; (iii) it may apply to all workers or to certain categories;
(iv) the amount may be at the discretion of owners or determined by rule;
(v) profits shared may be a fixed percentage before tax, net profit ~ter tax,
a proportion of profit over a-specified minimum. The profitability of a firm
depends on many factors, sufficient capital, capable management and the efforts
o~ all the workers, therefore it would appear equitable that all interests should
share in the surplus remaining after each section has been reasonably remtmerated.
I
Some of the arguments against profit slmring are:- (i) if
v,
employees are encouraged to participate in a scheme of investment in a firm’s
shares, they may expect to be compensated even if the firm runs into difficulties;
(i1) many employees might prefer a cash bonus to investment in shares; (1~1) the
formula for calculation of shares is often too complex to be tmderstood by all
workers;(1v) employees may consider that profit sharing gives an illusion of
ownership without the power of control; (v) workers may begin to regard bonuses
or dividends as a right and resent their absence in unprofitable years; (vi)
i\ ,
1.2
l
or distribution of ownership advantage; (vii) it cannot be applied to public service
and other nonprofit organisations unless special arrmlgements are made. The
advantages of profit sharing are said to be: (i) employees acquire an interest
in the organisation as owners as well as workers; (H) profit sharing provides an
interest in the firm; (iii) good employees may be induced to join and to remain
with the firm; (iv) employees are encouraged to save; (v) by building up a common
purposes profit sharing may help to reduce conflict and therefore further public
interest which is often forgotten when colffrontations occur between management and
workers; (vi social justice is seen to exist when workers share in the profit of the
enterprise; (vi) profit sharing would involve a wider distribution of ownership in
the community.
Most writers on the subject of profit sharing stress some basic
principles: (i) basic pay to employees must take precedence over all other
interests, (11) there must be a reasonable proportion of profit for distribution to
staff; if the profit bonus is only a small fraction in relation to total dividends,
its psychological effect may be disastrous’ (1ii) the scheme should be simple
and clearly understood; (iv) there is emphasis that schemes can operate only in
successful firms and emmet be used to salvage a lost situat[on; (v) the scheme
must state who are eligible, e.g. full time employees, certain period of prior
service for eligibility, exclusion of certain staff, applicable to all staff; (vi)
many think that employees cannot be involved in sharing losses but benefits
must vary according to the profitability or otherwise of the firm; (vii) it is
important that a reasonable proportion of employees will voluntarily retain their
shareholdh/g. In voluntary shareholding staff should be able to opt for a cash
bonus instead o} shares as it is pointless to give shares which will be realised
immediately. In many organisations employees are assisted in acquiring shares
in the concern, by means of loans, payable over five years. During the repayment
period, sh.’u-es emmet usually be sold except ia exceptional circumstances; (viii)
there shottld be income tax concessions to encourage promotion of profit sharing
1.3
firms have introduced profit sharing successfully; what appears to be important
is a steady dividend; (x) schemes may fail to stimulate workers to greater -.
effort as they have to wait too long for results; (xi) schemes are said to increase
loyalty to the organisation and lessen strikes.
There appears to be general agreement that unless the wage structure
is adequate, profit sharing is not possible. There must be good working
conditions, satisfactory pensions and sick pay schemes, particularly in the UK
and Ireland before profit sharing can be considered; although in the USA it
appears that schemes are introduced to provide pensions and other benefits,
workers in European countries do not appear to respond in such motivation.
European profit sharing companies tend to be those which have adequate fringe
benefits.
It would appear that for profit sharing to be successful there must
be a high standard of communication and consultation flowing each way between
management and workers. It would be unwise to expect too much from profit
sharing schemes alone. They will necessarily remove nor reduce conflict
over pay or conditions of work; usually workers prefer increases in basic
rates of pay rather than in what they regard as marginal or fringe benefits.
There is also the argmment that whereas basic pay remains, rewards based
on profits may fluctuate or be discretionary.
The Commission of The European Communities considered employee
participation in asset formation in a Memorandum issued in 1979. They were
"of the opinion that employee participation in productive capital formation constitutes
an efficient approach towards the fundamental goal from a soe ial standpoint
-\
of greater justice in the distribution of total wealth. This asset formation policy
is furthermore a modern metals of regulating the economy and of controlling
t!
kg’
1.4
The most important basic principles, which should tend to reinforce
the social aspect of incentives to individual savings are in the view of the
Commission:-. A jointly negotiated asset benefit at a standard rate in absolute
value, as in the Federal l~epubl[c of Germany.
¯ Compulsory "frozen" participation of the wage earners in the
profits of ~mdertakings financed in part by the State, as in
France. Several forms of voluntary participation are operational
in Netherlands, the Federal l~epubl[c of Germany and in the United
Kingdom. Also ill France there is compulsory participation in
shareholding by employees in certain public enterprises. Similar
systems are to be fotmd, although optional, in Denmark, the United
Kingdom and in the Federal Republic of Germany.
The Commission favours the sharing of profits by employees,
whether by free negotiation between the two sides of industry or within a legal
framework. Among the many objectives of such sharing schemes it was argued
that priority should be given to the social objectives, particularly to a fairer
distribution of wealth. Further objectives were:
¯ to ’ensure an overall level of saving necessary for the financing
of investments;
¯ to obtain greater participation in saving; ,
¯ to chmmel such saving towards medium and long term forms of
inve s tm ent;
¯ to maintain relatively stable prices by balancing incomes with
consumption, savh]gs and investment.
In order to encourage savings, countries must hnplement a policy to control
inflation as in times of accelerated inflation savers cml see their efforts largely
wiped out by currency depreciation; while the real value of interest paid to
o
1.5
that, at least the low income groups, should have some kind of guar~-mtee that
medium and long term savings will keep their real value.
There is no EEC law on PS. The Commission recommends two
methods of PS. According tothe first employees in the private sector and the
government would pay their employees standard contributions in addition to
earnings which would be frozen for a certain period. The idea Would be for the
two sides in industry to negociate agreements on asset formation within a legal
framework. According to the second method, described as "more advanced",
employees would be given a frozen share in company profits, growth or capital
Ftmds trmlsferred to employees, preferably in the form of share certificates
could be limited to the employees of the particular company or could be extended
to a wider range of employees by assignment to a more or less general fund. It
is pointed out that limitation to own company is more’likely to bring about
improvement in the work atmosphere while funding is the more likely to bring
about nearer to equality in reward for employees of more profitable and less
profi table c ompanie s.
Following are short notes on the parctiees in some countries. Of
greatest interest for Ireland is the UK. In a booklet produced by CB[ ~978) what
is described’as a "checklist for management" is hnportant because almost
invariably schemes are introduced on the initiative of management, whose reasoning,
it is suggested,, should be on the following
lines:-"Why do we want a scheme ? The timescale is.important here. A scheme with regular short-term pay-outs can be used to reward performance but it is wise to consider
a scheme based on longer-term achievement if the objective is to seek to increase employee involvement and commitment to the company.
1.6
"What ratio is the scheme to be based on: net profits,
pre-tax profits, added value ? Should there be a ’triggering-off’ device whereby a Certain profitpercentage has to be
reached before there can be a distribution ?
"How will the compm~y cope with employees’ disappointment and disillusion when the company has a bad year and there are no profits to share ? Should all the profit surplus be distributed, or some held back in reserve for bad years?
"Should the company bind itself in advance to the payment of an agreed proportion of profits every year ?
"On what basis should the distribution be made ? Should it be related to remuneration, length of service or a combination
of both ?
"What should an employees entitlement be when he leaves the compan.y, retires or is dismissed? Will his estate be entitled
to anything if he should die ?
"Who should manage the funds set aside for sharing - board of
trustees~management~trade unions? Is there scope for a joint
management/union initiative ?
"How can we best inform our employees of our proposals told seek their views at the earliest opportunity ?
"How can we ensure that when we have decided on a scheme, it is exxglained as clearly and simply as possible and that all those covered by the scheme have an opportunity to discuss it with
senior management ?"
We emphasize that these questions represent only management’s thinking; regard
must be had also to the viewpoints of employees of particular industries and of
trade unions, and to society generally if government is tO be involved.
acquire shares in their company.
approved by the ]hlm]d Revenue.
The 1978 U.K. Finance Act purports to make it easier for emplgyees to
Relief from income tax is provided for schemes
From the viewpoint of the company, amounts expended
on :PS are deductible for calculation of corporation profit tax. Conditions were:
administration by trustees resident in UK, at least five years employee service,
participants to be treated like other shareholders, maximum of untaxed allocation
£500. In the 1980\budget speech the latter was increased to £1,000. To encourage
retention of shares vested, the recipient could not sell these in the first two years
of ownerslfip and income tax was payable on sales less than seven years but at a
1.7
(1980), where much of the information in this paragraph and in what follows was
obtained, it is stated that profit sharing in UK has but a small role in "companies’
employment participation policies". There are few schemes in heavy industry or in
highly unionized companies. It is stated that British trade unions "have shown little
enthusiasm for profit sharing, being more interested in increasing their members’
h~fluenced and pay in other ways."
In August 1980 firms with PS schemes approved by the Ilfland Revenue
numbered i51, with 114 awaiting approval. Only two per cent of British workers
are in PS schemes.
The CBI booldet gives a few examples of PS in the UK. In ICI the
scheme is administered by the company through trustees. Under new proposals
four employee trustees will be elected by the stMf. Shares in the compmly are
issued to PS participants in the July of the year following the particular year of
PS allotment. There is no accumulation of shares in the trust from year to year.
The formula for allocation is based on the ratio.
R = Value added/Employee remuneration, (Note that R is largely
unaffected by inflation). R is converted to a percentage of income (7 per cent in the
following example) by a ready
reckoner:-Salary £4, 000, rate 7 per cent = £280
£280 less tax at say 34 per cent = £185
’ £185/share issue price of say £3.90 = 47 shares.
This manner of calculation has the virtue of simplicity, the desirability
for which is emphasized. While shares cm~ easily be sold, it is Stated that, when
least culculated in 1971, about 40 per cent of employee shares /,ere retained.
The Boots Company scheme is about 20 years old. Its declared aim
is to give .employees a share in the company’s prosperity.
as 8½. per cent of UK trading profit (calculated before PS).
The PS ftmd is calculated
1.8
°.
staff who Imve completcd twelve months’ service or more qualify for a share
in the fund. It is for the company to decide whether an individual qualifies
(absenteeism etc). Staff of 49,500 shared £7.3 mi]iion in 1977. Each employee
entitled to a bonus will be allotted a number of shares in the fund equal to the
amount of his weekly pay, with multipliers for 10, 20, 25 and 30 years’ service,
An example is given illustrating how each share is valued: if the mmual fund was
£1,000,000 and total number of shares 513,000 the value of each share would be
£1.95. Again the simplicity of the scheme will be noted.
The H.P. Buhaer Group’s plan is administered by six trustees,
of whom two are employees. Each employee is allotted shares as a percentage of
earnings. Again allotment depends on the ratio I{, e.g. being 1.15 per cent of
pay when R = I. 50 rising to 2.40 per cent when R = I. 75. Trustees hold shares
for five years after which they are vested in the individual employee if he is still
in the company. There is mention of a criticism: during this delay in vesting
the employee "feels very little sense of being a shareholder".
Row-ntree h<[ackintosh has had a PS scheme since 1923. Latterly,
however, the emphases seems to have been more on SAYE (Save as You Earn).
The scheme is stated to offer a large number of employees the opporttmity to
acquire ordinary shares in the comp.’my. According to Option A of the scheme,
employees can have savings (between £1 and £5 a week) deducted from pay, the
money being held for five years and then used to buy shares in the company, paying
the price of those shares fixed five years earlier. (The latter proviso is interesting
in protecting the employee from the risk of a fall in share price and if share price
has risen in the five years, as will ordinarily be the case with a successful company,
g:canting more shares than [f price at vesting were used. ) An interesting feature
is that at the end of the five years the employee has a half-year to decide whether
to buy shares (minhnum 25) or to withdraw Savings which are index-linked mid
carry a bonus. This description has been given at some length for this company
1.9
In 1974 the Government of the Federal Republic of Germany adopted
a plan that undertakings with an almual profit, before t,q:x, of DM400, 000 (limited
liability companies) and DM 500,000 (private cornpanies) would have to transfer
some equity capital or cash (in some cases) to a clearing institute which distributes
the resources to specially created funds from which all employees and self-employed
persons whose income does not exceed a certain limit will receive participation
certificates which may not be sold for seven years. This draft law has not been
implemented because of some practical difficulties but the principle of employee
participation in company profits has been accepted and denattonalisatton of part
of the Federal industrial property resulted in a distribution of shares to workers,
principally in Volkswagen and :Preussiehe Bergmarks m~d Hutten A6. By legislation
in 1967, income tax is not payable, up to a stated maximum, by workers owning
shares in the eompmly which employs them. There are some provisos including
the holding of the shares for five years before sale.
In West Germm]y voluntary PS schemes are rare (and there is no
legislation making PS compulsory), some major companies use other means
towards the same end. They have arrangements which enable their employees
to acquire shares in the company or other forms of investment, with fiscal incentives.
in 1..976 about 770 firms had arrangements for 800,000 workers to
acquire a stake’in their company, and these firms included the ten largest compmlies
in the country. The usual procedure is for shares to be made available at discount
rates to employees with service qualifications.
very small:
Shareholding of workers is still
Frmlce is exceptional in that, since 1967, PS is required by law in
private sector companies with more than 100 employees and, in spite of a lack
of trade union interest, many smaller companies have volm]tarily introduced a PS
scheme. At the end of 1978, nearly 5,000,000 employees in 11,500 companies
had PS, a quarter of these with less than 100 employees and hence not bound by
i. I0
law. France has a "complex array" of legislation to put a greater proportion of
industrial capital into the hands of French workers but so far with little success
~a(12~9~ the law’). It would seem as almost in de speration tile Minister of Labour
in 1978 proposed an obligatory handout of shares to employees equivalent to three
per cent of ’the capital of publicly-owned companies, envisaging that eventually
"employees would own between 20 and 30 per cent of the capital of the companies in
which they world’. Not surprisingly one learns that the proposal has had modifications
during the past two years. A bill based on it is at present (September 1980) before
file French parliament but advocating only voluntary share distribution. There is
a second bill making changes in the 1967 I~S law. In our source of information it is
stated that the fate of these bills is uncertain.
:PS in France - cash or shares - is designed for the individual
employee and not for a collective fund. lal 1976, the last year for which statistics
are available, average allocation under the law was £110 but there were wide
variations amongst industries, ranging from £320 in the petroleum industry to
¯ about £60 in construction. About a fifth of beneficartes got more than 5 per cent
of ammal pay and a quarter got less than one per cent. :Presumably because of
the statutory formtila (consideration of which follows) nearly two million employees
in companies with :ps schemes got nothing.
The formula used in France to define a firm’s contribu(:ion to the
workers’ Spec[al :Participation Fund (SPF) is as
follows:-S:PF = (lB -. 05C) S/2 VA
where B =.profit less tax, C = capital applied, S = employee compensation, VA =
value added, to which we may add N = number of employees. One can see most
of the rationale of the formula; no payment unless profit after tax exceeds 5 per
cent of capital and, once again, the ratio S/VA bvhich we have noted in UK schemes).
The fraction ½-may imply an equal division of this surplus between o~aers and
employees. An authority states that an object Of the formula is to "cushion the
i.ii
theoretically let us convert the formula into rates by the following substitution:
Profit before tax = kB, k 1
VA = kB + S
S = wN
B=bc
C=aN
The lower case letters are the rates. There is no a priori reason why k, w, b
should necessarily vary with size of firm or capital intensity, measured by a.
substitution in the formula - SPF/N = a (b -. 05) w/2 (%ba + w) = f, say.
On
The coefficient a directly measures capital-intensity, so we may
calculate f, the firm’s contribution per employee for different values of a, giving
the other coefficients reasonable constant values. As examples with w (asnumera, re)f .
= 1, k = 1.5 and b = 0.8 we find f = . 0882 for a = 20 and f = .1188 for a = 100, which
means that at these capital intensities the firm’s payments to the workers’ SPF
would be 8.82 and 11.88 per cent respectively of pay. The formula can be regarded
as "cushioning" for it succeeds in this example in making a contribution ratio of
1.35 (= 11.88/8.82) while the capital ratio was 5. The range in actual payments
per employee between industries quoted above are certainly not in accord with this
statutory formula which could, of course, mem~ that some industries are more
generous than the law requires and/or the fact that firms with less than 100 employees
with l°S are not statutarily bound. This may account for the low average payment
of £60 in the construction industry.
A survey of industries in the Netherlands in 1976 covering 40,000
companies withten or more employees, 2.8 million in all showed that 7,000
companies (one-sixth of all) had loS. Schemes were more common amongst larger
companies; one-fifth of those with 100 or more employees had loS. 4,000 firms
had a scheme covering all employees, most of the remaining schemes extending
only to senior employees. Some 600,000 employees participated in 1976 and 90
1.12
employees payment per employee was about £290 and average payment was £750
in companies with schemes for part of staff. Most important manner of payment
was a fixed percentage of employee’s pay. About half of the PS schemes are
included in conditions of employment but it is stated that Dutch collective agreements
seem to have had only a small part in establishing schemes. Most allocations were
based on companies’ published profit figures, the rest on tamable profits, dividends,
turnover or output. Legislation facilitating company savings schemes has been
in force since the 1960s. In 1978 two bills were introduced in the Dutch parliament
which would require companies to distribute up to 24 per cent of "excess" profits
to employees, i.e. in excess of a certain amotmt each year - £26,000 in 1980 to
be indexed in future. A maxhnum is proposed equivalent to three per cent of the
company’s taxable profit. The principle is the participation of employees in the
capital growth of companies - it is known as VAD. Some of the allocations would
go to individual employees, some to a national fund for all Dutch workers with
trade union representatives with a majority on the board. This is known as the
collective VAD scheme. In principle all payments would be in the form of shares
or other asset certificates. There seems little point in describing the schemes in
detail since they are controversial with many amendments proposed already, so
that the final form is uncertain.
I
The Meidner plan in Sweden (initiated in 1971) rejected individual PS,
because of the objection of tying the wage earner to the firm and promotes
solidarity amongst workpeople and employers instead of amongst workpeople alone.
The plan envisaged companies being required by law to use some 20 per cent of
their pretax profit annually in the form of new shares. These would go to a "central
equalisation fund" to be rim by the trade unions. The object would be for the fund to
acquire shares which would entitle it to appoint delegates as directors of companies.
The Swedish blue-collar union federation LO gave formal support to the plan in 1976.
1.13
was partly the cause of the fall of the Social Democratic (SAP) government in
1976 after 40 years’ rule. In 1978 ajoint LO-SAP working party proposed
changing obligatory PS rules to voluntary and the 1978 SAP congress postponed
party decision on employee funds to 1981. There is also a Meyr commission
appointed by the govermnent in 1975 to examine the whole question of employee
funds and due to report in December 1980.
Danish unions were amongst the first in Europe to claim a greater
share in the ownership of industry through a collective fund. The Danish LO’s
proposals formed the basis for a draft law introduced by the Social Democratic
government in 1973 but the government fell that year. Vv~nile unions persist in
central fund proposals, employers oppose but they favour voluntary financial
participation by employees in their companies. According to Danish trade union
ideas the employee - holding would be frozen for seven years in the fund after
which fl~e employee would receive payment in cash.
There are already voluntary schemes in Denmark.
arrangement is for the employee to acquire shares at a favourable
can also be a transfer of profit;
at the end of 1978.
Usually the
rate; there
99 companies with 85,000 employees were involved
In Ireland, a discussion Paper on Worker Participation (which includes
financial participation) was issued in 1980 with the aim of "focusing debate on the
key issues", tO promote discussion and to encourage initiatives.
The section on financial participation argues that recognition be
given to empl6yees’, in respect of their interests in and contribution to the wealth
ci-eated by theh- labour." Financial participation could also influence the level of
inflation and the supply of investment capital, while in its social dhnension "it is
a logical development of workers demmlds for broader-based participation in the
operations of the enterprise. " When workers are asked to practice wage demands
1.14
wealth thus created when the subsequent recovery in economic performance takes
place".
Financial participation must be developed through good mm~agement
and trade union practice "as part of a total pattern and philosophy of employee
participation",
In the next section we give the results of a sample survey in Ireland.
In the US profit sharing has grown, perhaps more than in European
countries; this may be, in part, due to the fact that schemes are used to provide
superannuation schemes and other fringe benefits. The Employee Retirement Income
Security Act of 1974 is stated to have had a profotmd effect on promoting PS in USA.
Tax~ deductabilty has played a large part. Usually profit sharing schemes are
envisaged as (i) a means of attracting and retaining quality persolmel; (ii) the
creation of incentives; (iii) the deferment of current income taxes and accumulation
of a capital reserve, (iv) maximisation of accumulation of capital through the exemption
trusts; (v) the provision of retirement income and of benefits in respect of sickness,
death, disability; (vi) fulfilling the company’s social responsibility and enhancing
The most usual schemes for profit sharing are, cash only, deferred
shares, a combination of both, and savings and thrift plans. Profit sharing is
regarded as an organisational incentive designed to unite employees with the company
in the common goal of profitability m~d efficiency. Its objective is the promotion.of
unity of prupose and equitable sharing within the enterprise.
Bert L. h<[etzger (1980) states that:
"Profit sharing should not be used as a substitute for
-¯ competitive wages and customary fringe benefits;
1.15
sound personnel practices (e. g. fair wage and salary
administration, equitable treatment of employees, grievance resolution, training and development, promotion from within,
and the like);
competent management (profit sharing will not generate a profit when management, even in normal times, cannot)".
A US writer using US data states
"On all measures of significance, the profit-sharing sharing group of companies outperformed the non-profit-sharing group by substantial and widening percentages as can be seen in the foil.owing table:
Ratio,s~ 1969
Net income to net worth Net income to sales
Profit-sharing
Non-Profit-Companies sharing
Companies
12.78% 8.00%
3.62% 2.70%
Indices, 1969 (1952 = i00)
Sales Net worth
Earnings per common share Dividends per common share
Market price per common share
358.40 266.00
376.10 256.70
410.50 218.80
293.70 175.30
f
782.10 397.60
Other Measures
Approximate company earnings per
employee (1969) $1,165 $647
Growth of the invested dollar
(1952-1969) , $9.89 $5.61
Employment growth 103, 7 % 75.5%"
The data related to US department store chains. Our comment is
that the trouble here is attribution of causation. While the introductory wording
of the foregoing quotation is careful, there is an implication and ml intention to
convey the impression that PS was the reason for the different experience of the
two groups. It may be that it was because they were successful that the PS group
had recourse to PS; there seems no justification for the adjective "widening" in
the quotation. If more successful than the non - PS group in the period 1952-69,
it is likely to have been mpre successful prior to 1952 and, when it was decided
1.16
reading leads us towards the latter direction of causation, i. e’ towards a discounting
of incentive effects of PS.
/"
PS has had a great success in U.S.A. John Fitzpatrick (1978)
w~i te s:
-"The present strength of the movement may be gauged by reference to its membership. Some ten million employees
are now covered and the trust funds accumulated on their behalf amount to over $30 billion. One in every four mm~ufacturing, one in three distribution businesses, now
operate profit-sharing schenqes. Forty percent of America’s four thousand banks, including three-quarters of the largest, have schemes. Sectors hitherto considered unsuitable for
profit-sharing, such for instance as construction and transportation,
have been found susceptible. Irrespective of whether the Company’s operation is labour-intensive or otherwise, or whether profits
are stable or widcly fluctuating, it has been found possible to devise effective schemes. "
As regards USA’s greater recourse to PS it may be observed
that, as regards pensions and social security,, at company level and governmentally,
USA has been backward compared to Europe. PS is tax-favoured in USA yet this
alone cannot account for its success which must be due in part to PS’s incentive
2. Some Statistical Aspects of Profit in Ireland
:For a consideration of PS we should know something about profit
levels in Ireland, in regard to which statistics are meagre. Our short analysis
may have some interest in itself.
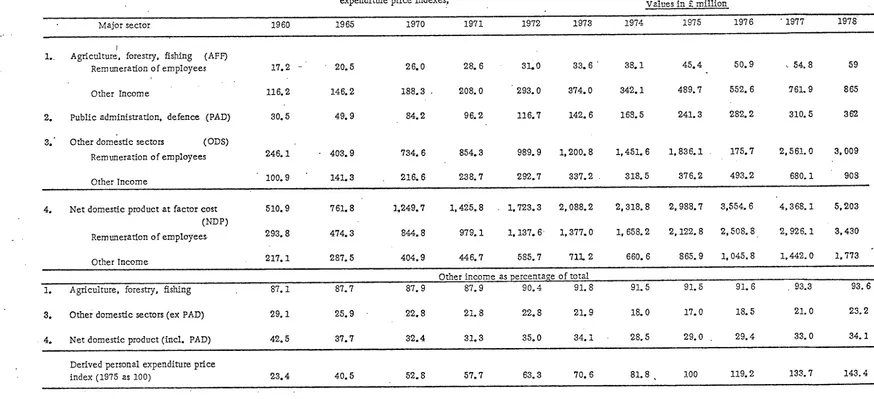
Table 2.1 shows that between 1960 (about when the modern industrial
revolution started) and 1978 (latest figures available, in preliminary form ) the
proportions borne by pay of employees and "other" income (the latter so termed
in what follows) in added value has changed drastically; in fact percentage of
other income fell from 42.5 to 32.1, the very 10w figures for 1974:-76 reflecting
the recession in these years, reminding us the essential character of other
income, namely that it is a residue, showing the effects of the vicissitudes
of fortune in factors external to enterprise. Of course, other income includes
more than profit in the narrow sense (i. e. as interest on capital) since it
includes incomes of the self-employed.
From the PS point of view, interest must centre on major sector 3
of Table 2.1. We notice that, in current terms, with 1960 as 100, other income
in 1978 was 900 while employee pay was about 1,200, prices (last row of table)
multiplying by six. The row of percentages for this major sector (3) show
that the stable situation of the years 1970-73 was restored in 1977.
The great fall in the percentage borne by employee compensation in
AFF from 12.9 in 1960 to 6.4 in 1978 is due to tim decline in number of
Table 2. I.
# 4 ~, ,, ¯ ?
Added value in categories (I) remuneration of employees, (2) other income in three major sectors 1960-1977, with ~ercentages derived therehom, with personal expenditure price indexes Values in £ million
Major sector 1960 1965 1970 1971 1972 1973 1974 1975 1976 " 1977 1978
I..
l
Agriculture, forestry, fishing (AFF) Remuneration of employees
Other Income
2. Public administration, defence (PAD)
3. Other domestic sectors (ODS) Remuneration of employees
Other Income
17.2 - 20.5 26.0 28.6 31’0 33.6 38.1 45.4 50.9 . 54.8 59
116.2 146.2 188.3 208.0 293.0 374.0 342.1 489.7 552.6 761.9 865
30.5 49.9 84.2 96.2 116.7 142.6 168.5 241.3 282.2 310.5 362
246.1 403.9 734,6
100.9 141.3 216.6
854.3 989.9 1,200.8 1,451.6 1,836.1 175.7 2,561.0 3,009
238.7 292.7 337.2 318.5 376.2 493.2 680.1 908
4. Net domestic product at factor cost (NDP) Rein uneradon o f employees.
Other Income
510.9 761. 8
293.8 474. 3
217. I 287. 5
]~249.7 1, 425.8 1,723.3 2, 088.2 2,318.8 2,988.7 3,554.6 4,368.1 5,203
844.8 979.1 I, 137. 6 1,377.0 1,658.2 2,122.8 2,508.8 2,926.1 3.430
404.9 446.7 585.7 711.2 660.6 865.9 1,045.8 1,442.0 1,773
I. Agriculture, forestry, fishing
3. Other domestic sectors (ex PAD)
¯ 4. Net domestic product (incl. PAD)
87. I 87.7
29. 1 25.9
42.5 37.7
Otherincome as percentage oftotal
87.9 87.9 90.4 91.8 91.5 91.5 91.6 93.3
22.8 21.8 22.8 21.9 18.0 17.0 18.5 21.0
32.4 31.3 35.0 34.1 28.5 29.0 29.4 33.0
93.6
23.2
34. 1
Derived personal expenditure price
index (1975 as I00) 23. 4 40.5 52.8 57.7 63.3 70.6 81.8 , 100 119.2 133.7 143.4
Table 2.2 shows tl]e fluctuation in price of ordinary stocks and shares o~
Irish companies quoted oa the Irish Stock Exchange. These are the prices of a
weighted set of quotations which would Imve cost £100 on average in 1963. Annual
averages are those of the prices at the beginning of each month. The trend is
#
illustrated on Chart 1, which also shows the CPI to the same base (1963). The
fluctuations in price from year to year in the share price index are seen to be
very large, remarkably so, considering that these figures are averaged two
t
ways, by individual quotations and by months. We surmise that the rewards
by way of capital gains of investors in individual Irish stocks are very variable.
Since 1963 the prices of stocks and shares have barely kept pace with
tile CPI, while reflecting the recession of 1974-76. In view of tile risk of
investment the investor might have expected better. This experience is in
strong contrast to tile period 1960-63, the early years of tile industrial resurgence,
t
when obviously on investor buyi,lg in 1960 and selling in 1963 would have
profited handsomely in real terms.
~Chart 1]
Table 2.3 has for its object the comparison of the last two rows (5, 6):
I
while real earnings per hour of employees have doubled between 1960 and 1973,
real profit per £100 constant price capital has remained almost static. Vaughan’s
estimates of fixed capital extend only to the year 1973 and all constant price data
relate to the year 1958, as is the case with the capital estimates. In manufacturing
industry the reward of labour has improved enormously, no doubt mainly througll
greatly increased capitalisation, the ulfitary remuneration of which however, has
2.4
T_~bl_J_~.,.2_9, Price index numbers of Irish ordinary stocks and shares and of consumer prices 1960-1979~
. 1963 as I00
Ir. ord.
Year Stocks & CPI Shares
19 60 60.4 91. 1
1961 71. 6 93. 6
1962 82.0 97.6
1963 100 100
1964 124. 6 106. 7
1965 121.0 112, 1
1966 112.9 115, 4
1967 112.7 1191 1
1968 160, 7 124.7
1969 169.9 134, 0
Year CPI 1970 1971 1972 1973 1974 1975 1976 1977 1978 1979 It. ord. Stocks & Shares 149. 5 145.0 913. 3 252.0 169. 3 164. 6 174. 6 219.2 331.9 ¯ $ 370, 7 145.0 157.9 171.6 191. 1 223.5 270.2 318. 8 36"2.3 390.0 441.9 7 months
Basic sources: various issues of Irish Statistical Bullctin~
g’g
I’
I’ I.
"i
i, l ! i
"i
l"
. I
Table 2. 3. Real earnings per hour and real profit per £1, 000 fn<ed capital invested manufacturing industry, 1960-1973
Item 1960 !965 1970 1971 1972 1973
I~ Fixed capitallat constant (1958) prices, net (F_m) 185. i 269. 7 404. I
2. Pro~t at current prices - (F_m) 88.3 54.8 100.2
3. Pro~t at constant (1958) :,. (Y,m) 38. 1 44. 4 62.7
4. Earnings per hour, current, September (£) O. 167 O. 245 O. 424~
5. Earnings per hour at constant (1958) prices (£) O. !67 O. 198 O. 263
6. P~o~t at constant pdces per £I00 net capital at constant prices (£) 20. 6 16. 5 15.5
440.0 ’
II0. 0
63.2
O. 491
O. 28O
14.4
494. ,5
154. 2
81.6
0.559
0.293
16.5
535.6
197.3
93.7
O. 687
0.323
17.5
Basic source~.
Item
I.
2.
3o
5. 6.
"Estimates of Capital Employed in Manufacturing Indus,17 1950-1973" by R. Vaughan ESRI Paper No. Statistical Bulletin (various issues).
Notes
¯ . ." . o
Vaughan’s estimams are calcuIated by the perpetual inventory method, based mainly on the CIP values of gross ~xed capital formation.
E.W. Henry’s input-output estimate for pro~t in manufacturing industry in 1976 adjusted proportionately according to value added other than empioyed income in all industry (Table 2A and 2B in NIE 1977).
2 deflated by annual CPI.
4 deflated by mid-August CPI.
|
2.7
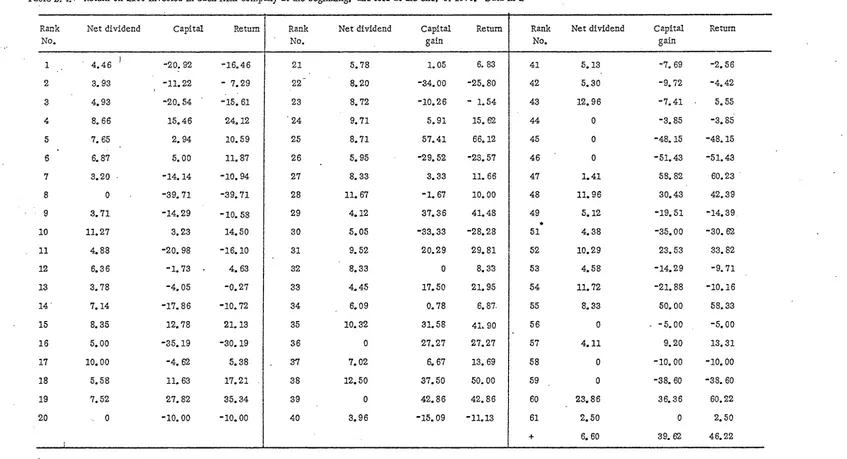
An examination of the financial returns of Irish companies brings to light
the extraordinary variability in profit return between companies. We envisage
the single year 1979 and in Table 2.4 we consider the resul~ of investing £100 at the
beginning of the year and selling it at the end. The dividend is not that for the
calendar year 1979 but that which (if any) is the latest paid. The data used are
those compiled by E. McVey for The Irish Times, in which companies are ranked
according to turnover, no. 1 the highest. Table 2 ,4 shows net dividend, capital gain
realised and the sum of the two which we term "return" (on the £100 invested, not
to be confused with company profit, analysed later).
Table 2.4]
The number of companies listed is 61. The simple averages of net
dividend, capital gain and return on the £100 invested were respectively £6.06,
£0.08 and £6.14. Ten companies (or one sixth) paid no dividend, 31 (or just one
half) made capital losses. Since capital gains (or losses) were greater in absolute
magnitude than net dividends, the picture for returns was similar to that for capital
gains; losses occurred in 27 companies. The highest net dividend was £24
(for company no. 60), capital gains (or losses) ranged from £59 (for company no. 47)
to minus £51 (for company no. 46), all in relation to the same investment of
£100. Table 2.5 gives the frequency distribution according to the three factors.
Table 2.5
Net No.
dividend (£)
0 10
0.01 -3.99 - 7
4 - 7.99 24
8 - 1F.99, 17
12 or over 3
No. of companies 61
Frequency distributions based on Table 2.4
Capital No. Return
gain (£) No.
30 or over 10 12
0 - 29.99 20 22
-30 - -0.01 23 21
-30.01 or less 8 6
61 61
Table 2. 4. Return on £100 invested in each Irish company at the beginning, and sold at the end, of 1979. Data in £
Rank Net dividend Capital No. 1 2 3 4 5 6 7 8 9 I0 II 12 13 14 15 16 17 18 19 2O Returrl
4.46 -20. 92 -16.46
3. 93 -II. 22 - 7.29
4. 93 -20.54 -15.61
8. 66 15.46 24. 12
7. 65 2. 94 I0.59
6. 87 5. 00 II. 87
3.20 -14. 14 -10.94
0 -39. 71 -39.71
3.71 -14.29 -I0. 58
11.27 3.23 14. 50
4. 88 -20.98 -16. I0
6. 36 "1. 73 4. 63
3.78 -4.05 -0.27
7. 14 -17. 86 -10.72
8. 35 12. q8 21. 13
5. O0 -35. 19 "30.19
I0. O0 -4. 62 5.38
5.58 II. 63 17.21
7.52 27. 82 35.34
0 -I0. O0 -I0. O0
Rank Net dividend Capital
No. gain 21 22-23 24 Return
5.78 1.05 6. 83
8. 20 -34. O0 -25.80
8.72 -10.26 - 1.54
9.71 5.91 15.62
Rank Net dividend No.
41 5.13
42 5.30
43 12.9 6
44 0
45 0
46 0
47 I. 41
48 11.96
49 5.12
51 4.38
52 I0.29
53 4.58
54 II. 72
55 8.33 56 0 57 4.11 58 0 59 0 60 23.86 61 2.50
+ 6. 60 25 26 27 28 29 30 31 32 33 34 35 36 37 38 39 40
8.71 57.41 66.12
5. 95 -29.52 -23.57
8. 33 3.33 II. 66
II. 67 -I. 67 I0.00
4. 12 87. 36 41.48
6.05 "33.33 -28.28
9.52 20.29 29.81
8.33 0 8. 33
4.45 17.50 21.95
6. 09 O. 78 6. 87
I0. 32 31.58 41, 90
0 27.27 27.27
7.02 6. 67 13.69
12.50 37.50 50. O0
0 42.86 42.86
3.96 -15.09 -11.13
Capital gain -7. 69 -9.72 -7.41 -3.85 -48. 15 -51.43 58.82 30.43 -19.51 -35. O0 23.53 -14.29 -21.88 50.00 -5.00 9.20 -10. O0 -38. 60 36.36 0 39,62 Return -2.56 -4. 42 5.55 -3.85 -48. 15 -51.43 60.23 " 42.39 -14.39 -30. 62 33.82 -9.71 -I0.16 58.33 -5.00 13.31 -i0.00 -38. 60 60.22 2. 50 46.22 * +
ParticuIars missing for company ranked no. 50 Turnover, hence rank, unknown.
2.9
a
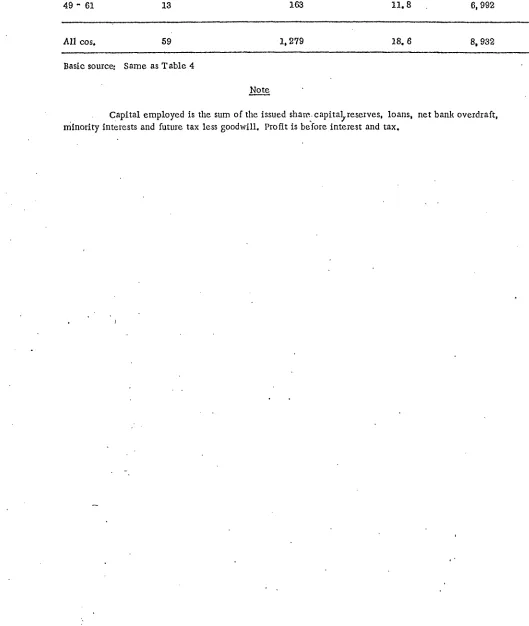
Table 2.6 is based on the 59 of the 61 Irtsl.~ companies displayed [n
Table 2.4 for which particulars of employment, capital aTld profit were available
from the M:oVey table. In aggregate in the 59 firms, capital, employed amounted
to £674 million, profit £125 million, number of employees 75,400. It will be noted
J
that the principle of classification by size,namely turnover, is different, for the
three factors manipulated, a procedure necessary for avoidance of bias. The
average number of employees column shows that the turnover classification also
Is successful in classifying by size of company as measured by number of employees.
Assignment of about equal numbers of companies in each grade in Table 2.6
deliberate, to avoid selectivity.
While the figures in the last two columns do not vary regularly with
size of firm it is fairly clear thatcapitalintensity (last column) is related to size
of firm.
There are many definitions of capital. To assume that any of the
capital~as defined and measured for Table 2.6, would be available for alternative
investment is fanciful. Nevertheless, a very strong impression from Table 2.6 is
that percentage profit is far too low, in view of the demonstrated risk attached to
mvestment.m Irish securities, which are anything but secure. The aggregate 18.6%
is but little in excess of the approximate 16½-% yield on longterm Irish Government
stock in 1979, available without any hazard whatsoever, apart, of course, from
capital or ilfflationary loss.
It may be because of emphasis on employment in the Irish economic
upsurge that profitability of investment has been disregarded, .due in large measure
to the ab~el~ce of official statistics of capital:employed. Yet in the private sector
investment depends on anticipation of profit and investment is needed for employment.
If no firm statement can be ~nade about the rewards in equity of labour and capital
Table 2.6
2.10
Number of employees per company, profit as a percentage of capttal and capital per employee in five groups of companies classified by turnover, 1979
Ralak Nos. No. of cos. Employees per company Profit as Capital employed o]o of. per employee
capital
No. qo ¯ £
1 " 12 12 3, 649 19. 8 9, 970
18 " 24 12 2,363 15. 1 7,538
25 " 36 11 827 21.0 7, 675
37 " 48 12 458 14. 1 ’/, 486
49 " 61 13 163 11.8 6, 992
All cos. 59 1, 279 18. 6 8, 932
Basic source: Same as Table 4
Not..__~e
Capital employed is tile sum of the issued share...capita~reserves, loans, net bank overdraft, minority interests and future tax less goodwill, Profit is before interest and tax.
2.11
than capital and, having regard to the risks associated with private investment,
¯ earnings therein seem meagre.
One of the stated objects of PS is the wider dJ.ssemination of
ownership of wealth. So there is some interest in its present concentration in
Irish business. Table 2.7 shows that of £674m. capital £119m. or 18 per cent
Table 2.7]
is owned by company directors or members of their families. As might be
expected family--d[reetor ownership percentage diminishes as company size
increases. Oats[de ownership percentage, 31 per cent overall, varies generally,
if not regularly, with size of company. While, as pointed out in tlm Note, the two
categories are not exclusive, it seems that about half the capital is owned in
Ireland other than by directors and family and that the proportion (one-half)
does not vary much by size of company. In Tables 2.6 and 2.7 the classification
of companies is the same. The showing in both is dominated by the twelve companies
in the largest group which accounts for two-thirds of capital employed and nearly
two-fifths of employment.
¯ Table 2.4 -2.7 relate only to what are described as "Irish public
companies" ,which those for which prices are quoted on the Irish Stock Exchange.
Their activities cover only a small fraction of all Irish business, best evidenced
by their employing 75,000 only 10 (7) per cent of all non-agricultural employees
2.12
Table 2.7. Total capital employed, capital owned by family and directors, and capital owned outside the State, in same five groups of companies as in Table 2.6
Rank ]No. of Capital Ownership
nos. cos. employed Fam. dir. Outside
. % Ownership
Faro. dir. Outside
£ m £ In £ m
1-12 12 436,6 59.81 163.15 13.7 37.4
13-14 11 113.0 23.05 15.82 20.4 14.0
25-36 11 69.3 17.50 15.64 25.3 22.6
37-48 12 40.7 14.03 10.10 34.5 24.8
49-61 13 14.2 4.79 2.44 33.7 17.2
All cos. 59 673.8 119.18 207.15 17.7 30.7
Basic source: Same as Table 2.4
Note
Capital as defined for Table 3.6. Amounts in the two categories of ownership in each size group estimated by applying given percentages to capital employed. The two categories are not exclusive since it is obvious from the
2.13
Correlation coefficients between the variables c]eait with in the
foregoing analyses are as follows
1 2 3 4 5
1 No. employees 1 -. 15 .13 -. 07 -. 20
% equity held by
-2 Faro., directors -. 15 1 -. 36 .23 .16
3 Outside State .13 -. 36 1 -. 11 .-. 02
Per £100
invested-4 Net dividend -. 07 .22 -. 11 1 .39
5 Capital gain .20 .16 -.02 .39 1
For c.c. NH]? critical levels for 57 d.f. : - r (.1) = .22; r(.05)=.26; r (.01)=.33
All correlations are small. Only two cm~ be accounted significant
mid both are to be expected, the . 39 between dividend (4) ,and capital gain (5)
and the negative -.36 between percentages (2, 3). There seems to be a slight
tendency for businesses with high ownership by family and directors to have
higher dividends and capital gains.
One set of non-significant results is of greater interest, namely
fllat size of business as determined by employment (1) had no i~ffluence on the
other variables. The tables given earlier were more revealing than this
3. Irish experience with profit sharin~
"Company" is a vague concept in its popular usage in Ireland.
From different sources we derived a list of about 3,000 companies, from
which we selected a non-random sample of about one-tenth, in fact 319, to
whom a very simple single page form containing six questions was sent; 180
or 56 per cent were returned. We are aware that PS in Ireland is at its
small beginnings so that the object of our inquiry was more to obtain details
of types of PS as case histories than as statistical estimates (of number of
companies practising PS classified in various ways); enough to lmow that some
one-tenth or fewer of companies have some form of PS. Hence the non-random
sample which, in fact, consisted of (i) all Irish companies in the 1979 Iris_.__h
Times list, ([i) all banks and finance houses listed in Thorn’s Commercial
Directory 1979/80, (iii) a one-tenth systematic sample of companies listed
in Thom’s Commercial Directory 1979/80, (iv) a one-third sample of the top 100
grant-aided foreign companies, to repeat 319 companies in all.
Of 180 which responded, 30 had PS in some form, or one-sixth.
Probably the national proportion is much smaller (even as regards companies)
since one assumes that the 139 who did not trouble to reply contained very few
profit sharers. Suffice to repeat that PS is at its small beginnings in Ireland.
The 30 were interviewed orally using a very detailed structured form - see
synoptic table - or were sent the form; 22 companies complied. It may be
stated, without specifically identifying them, that they contain a number of
the most illustrious companies in Ireland. Our object is not to obtain statistics
of the number of companies practising PS in Ireland, (we knew beforehand that
they were few) classified in various ways, but rather to ascertain the types of
profit-sharingwhich, as it happens, vary a great deal. We have tried to show these
variations in the synoptic table but there are many particularities which the
table conceals. For this reason we have judged it expedient to give a short
description for each of the twenty-two companies, as an Appendix.
Co. No 1 2 3 4 5 6 7
411
Synoptic table showing profit-sharlng characteristics of twenty-two Irish companies, (See Key for numer~tlon)
8 9 10 11 12 13 14 15 16 17 18 19 20 21 22 23 24 25 26 27 28 29
CO.
30 :No. 31 32 33
1 i!i 25 3 8,000 I iv 7,300 ii I l i Ii .iil iii i f ti $
2 iii 100 15 ~60 ii iv 160 t, iit t t i il t t i t i
3 tl 1 6 230 ii t 30 i - - - ii i i i
ti it, iii, tv i tt 73/74 i if
i[ if, iv . i ii 65/66 i ii
i -
-
-
~3
i
--i iii" f, li, iit, 1 U- i 1, li I itt, ty, I, Ill, v, 2 v t ~ iI, iv
vii
- t i, ii, iIi 3 v i i
4 "t, it "39 5 115 ti i 12 i, lI If - " t it if[ - i - it’ t II it [ - 78/79 i ii i i iii, v 4 v i i
5 lil - - 7, 500 i iv 7,500 i, iil i i i II iii ill- [ i 6 ili I00 I 200 li iv 90 i,H’~ i i il " - ili Ill i i
7 iii 16 4 600 "t i 32 i, iii i If li fi i li i i
8 f 75 4 2,500 if iV 2,500 i ii - ii i if - - i
il t 1[ I
if i i i
ii i . i ii
Ii i t i
ii ii, iii i ii ’50 i . i, ii
[ - i it ’74 i iI
ii i~ti, ili i It ’78 ’i it iv
it ii - - ’64 i - i[
iiit, iv it, v 5 v t t, it. it[ i i[I i,ii, iii, 6 i [ 4 Iit, v’di
vH
i iii, tv i, ii, iit, 7 v i i, iii, vi V V, Vi
- iii, v t, ii, iii 8 v f 1, II. iif, iv, viii
9 [ I00 - 323 il iv 323 i Ii - li i I - - ii Ii i
1O ill I00 2,700 i iv 2, 700 i ii - iI
Ii I 51 I0 217 l[ i 12 i ii - i lii ill - - i li i
i il ii il - - ’79 i f - ii, iv I, ii, iI~ 9 ii i L ii, lil, vltl V
ii - - i It iv, v i, H, iii I0 Iii i ~v~
i il ii ~ [l - - ’79 i iI - i iH I1 :. v i i, ii
12 i,l[ 5" - .11800 i iv 400 Ii II i ii li - ill i "- It
13 lii I00 6 90 i iv 70 I, lil Ii il II ii ii[ Ill i i li
- ii Ii II ii i- II ’79 i ii I ill, IV I, il, IH, 12 I1 i i, vi v, vii
i, ll i i ii iI i II ’78 i ii [ iii i,v 13 iii i i, if, ill
14 i, il 51 - 900 I i 40 ill i If li li i ii i [ II - "- i II " [, iv I li ’75 i ii i iii viii 14 v i 1, iI, ill
15 I 5 2 600 ~ iv 550 il ii li - li ill i i Ii H il ii [ ii I i ii ’71 i il i ill if 15 Iii I 4il
16 i 0 - 350 i i 40 { II - i! iI lii - - i II i [ i ii il - - ’76 i li - Ill iil, vli 16 i i i, il
17 lii I00 - 598 [i iv 524 i, il li if ii iI lii iiII i ii i i li Ii :li . i ii ’79 i If i ill - 17 - i
18 i, ii 43 I 2,700 i i 170 i ii i i: li ill li i iii il ill ii i It i i Ii ’69 i li I i vii 18 il i I, iII, V
19 i I00 3
20
i
35 4½
’21 i I00 9
600 ii iV
863 i iv
482 il iV
593 1 li - it i il i II i i i li "H - - ’25 I ii - ii, ill, il, fibril 19 i i i, it iv iv
849 i il - ii i li i ii [ il li li i[ - - ’75 i i - ii, ill, i, H,v. 20 v i i, il, [v, vll
iv "
482 i li - li I [ii - - ii - i ii i ii Ii - - ’67 i "- - i i, li 21 v i i
3.3
Key to notation in synoptic table
1 2 3 4 5 6
’v
8 9 I0 11 12 13 14 15 16 17 18 19 20 21 22 23 24Broad sector:- (i) manufacturing, (ii) distribution, (iii) other services
Percentage of equity held outside State
Percentage of after-tax profit distributed under the profit-sharing scheme in the last financial year. * Percentage before tax
Employment (approximate).
t public (principal), ii public (subsidiary).
Coverage:- i managerial, executive, ii clerical, iii other employees, iv all employees.
Number of employees in scheme.
Form of sharing:- i cash, ii allocation of stiares, iii share option.
Contribution by employees:- i Yes, ii No
Are shares issued at a discount? i Yes, ii No.
Is scheme varied according to type of employee:- i Yes, ii No.
Are part time staff included? i Yes, ii No
Minimum period of service for qualification:- i no minimum, ii under one year, iii one year or over.
If shares are allocated, can employees:- i sell shares immediately or hold for under one year, ii hold one year but under five yeat’s, iii hold five years or over?
Shares or options issued to:- individual employees, ii a trust fund for employees.
Frequency of payment:- i yearly, ii twice yearly, iii more frequently.
Employee participation in management of PS:- i Yes, ii No
Allocations:- i before tax, ii after tax, iii unrelated to profit.
Minimum profit necessary before allocation:- i Yes, ii No.
Allocation discretionary:- i Yes, ii No.
Do employees receive equal amounts? i Yes, ii No
If 21 is No, allocations are according to:- i seniority, ii pay, iii grade, iv merit?
Allocation is of i ordinary shares, ii preference shares.
25
26
27
28
29
3O
31
32
33
3.4
Year when PS started.
Was PS started on initiative of i management, ii employees,
If 26 was i, were employees consulted before initiation? i Yes, ii No
Is share of share option allocation confined to own shares? i Yes, ii No
Steps taken by management to propagate benefit of PS - i no action, ii notices on notice boards, iii communications to individuals, iv staff meetings, v brochures etc.
Company objectives in PS - i distributive justice, ii industrial relations, iiiproductivity, efficiency, iv lessening absenteeism, v motivation, vi competitiveness, vii profit, viii retain staff.
Attaimnent of objectives - i no, ii partly, iii doubtful, iv not long enough
in operation to judge, v yes.
Fringe benefits independent of PS - i Yes, ii No.
If Yes at 32, benefits:- i pension, ii medical, iii cash bonus, iv subsidy to canteen, bar, v car, vi loans, vii product allowance, viii other
3.5
The showing of the table may be summarized as follows.
About half the companies arc owned (in majority equity) outside Ireland.
Practically all are large firms by Irish standards. Most of the after - tax
profit for PS is less than 10 per cent. All are public companies, half-and-half
principal and subsidiary. Two-thirds of the companies’ PS extends to all
permanent staff, one-third to the executive class only, in the latte]: case
the proportion of staff covered is therefore small. In most cases distribution
is in the form of cash, sometimes with shares or share-options. Contributions
by employees is rare. In most relevant cases shares are issued to participants
at a discount, and do not vary according to rank of employee. Mostly part-time
staff are not included. A year or more service by recipients for inclusion is
required in most cases. Practice is varied as to length of time shares must
be held unsold. In all cases-of shares but one in the sample, shares were
allocated on an individual (and not a trust fund) basis. Sharing was mostly
yearly. In nearly all cases there was no employee participation in management
of PS, in the initiation of the scheme or any form of consultancy in regard to it;
PS is the child of management in Ireland. Most allocations are before tax;
a minimum profit is necessary before PS, mostly. Allocation is discretionary
in about half the sample companies (i. e. at the discretion of management, half
therefore according to some predetermined rule). Distribution is usually
according to pay. Shares are always ordinary shares in own company, with
no prior negotiation of value with staff by management. In all lo~own cases but
bye schemes was of recent origin (earliest 1964). Some action was taken by
mangement in most cases to propagate benefits of PS amongst employees.
Company objectives ranged over the whole spectrum listed in the Key
(head 30). All sampled companies had fringe benefits, invariably including
pension. As to attainment of objectives, most comp~’mies were satisfied, but
3.6
Our interviews with the twenty-two PS companies left us with the
following
impressions:-¯ ’ 1 Compmlies were highly successful by the usual tests;
2 their PS was of recent origin;
3 their deep involvement in fringe benefits;
4 non-involvement of staff in initiating or controlling PS schemes;
5 extent to whichPS schemes consisted of cash and not share
allocation, tending to result in PS being regarded as part of pay and not in sharing in ownership;
6 comparative disinterest as to whether PS would benefit company;
7 small propaganda amongst st,’fff about PS.
It would seem indeed that the impulsion towards PS on these companies
was an extension of 3 above, which could come under the head of enlightened
se~-interest, but with little concern about results. If PS is to be adopted it seems that
reversal at heads 4 - 7 would be beneficial. A very serious qualification to widespread
profit sharing 111 Ireland is our statistical showing that profit as percentage of capital
invested is generally low. Variation is, however, great, so that a proportion of
firms could afford substantial PS.
While, in our sample, a majority indicated that they were satisfied
"F
with the results of PS (and are so recorded in the synoptic table) we suspect that
this is usually a statement that.the system is Working efficiently. For the majority
of companies :PS has been in operation for only a few years and it is too soon to
decide whether the scheme has been a success as regards any or all the desired
effects, as listed at head 30 of the key to the synoptic table. In any case it will
be difficult to decide since the firms which have PS are "good" firms and the might
4. Conclusion
From our study of the literature, a survey in Ireland involving personal
interviews on a structured questionnaire with companies practising PS, and from
our own impressions of all this material we
find:-not much interest in the topic amongst m.’magements or employees;
some interest in the EEC Commission and governments generally, Irelalld’s in particular;
a vast degree of variation in schemes in Ireland and elsewhere;
a small proportion of firms with I~S in Ireland and no high percentage anywhere except in France, and fll USA where it is tax-favoured and involved in fringe benefits;
in Ireland, practising firms have good fringe benefits: we lifter that PS is widely regarded as an extension of these; trade unions are disinterested when they are not positively antagonistic;
broadly there are two types of schemes of deductions from profit l distributed amongst own staff, 2 contributed to a gener;al fund for all employees of all firms, 2 being favoured by trade unions;
experts are generally agreed as to aspirations with regard to PS but there is an entire absence of statistical proof as to
whether stated objectives have been attained, there being simply statements that this has been the case usually.
Our title is in the form of a question implying that we seek an answer. This
answer should be Yes, No or Doubtful. For rely choice, reasons should be given. If
Yes the type of scheme favoured should be sketched in broad lines, while recognising
that choice of scheme will depend on company circumstances. We may state at once
that our answer is Yes.
Our mmlysis will be full of value judgements, so deprecated by analysts
seeking proof. To repeat, we have been unable to find statistical proof, little economic
theory and vast variability in scheme detail, this an argument for absence of proof of
theory. So we feel justified in recourse to value judgement, noting the words of the
EEC Commission of Communities in regard to PS "We are of the opinion .... "
4.2
most as resulting from months of reflection and study. We will be well content
if the opinions in this section and in the paper generally (the other sections of
which consisting almost entirely of statistical and other facts) will polarize discussion,
even if most other opinions differ from ours.
I~S in its origins was idealistic, paternalistic and generally charitable
in its intent. Tending towards the economic were the objects of increased saving,
increased labour productivity, improved industrial relations, distributive justice,
with diminution generally of the two-sided industrial philosophy within the firm.
Collectively these objects, insofar as they are attainable, would go some way towards
justifying PS. Can we produce any further argumentation that PS is in accordance
with the natural law? Can we ascertain or set limits to the just rewards of those
entitled to a share of VA in an individual enterprise ?
Very eaxly on we came to the conclusion that PS was but a small p,-Lrt of the
important topic of participation, implying the question of the share of employees in
ownership and management of the firm. Taking a stand mainly on ethical grotmds we
have not the smallest doubt that ox~ership and management should be widely distributed
amongst staff, who are vitally concerned in the success and even the survival of the
¯ I
firm. (Happily, ethical judgements are, of necessity, value judgements, not requiring
apology therefore.) We are on record as deprecating these two
sides in industry, al.guing that employees and owners of an enterprise are in the same
boat, This results in demands for employee compensation being to a large extent
independent of the welfare of the firm, sometimes leaving too little for profit on which,
largely through allocations to reserve, the survival of the firm depends. The two-sided
philosophy is fully accepted by management and staff. We do not argue that its
disappearmlce is necessary for participation in general or PS in particular. We do
consider that a better atmosphere in industrial relations than at present is a prior
4.3
In its-practical aspect tl~e problem of PS raised the more general question
of the fair division of value added (VA) between owners and staff. Thus some
consideration of VA will be necessary.
VA, the difference between total sales and purchases of goods and services
embodied ii~ these sales, in any period (usually a year but nowadays efficient ficms
use shorter periods for accounting), is the measure of work done by the firm in the
L
period. ’Sales will include value of increase in stocks of goods (products and materials)
during the period; that these unsold elements can be valued in different ways need not
trouble us at this stage. Purchases include a valuation for depreciation (or capital
consumption) as well as repairs and maintenance during the period. Here again there
is an unsold (and hence non-valued) element, namely depreciation. That added value
can have different valuation does not disqualify it from being the fens c_tt or_q_r~ in any
discussion of the distribution of the value of work of the firm. Our argument will
apply however VA is defined. Nor need we be troubled about the fact that levels of
Sales and/or purchases may be subject partly or wholly to monopolistic pressures,
thus increasing or decreasing VA.
For this discussion VA may be regarded as consisting of four main
categories
:-(i)
(ii)
(iii)
(iv)
employee compensation;
company taxation;
additions to reserves, i.e. company saving;
dividends and interest.
These four categories are set out in their natural order, the order in which
a board of directors usually would consider them. We deal with them in the following
paragraphs, as far as relevant to our inquiry.
(i) Em~yee compensation includ.es overtime and bonus (on turnover or for
productivity etc. - let us exclude bonus in the form of PS for the moment, terming