NLI Shared Task 2013: MQ Submission
Shervin Malmasi Sze-Meng Jojo Wong Mark Dras
Centre for Language Technology Macquarie University
Sydney, Australia
{shervin.malmasi,sze.wong,mark.dras}@mq.edu.au
Abstract
Our submission for this NLI shared task used for the most part standard features found in re-cent work. Our focus was instead on two other aspects of our system: at a high level, on pos-sible ways of constructing ensembles of multi-ple classifiers; and at a low level, on the gran-ularity of part-of-speech tags used as features. We found that the choice of ensemble com-bination method did not lead to much differ-ence in results, although exploiting the vary-ing behaviours of linear versus logistic regres-sion SVM classifiers could be promising in fu-ture work; but part-of-speech tagsets showed noticeable differences.
We also note that the overall architecture, with its feature set and ensemble approach, had an accuracy of 83.1% on the test set when trained on both the training data and development data supplied, close to the best result of the task. This suggests that basically throwing together all the features of previous work will achieve roughly the state of the art.
1 Introduction
Among the efflorescence of work on Native Lan-guage Identification (NLI) noted by the shared task organisers, there are two trends in recent work in particular that we considered in building our sub-mission. The first is the proposal and use of new features that might have relevance to NLI: for exam-ple, Wong and Dras (2011), motivated by the Con-trastive Analysis Hypothesis (Lado, 1957) from the field of Second Language Acquisition, introduced
syntactic structure as a feature; Swanson and Char-niak (2012) introduced more complex Tree Substi-tution (TSG) structures, learned by Bayesian infer-ence; and Bykh and Meurers (2012) used recurring n-grams, inspired by the variation n-gram approach to corpus error annotation detection (Dickinson and Meurers, 2003). Starting from the features intro-duced in these papers and others, then, other recent papers have compiled a comprehensive collection of features based on the earlier work — Tetreault et al. (2012) is an example, combining and analysing most of the features used in previous work. Given the timeframe of the shared task, there seemed to be not much mileage in trying new features that were likely to be more peripheral to the task.
A second trend, most apparent in 2012, was the examination of other corpora besides the Interna-tional Corpus of Learner English used in earlier work, and in particular the use of cross-corpus evalu-ation (Brooke and Hirst, 2012; Tetreault et al., 2012) to avoid topic bias in determining native language. Possible topic bias had been a reason for avoiding a full range of n-grams, in particular those contain-ing content words (Koppel et al., 2009); the devel-opment of new corpora and the analysis of the effect of topic bias mitigated this. The consequent use of a full range of n-grams further reinforced the view that novel features were unlikely to be a major source of interesting results.
We therefore concentrated on two areas: the use of classifier ensembles, and the choice of part-of-speech tags. With classifier ensembles, Tetreault et al. (2012) noted that these were highly useful in their system; but while that paper had extensive
ture descriptions, it did not discuss in detail the ap-proach to its ensembles. We therefore decided to examine a range of possible ensemble architectures. With part-of-speech tags, most work has used the Penn Treebank tagset, including those based on syn-tactic structure. Kochmar (2011) on the other hand used the CLAWS tagset,1 which is much richer and more oriented to linguistic analysis than the Penn Treebank one. Given the much larger size of the TOEFL11 corpus used for this shared task than the corpora used for much earlier work, data sparsity could be less of an issue, and the tagset a viable one for future work.
The description of our submission is therefore in three parts. In§2 we present the system description, with a focus on the ensemble architectures we inves-tigated; in§3 we list the features we used, which are basically those of much of the previous work; in§4 we present results of some of the variants we tried, particularly with respect to ensembles and tagsets; and in§5 we discuss some of the interesting charac-teristics of the data we noted during the shared task.
2 System Design
Our overall approach in terms of features and clas-sifiers used is a fairly standard one. One difference from most approaches, but inspired by Tetreault et al. (2012), is that we train multiple classifiers over subsets of the features, over different feature rep-resentations, and over different regularisation ap-proaches; we then combine them in ensembles (Di-etterich, 2000).
2.1 SVM Ensemble Construction
To construct our ensemble, we train individual clas-sifiers on a single feature type (e.g. PoS n-grams), using a specific feature value representation and classifier. We utilise a parallel ensemble structure where the classifiers are run on the input texts in-dependently and their results are then fused into the final output using a combiner.
Additionally, we also experiment with bagging (bootstrap aggregating), a commonly used method for ensemble generation (Breiman, 1996) to gener-ate multiple ensembles per feature type.
1http://ucrel.lancs.ac.uk/claws/
For our classifier, we use SVMs, specifically the LIBLINEAR SVM software package (Fan et al., 2008),2 which is well-suited to text classification tasks with large numbers of features and large num-bers of documents. LIBLINEAR provides both lo-gistic regression and linear SVMs; we experiment with both. In general, the linear classifier performs better, but it only provides the decision output. The logistic regression classifier on the other hand gives probability estimates, which are required by most of our combination methods (§2.3). We therefore mostly use the logistic regression classifiers.
2.2 L1- and L2-regularized SVM Classifiers
In our preliminary experiments we noted that some feature types performed better with L1-regularization and others with L2. In this work we generate classifiers using both methods and evaluate their individual and combined performance.
2.3 Classifier Combination Methods
We experiment with the following decision combi-nation methods, which have been discussed in the machine learning literature. Polikar (2006) provides an exposition of these rules and methods.
Plurality vote: Each classifier votes for a single class label, the label with the highest number of votes wins. Ties are broken arbitrarily.
Sum: All probability estimates are added together and the label with the highest sum is picked.
Average: The mean of all scores for each class is calculated and the label with the highest average probability is chosen.
Median: Each label’s estimates are sorted and the median value is selected as the final score for that label. The label with the highest value is picked.
Product: For each class label, all of the probabil-ity estimates are multiplied together to create the la-bel’s final estimate. The label with the highest esti-mate is selected. A single low score can have a big effect on the outcome.
Highest Confidence: In this simple method, the class label that receives the vote with the largest de-gree of confidence is selected as the final output.
2
Borda Count: The confidence estimates are con-verted to ranks and the final label selected using the Borda count algorithm (Ho et al., 1994). In this combination approach, broadly speaking points are assigned to ranks, and these tallied for the overall weight.
With the exception of the plurality vote, all of these can be weighted. In our ensembles we also ex-periment with weighting the output of each classifier using its individual accuracy on the training data as an indication of our degree of confidence in it.
2.4 Feature Representation
Most NLI studies have used two types of feature rep-resentations: binary (presence or absence of a fea-ture in a text) and normalized frequencies. Although binary feature values have been used in some stud-ies (e.g. Wong and Dras (2011)), most have used frequency-based values.
In the course of our experiments we have ob-served that the effect of the feature representation varies with the feature type, size of the feature space and the learning algorithm itself. In our current sys-tem, then, we generate two classifiers for each fea-ture type, one trained with frequency-based values (raw counts scaled using the L2-norm) and the other with binary. Our experiments assess both their indi-vidual and joint performance.
2.5 Proficiency-level Based Classification
To utilise the proficiency level information provided in the TOEFL11 corpus (texts are marked as either low, medium or high proficiency), we also investi-gate classifiers that are trained using only texts from specific proficiencies.
Tetreault et al. (2012) established that the classi-fication accuracy of their system varied across pro-ficiency levels, with high propro-ficiency texts being the hardest to classify. This is most likely due to the fact that writers at differing skill levels commit distinct types of errors at different rates (Ortega, 2009, for example). If learners of different backgrounds com-mit these errors with different distributions, these patterns could be used by a learner to further im-prove classification accuracy. We will use these fea-tures in one of our experiments to investigate the effectiveness of such proficiency-level based classi-fiers for NLI.
3 Features
We roughly divide out feature types into lexical, part-of-speech and syntactic. In all of the feature types below, we perform no feature selection.
3.1 Lexical Features
As all previous work, we use function words as fea-tures. In addition, given the attempts to control for topic bias in the TOEFL11 corpus, we also make use of various lexical features which have been pre-viously avoided by researchers due to the reported topic bias (Brooke and Hirst, 2011) in other NLI cor-pora such as the ICLE corpus.
Function Words In contrast to content words, function words do not have any meaning themselves, but rather can be seen as indicating the grammat-ical relations between other words. Examples in-clude articles, determiners, conjunctions and auxil-iary verbs. They have been widely used in studies of authorship attribution as well as NLI and established to be informative for these tasks. We use the list of 398 common English function words from Wong and Dras (2011). We also tested smaller sets, but ob-served that the larger sets achieve higher accuracy.
Function Wordn-grams We devised and tested a new feature that attempts to capture patterns of tion word use at the sentence level. We define func-tion wordn-grams as a type of wordn-gram where content words are skipped: they are thus a specific subtype of skip-gram discussed by Guthrie et al. (2006). For example, the sentence We should all start taking the buswould be reduced towe should all the, from which we would extract the n-grams.
Character n-grams Tsur and Rappoport (2007) demonstrated that character n-grams are a useful feature for NLI. These n-grams can be considered as a sub-word feature and their effectiveness is hy-pothesized to be a result of phoneme transfer from the writer’s L1. They can also capture orthographic conventions of a language. Accordingly, we limit ourn-grams to a maximum size of 3 as longer se-quences would correspond to short words and not phonemes or syllables.
Tetreault et al., 2012), with new corpora come into use for NLI and researchers exploring and address-ing the issues relataddress-ing to topic bias that previously prevented their use. Lexical choice is considered to be a prime feature for studying language transfer ef-fects, and researchers have found wordn-grams to be one of the strongest features for NLI. Tetreault et al. (2012) expanded on this by integrating 5-gram language models into their system. While we did not replicate this, we made use of word trigrams.
3.2 POSn-grams
Most studies have found that POS tag n-grams are a very useful feature for NLI (Koppel et al., 2005; Bykh and Meurers, 2012, for example). The tagset provided by the Penn TreeBank is the most widely used in these experiments, with tagging performed by the Stanford Tagger (Toutanova et al., 2003).
We investigate the effect of tagset granularity on classification accuracy by comparing the clas-sification accuracy of texts tagged with the PTB tagset against those annotated by the RASP Tagger (Briscoe et al., 2006). The PTB POS tagset contains 36 unique tags, while the RASP system uses a subset of the CLAWS2 tagset, consisting of 150 tags.
This is a significant size difference and we hy-pothesize that a larger tagset could provide richer levels of syntactically meaningful info which is more fine-grained in distinction between syntactic categories and contains more morpho-syntactic in-formation such as gender, number, person, case and tense. For example, while the PTB tagset has four tags for pronouns (PRP, PRP$, WP, WP$), the CLAWS tagset provides over 20 pronoun tags (PPHO1, PPIS1, PPX2, PPY, etc.) dis-tinguishing between person, number and grammati-cal role. Consequently, these tags could help better capture error patterns to be used for classification.
3.3 Syntactic Features
Adaptor grammar collocations Drawing on Wong et al. (2012), we also utilise an adaptor gram-mar to discover arbitrary lengths of n-gram collo-cations for the TOEFL11 corpus. We explore both the pure part-of-speech (POS) n-grams as well as the more promising mixtures of POS and function words. Following a similar experimental setup as per Wong et al. (2012), we derive two adaptor
gram-mars where each is associated with a different set of vocabulary: either pure POS or the mixture of POS and function words. We use the grammar proposed by Johnson (2010) for capturing topical collocations as presented below:
Sentence→Docj j ∈1, . . . , m
Docj → j j ∈1, . . . , m
Docj →Docj T opici i∈1, . . . , t;
j ∈1, . . . , m T opici →W ords i∈1, . . . , t
W ords→W ord
W ords→W ords W ord
W ord→w w∈Vpos;
w∈Vpos+f w
As per Wong et al. (2012), Vpos contains 119
distinct POS tags based on the Brown tagset and Vpos+f w is extended with 398 function words used
in Wong and Dras (2011). The number of topicst is set to50(instead of25as per Wong et al. (2012)) given that the TOEFL corpus is larger than the ICLE corpus. The inference algorithm for the adaptor grammars are based on the Markov Chain Monte Carlo technique made available by Johnson (2010).3
Tree Subtitution Grammar fragments In rela-tion to the context-free grammar (CFG) rules ex-plored in the previous NLI work of Wong and Dras (2011), Tree Substitution Grammar (TSG) frag-ments have been proposed by Swanson and Char-niak (2012) as another form of syntactic features for NLI classification tasks. Here, as an approxi-mation to deploying the Bayesian approach to in-duce a TSG (Post and Gildea, 2009; Swanson and Charniak, 2012), we first parse each of the essays in the TOEFL training corpus with the Stanford Parser (version 2.0.4) (Klein and Manning, 2003) to obtain the parse trees. We then extract the TSG fragments from the parse trees using the TSG system made available by Post and Gildea (2009).4
Stanford dependencies In Tetreault et al. (2012), Stanford dependencies were investigated as yet an-other form of syntactic features. We follow a similar approach: for each essay in the train-ing corpus, we extract all the basic (rather than
3
http://web.science.mq.edu.au/˜mjohnson/ Software.htm
the collapsed) dependencies returned by the Stan-ford Parser (de Marneffe et al., 2006). Simi-larly, we generate all the variations for each of the dependencies (grammatical relations) by sub-stituting each lemma with its corresponding PoS tag. For instance, a grammatical relation of
det(knowledge, the) yields the following variations: det(NN, the), det(knowledge, DT), anddet(NN, DT).
4 Experiments and Results
We report our results using 10-fold cross-validation on the combined training and development sets, as well as by training a model using the training and development data and running it on the test set.
We note that for our submission, we trained only on the training data; the results here thus differ from the official ones.
4.1 Individual Feature Results and Analysis
We ran the classifiers generated for each feature type to assess their performance. The results are summa-rized in Table 1: the Train + Dev Set results were for the system when trained on the training and develop-ment data with 10 fold cross-validation, and the Test Set results for the system trained on the training and development data combined.
Charactern-grams are an informative feature and our results are very similar to those reported by pre-vious researchers (Tsur and Rappoport, 2007). In particular, it should be noted that the use of punc-tuation is a very powerful feature for distinguishing languages. Romance language speakers were most likely to use more punctuation symbols (colons, semicolons, ellipsis, parenthesis, etc.) and at higher rates. Chinese, Japanese and Korean speakers were far less likely to use punctuation.
The performance for word n-grams, TSG frag-ments and Stanford Dependencies is very strong and comparable to previously reported research. For the adaptor grammarn-grams, the mixed POS/function word version yielded best results and was included in the ensemble.
4.2 POS-based Classification and Tagset Size
To compare the tagsets we trained individual classi-fiers forn-grams of size 1–4 using both tagsets and tested them. The results are shown in Table 2 and
Feature Train + Dev Set
Test Set
Chance Baseline 9.1 9.1
Character unigram 33.99 34.70
Character bigram 51.64 49.80
Character trigram 66.43 66.70
RASP POS unigram 43.76 45.10
RASP POS bigram 58.93 61.60
RASP POS trigram 59.39 62.70
Function word unigram 51.38 54.00
Function word bigram 59.73 63.00
Word unigram 74.61 75.50
Word bigram 74.46 76.00
Word trigram 63.60 65.00
TSG Fragments 72.16 72.70
Stanford Dependencies 73.78 75.90
Adaptor Grammar POS/FWn-grams
[image:5.612.313.540.58.371.2]69.76 70.00
Table 1: Classification results for our individual features.
N PTB RASP
1 34.03 43.76
2 48.85 58.93
3 51.06 59.39
[image:5.612.379.475.414.505.2]4 49.85 52.81
Table 2: Classification accuracy results for POS n-grams of size N using both the PTB and RASP tagset. The larger RASP tagset performed significantly better for all N.
N Accuracy
1 51.38
2 59.73
3 52.14
[image:5.612.388.466.575.648.2]Ensemble Train + Dev Set
Test Set
Complete Ensemble 81.50 81.60
Only binary values 82.46 83.10
Only freq values 65.28 67.20
L1-regularized solver only 80.33 81.10
L2-regularized solver only 81.42 81.10
Bin, L1-regularized only 81.57 82.00
[image:6.612.75.299.56.209.2]Bin, L2-regularized only 82.00 82.50
Table 4: Classification results for our ensembles, best re-sult in column in bold (binary values with L1- and L2-regularized solvers).
show that the RASP tagged data provided better per-formance in all cases. While it is possible that these differences could be attributed to other factors such as tagging accuracy, we do not believe this to be the case as the Stanford Tagger is known for its high ac-curacy (97%). These differences are quite clear; this finding also has implications for other syntactic fea-tures that make use of POS tags, such as Adaptor Grammars, Stanford Dependencies and Tree Substi-tution Grammars.
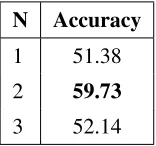
4.3 Function Wordn-grams
The classification results using our proposed Func-tion Word n-gram feature are shown in Table 3. They show that function word skip-grams are more informative than the simple function word counts that have been previously used.
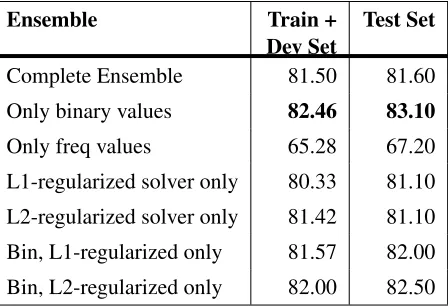
4.4 Ensemble Results
Table 4 shows the results from our ensembles. The feature types included in the ensemble are those whose results are listed individually in Table 1. (So, for example, we only use the RASP-tagged PoS n-grams, not the Penn Treebank ones.) The complete ensemble consists of four classifiers per feature type: L1-/L2-regularized versions with both binary and freq. values.
Bagging Our experiments with bagging did not find any improvements in accuracy, even with larger numbers of bootstrap samples (50 or more). Bag-ging is said to be more suitable for unstable
clas-sifiers which have greater variability in their perfor-mance and are more susceptible to noise in the train-ing data (Breiman, 1996). In our experiments with individual feature types we have found the classi-fiers to be quite stable in their performance, across different folds and training set sizes. This is one po-tential reason why bagging did not yield significant improvements.
Combiner Methods Of the methods outlined in §2.3 we found the sum and weighted sum combiners to be the best performing, but the weighted results did not improve accuracy in general over their un-weighted counterparts. Our results are reported us-ing the unweighted sum combiner. A detailed com-parison of the results for the combiners has been omitted here due to time constraints; the differences across all combination methods was roughly 1–2%. Any new approach to ensemble combination meth-ods would consequently want to be radically differ-ent to expect a notable improvemdiffer-ent in performance. As noted at the start of this section, results here are for the system trained on training and develop-ment data. The best result on the test set (83.1%) is almost 4% higher than our submission result, and close to the highest result achieved (83.6%).
Binary & Frequency-Based Feature Values Our results are consistent with those of Brooke and Hirst (2012), who conclude that there is a preference for binary feature values instead of frequency-based ones. Including both types in the ensemble did not improve results.
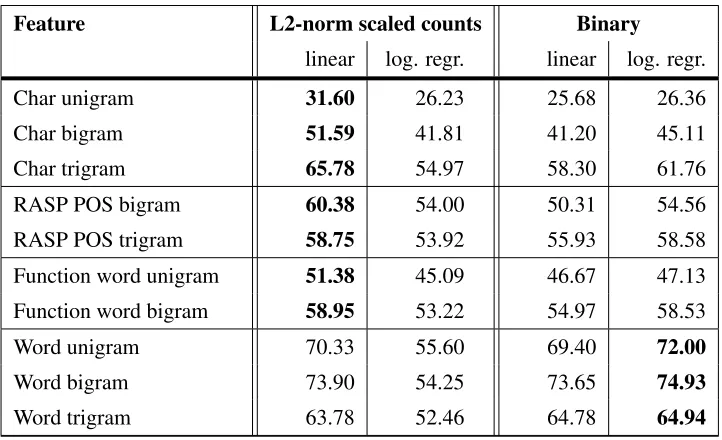
However, in other experiments on the TOEFL11 corpus we have also observed that use of frequency information often leads to significantly better results when using a linear SVM classifier: in fact, the lin-ear classifier is better on all frequency feature types, and also on some of the binary feature types. We present results in Table 5 comparing the two. An ap-proach using the linear SVM that provides an asso-ciated probability score — perhaps through bagging — allowing it to be combined with the methods de-scribed in§2.3 could then perhaps boost results. All these results were from a system using the training data with 10 fold cross-validation.
in-Feature L2-norm scaled counts Binary
linear log. regr. linear log. regr.
Char unigram 31.60 26.23 25.68 26.36
Char bigram 51.59 41.81 41.20 45.11
Char trigram 65.78 54.97 58.30 61.76
RASP POS bigram 60.38 54.00 50.31 54.56
RASP POS trigram 58.75 53.92 55.93 58.58
Function word unigram 51.38 45.09 46.67 47.13
Function word bigram 58.95 53.22 54.97 58.53
Word unigram 70.33 55.60 69.40 72.00
Word bigram 73.90 54.25 73.65 74.93
[image:7.612.126.487.53.273.2]Word trigram 63.78 52.46 64.78 64.94
Table 5: Classification results for our individual features.
crease in accuracy. Ensembles with either the L1 or L2-regularized solver have lower accuracy than the combined methods (row 2).
4.5 Proficiency-level Based Classification
Table 6 shows our results for training models with texts of a given proficiency level and the accuracy on the test set. The numbers show that in general texts should be classified with a learner trained with texts of a similar proficiency. They also show that not all texts in a proficiency level are of uniform quality as some levels perform better with data from the clos-est neighbouring levels (e.g. Medium texts perform best with data from all proficiencies), suggesting that the three levels form a larger proficiency con-tinuum where users may fall in the higher or lower ends of a level. A larger scale with more than three levels could help address this.
5 Discussion
5.1 Unused Experimental Features
We also experimented with some other feature types that were not included in the final system.
CCG SuperTag n-grams In order to introduce additional rich syntactic information into our sys-tem, we investigated the use CCG SuperTags as fea-ture for NLI classification. We used the C&C CCG
[image:7.612.317.535.313.438.2]Train Test Acc. Train Test Acc. Low Low 52.2 All Med 86.8 Med Low 72.1 M + H Med 85.3 High Low 40.3 L + M Med 83.8 All Low 75.2 Low High 16.1 L + M Low 76.0 Med High 68.1 Low Med 40.7 High High 65.7 Med Med 83.6 M + H High 74.7 High Med 62.1 All High 75.2
Table 6: Results for classifying the test set documents using classifiers trained with a specific proficiency level. Each level’s best result in bold.
Parser and SuperTagger (Curran et al., 2007) to ex-tract SuperTagn-grams from the corpus, which were then used as features to construct classifiers. The best results were achieved by usingn-grams of size 2–4, which achieved classification rates of around 44%. However, adding these features to our ensem-ble did not improve the overall system accuracy. We believe that this is because when coupled with the other syntactic features in the system, the informa-tion provided by the SuperTags is redundant, and thus they were excluded from our final ensemble.
twice, respectively, in a complete text. In practice, these features are a subset of our Word Unigram feature, whereHapax Legomena correspond to un-igrams with an occurrence count of 1 andHapax dis legomenaare unigrams with a count of 2.
In our experimental results we found that Ha-pax Legomenaalone provides an accuracy of 61%. Combining the two features together yields an accu-racy of 67%. This is an interesting finding as both of these features alone provide an accuracy close to the whole set of word unigrams.
5.2 Corpus Representativeness
We conducted a brief analysis of our extracted fea-tures, looking at the most predictive ones according to their Information Gain. Although we did not find any obvious indicators of topic bias, we noted some other issues of potential concern.
Chinese, Japanese and Korean speakers make ex-cessive use of phrases such asHowever,First of all andSecondly. At first glance, the usage rate of these phrases seems unnaturally high (more than 50% of Korean texts had a sentence beginning with How-ever). This could perhaps be a cohort effect relat-ing to those individually attemptrelat-ing this particular TOEFL exam, rather than an L1 effect: it would be useful to know how much variability there is in terms of where candidates come from.
It was also noticed that many writers mention the name of their country in their texts, and this could potentially create a high correlation between those words and the language class label, leading perhaps to an artificial boosting of results. For example, the wordsIndia,Turkey,Japan,KoreaandGermany ap-pear with high frequency in the texts of their corre-sponding L1 speakers — hundreds of times, in fact, in contrast to frequencies in the single figures for speakers of other L1s. These might also be an arte-fact of the type of text, rather than related to the L1 as such.
5.3 Hindi vs. Telugu
We single out here this language pair because of the high level of confusion between the two classes. Looking at the results obtained by other teams, we observe that this language pair provided the worst classification accuracy for almost all teams. No system was able to achieve an accuracy of 80%
for Hindi (something many achieved for other lan-guages). In analysing the actual and predicted classes for all documents classified as Hindi and Telugu by our system, we find that generally all of the actual Hindi and Telugu texts (96% and 99%, respectively) are within the set. Our classifier is clearly having difficulty discriminating between these two specific classes.
Given this, we posit that the confounding influ-ence may have more to do with the particular style of English that is spoken and taught within the country, rather than the specific L1 itself. Consult-ing other research about SLA differences in multi-lingual countries could shed further light on this.
Analysing highly informative features provides some clues about the influence of a common cul-ture or national identity: in our classifier, the words India, Indianand Hindu were highly predictive of both Hindi and Telugu texts, but no other lan-guages. In addition, there were terms that were not geographically- or culturally-specific that were strongly associated with both Hindi and Telugu: these included hence, thus, and etc, and a much higher rate of use of male pronouns. It has been observed in a number of places (Sanyal, 2007, for example) that the English spoken across India still retains characteristics of the English that was spo-ken during the time of the Raj and the East India Company that have disappeared from other varities of English, so that it can sound more formal to other speakers, or retain traces of an archaic business cor-respondence style; the features just noted would fit that pattern. The effect is likely to occur regardless of the L1.
Looking at individual language pairs in this way could lead to incremental improvement in the overall classification accuracy of NLI systems.
References
Leo Breiman. 1996. Bagging predictors. InMachine Learning, pages 123–140.
Ted Briscoe, John Carroll, and Rebecca Watson. 2006. The second release of the rasp system. InProceedings of the COLING/ACL on Interactive presentation ses-sions, COLING-ACL ’06, pages 77–80, Stroudsburg, PA, USA. Association for Computational Linguistics. Julian Brooke and Graeme Hirst. 2011. Native language
of Learner Corpus Research (LCR2011), Louvain-la-Neuve, Belgium. Presses universitaires de Louvain.
Julian Brooke and Graeme Hirst. 2012. Robust, Lexical-ized Native Language Identification. InProceedings of COLING 2012, pages 391–408, Mumbai, India, De-cember. The COLING 2012 Organizing Committee.
Serhiy Bykh and Detmar Meurers. 2012. Native Lan-guage Identification using Recurring n-grams – In-vestigating Abstraction and Domain Dependence. In
Proceedings of COLING 2012, pages 425–440, Mum-bai, India, December. The COLING 2012 Organizing Committee.
James Curran, Stephen Clark, and Johan Bos. 2007. Linguistically motivated large-scale nlp with c&c and boxer. InProceedings of the 45th Annual Meeting of the Association for Computational Linguistics Com-panion Volume Proceedings of the Demo and Poster Sessions, pages 33–36, Prague, Czech Republic, June. Association for Computational Linguistics.
Marie-Catherine de Marneffe, Bill Maccartney, and Christopher D. Manning. 2006. Generating typed de-pendency parses from phrase structure parses. In Pro-ceedings of the Fifth International Conference on Lan-guage Resources and Evaluation (LREC’06), pages 449–454, Genoa, Italy.
Markus Dickinson and W. Detmar Meurers. 2003. De-tecting errors in part-of-speech annotation. In Pro-ceedings of the 10th Conference of the European Chapter of the Association for Computational Linguis-tics (EACL-03), pages 107–114, Budapest, Hungary.
Thomas G Dietterich. 2000. Ensemble methods in ma-chine learning. InMultiple classifier systems, pages 1–15. Springer.
Rong-En Fan, Kai-Wei Chang, Cho-Jui Hsieh, Xiang-Rui Wang, and Chih-Jen Lin. 2008. LIBLINEAR: A li-brary for large linear classification. Journal of Ma-chine Learning Research, 9:1871–1874.
David Guthrie, Ben Allison, Wei Liu, Louise Guthrie, and Yorick Wilks. 2006. A Close Look at Skip-gram Modelling. InProceedings of the Fifth International Conference on Language Resources and Evaluation (LREC 2006), pages 1222–1225, Genoa, Italy.
Tin Kam Ho, Jonathan J. Hull, and Sargur N. Srihari. 1994. Decision combination in multiple classifier systems. Pattern Analysis and Machine Intelligence, IEEE Transactions on, 16(1):66–75.
Mark Johnson. 2010. Pcfgs, topic models, adaptor gram-mars and learning topical collocations and the struc-ture of proper names. In Proceedings of the 48th Annual Meeting of the Association for Computational Linguistics, pages 1148–1157, Uppsala, Sweden, July. Association for Computational Linguistics.
Dan Klein and Christopher D. Manning. 2003. Accurate unlexicalized parsing. InProceedings of the 41st An-nual Meeting on Association for Computational Lin-guistics - Volume 1, ACL ’03, pages 423–430, Sap-poro, Japan. Association for Computational Linguis-tics.
Ekaterina Kochmar. 2011. Identification of a writer’s na-tive language by error analysis. Master’s thesis, Uni-versity of Cambridge.
Moshe Koppel, Jonathan Schler, and Kfir Zigdon. 2005. Automatically determining an anonymous author’s na-tive language. Intelligence and Security Informatics, pages 41–76.
Moshe Koppel, Jonathan Schler, and Shlomo Argamon. 2009. Computational Methods in Authorship Attribu-tion. Journal of the American Society for Information Science and Technology, 60(1):9–26.
Robert Lado. 1957. Linguistics Across Cultures: Ap-plied Linguistics for Language Teachers. University of Michigan Press, Ann Arbor, MI, US.
Lourdes Ortega. 2009.Understanding Second Language Acquisition. Hodder Education, Oxford, UK.
Robi Polikar. 2006. Ensemble based systems in deci-sion making. Circuits and Systems Magazine, IEEE, 6(3):21–45.
Matt Post and Daniel Gildea. 2009. Bayesian learn-ing of a tree substitution grammar. In Proceedings of the ACL-IJCNLP 2009 Conference Short Papers, ACLShort ’09, pages 45–48, Suntec, Singapore. As-sociation for Computational Linguistics.
Jyoti Sanyal. 2007. Indlish: The Book for Every English-Speaking Indian. Viva Books Private Limited. Benjamin Swanson and Eugene Charniak. 2012.
Na-tive Language Detection with Tree Substitution Gram-mars. InProceedings of the 50th Annual Meeting of the Association for Computational Linguistics (Vol-ume 2: Short Papers), pages 193–197, Jeju Island, Ko-rea, July. Association for Computational Linguistics. Joel Tetreault, Daniel Blanchard, Aoife Cahill, and
Mar-tin Chodorow. 2012. Native tongues, lost and found: Resources and empirical evaluations in native language identification. In Proceedings of COLING 2012, pages 2585–2602, Mumbai, India, December. The COLING 2012 Organizing Committee.
Kristina Toutanova, Dan Klein, Christopher D. Manning, and Yoram Singer. 2003. Feature-rich part-of-speech tagging with a cyclic dependency network. InIN PRO-CEEDINGS OF HLT-NAACL, pages 252–259. Oren Tsur and Ari Rappoport. 2007. Using Classifier
Prague, Czech Republic, June. Association for Com-putational Linguistics.
Sze-Meng Jojo Wong and Mark Dras. 2011. Exploiting Parse Structures for Native Language Identification. In Proceedings of the 2011 Conference on Empiri-cal Methods in Natural Language Processing, pages 1600–1610, Edinburgh, Scotland, UK., July. Associa-tion for ComputaAssocia-tional Linguistics.