ORIGINAL RESEARCH
SPINE
Pulse-Triggered DTI Sequence with Reduced FOV and Coronal
Acquisition at 3T for the Assessment of the Cervical
Spinal Cord in Patients with Myelitis
J. Hodel, P. Besson, O. Outteryck, H. Ze´phir, D. Ducreux, A. Monnet, D. Che´chin, M. Zins, M. Rodallec, J.P. Pruvo, P. Vermersch, and X. Leclerc
EBM 2
ABSTRACT
BACKGROUND AND PURPOSE: DTI is a promising technique for imaging of the spinal cord, but the technique has susceptibility-induced artifacts. We evaluated a pulse-triggered DTI sequence with an rFOV technique and coronal acquisition for the assessment of the cervical spinal cord in patients with myelitis at 3T.
MATERIALS AND METHODS: A rFOV acquisition was established by a noncoplanar application of the excitation and the refocusing pulse in conjunction with outer volume suppression. The DTI sequence was performed in the coronal plane in 12 healthy volunteers and 40 consecutive patients with myelitis. Probabilistic tractography of the posterior and lateral funiculi was performed from the C1 to C7 levels. FA, MD, aD, rD, and ratios of aD and rD were measured.
RESULTS:In healthy volunteers, mean DTI indices within the whole-fiber pathways were the following: FA⫽0.61, MD⫽1.17⫻10⫺3mm2/s, aD⫽1.96⫻10⫺3mm2/s, rD⫽0.77⫻10⫺3mm2/s, and ratios of aD and rD⫽2.5. Comparison of healthy controls and patients with myelitis identified statistically significant differences for all DTI parameters. Different patterns of myelitis, including spinal cord atrophy and active inflammatory lesions, were recognized. There was a significant correlation between clinical severity and DTI parameters.
CONCLUSIONS: The present work introduces a new approach for DTI of the cervical spinal cord at 3T, enabling a quantitative follow-up of patients with myelitis.
ABBREVIATIONS:aD⫽axial diffusivity; FA⫽fractional anisotropy; HC⫽healthy controls; MD⫽mean diffusivity; rD⫽radial diffusivity; rFOV⫽reduced FOV
S
everal inflammatory diseases, such as MS, neuromyelitis op-tica, or autoimmune diseases, may involve the spinal cord. Clinical disability is partly dependent on spinal cord lesions. Sev-eral studies reported the value of DTI for imaging the spinal cord at 1.5T,1-5particularly for the diagnosis of myelitis.6-9DTIpa-rameters such as FA, MD, aD, and rD may help to distinguish myelin repair from axonal loss10or improve the detection of
oc-cult spinal cord pathology.6,8,11However, a quantitative and
reli-able DTI is required for patients with myelitis scanned at 3T. Most of the previous studies used single-shot EPI to achieve DTI due to its high signal-to-noise ratio and its insensitivity to
motion-related artifacts. However, DTI of the spinal cord remains challeng-ing.12,13Indeed, single-shot EPI is prone to distortions due to B0
inhomogeneities, particularly at 3T. Distortions are related to a long echo-planar readout train leading to phase-error accumulation. In this study, we evaluated a rFOV technique, which includes both outer volume suppression and inner volume excitation.14,15Such a
tech-nique is particularly suitable for the imaging of patients with myelitis because the spinal cord size allows ample truncation of the FOV in at least 1 dimension. Reducing the FOV in the phase-encoding direc-tion leads to a drastic shortening of the EPI readout with reduced susceptibility-related artifacts.
No study has yet evaluated rFOV DTI in patients with MS at 3T, to our knowledge. The aim of this study was to evaluate a pulse-triggered DTI sequence acquired in the coronal plane with a rFOV technique for the tractography-based measurements of diffusion in-dices over the cervical spinal cord in patients with myelitis at 3T.
MATERIALS AND METHODS
Patients and VolunteersTwelve volunteers participated in this study, which was approved by the local ethics committee review board. From April to
Sep-Received March 27, 2012; accepted after revision June 12.
From the Departments of Neuroradiology (J.H., P.B., A.M., J.P.P., X.L.) and Neurology (O.O., H.Z., P.V.), CHU Salengro, Lille, France; Department of Radiology (J.H., M.Z., M.R.), Hoˆpital Saint Joseph, Paris, France; Department of Neuroradiology (D.D.), CHU Biceˆtre, Le Kremlin-Biceˆtre, France; and Philips Medical Systems (D.C.), Suresnes, France.
Please address correspondence to Je´roˆme Hodel, MD, Department of Radiology, Hoˆpital Saint Joseph, 185 Rue Raymond Losserand, Paris 75014, France; e-mail: [email protected]
EBM
tember 2011, we recruited 40 patients with inflammatory diseases potentially affecting the spinal cord. Twenty-five patients pre-sented with MS (15 relapsing-remitting, 5 secondary-progressive, and 5 primary progressive forms), and 15 patients presented with another cause of inflammatory myelopathy (11 neuromyelitis op-tica, 1 sarcoidosis, 1 Gougerot-Sjo¨gren syndrome, 2 idiopathic). All patients underwent a complete clinical evaluation at the time of MR imaging. For each patient, 1 neurologist (O.O.) established an Expanded Disability Status Scale score (varying from 0 to 10)16
and reported a Pyramidal Functional Score of 0 – 6 and a Sensory Functional Score of 0 – 6, mainly affected by spinal cord involve-ment. Six patients presented with a clinical relapse at the time of the study.
MR Imaging
Imaging was performed with the patient in the supine position on a 3T scanner (Achieva; Philips Medical Systems, Best, the Neth-erlands). A head and neck neurovascular coil (phased array coil with 16 elements) was used to scan the spinal cord of each subject. Acquisitions of healthy volunteers and patients were interleaved and obtained on the same dates.
Before starting the present study, we first optimized the DTI sequence. We tested several parameters including gating, b-value, FOV, sensitivity encoding imaging, and acquisition plane. We changed each parameter separately and assessed the image qual-ity. In agreement with a previous study,17we found significant
distortions when using the standard DTI sequence compared with rFOV DTI, but we did not attempt to compare both techniques due to the long scanning time.
Indeed in this study, the DTI sequence was performed with a reduced-FOV technique. This technique, previously described,14
is a single-shot EPI that uses a noncoplanar application of the excitation and the refocusing pulses. By adjusting the tilt angle, this approach allows FOV reduction (and then EPI readout train) and multiple-section imaging in a time-effective way.14 This
method is combined with outer volume suppression, which is performed by using a spatially selective pulse applied before the section excitation. Outer volume suppression suppresses signals coming from outside the reduced FOV to ensure that the acqui-sition is performed only in this reduced FOV.14,15In this study,
the DTI sequence was performed in the coronal plane with the phase-encoding direction oriented right to left to limit suscepti-bility artifacts related to bones and lungs. We obtained a reduced FOV in the phase-encoding direction with the following FOV dimensions: right/left⫽42 mm and feet/head⫽170 mm, leading to a reduced EPI readout train with 35 phase-encoding lines. The acquired matrix was 96⫻23, leading to a voxel size of 1.77⫻ 1.84⫻2.5 mm, whereas the reconstructed matrix was 160, lead-ing to a reconstructed voxel size of 1.06⫻1.06⫻2.5 mm. The image acquisition parameters were as follows: 15 directions with
b⫽600, TE⫽38.7 ms, section thickness⫽2.5 mm, partial Fourier acquisition with half-scan factor⫽0.6, number of signal aver-ages⫽3, flip angle⫽90°, flow compensation. Pulse triggering was done by using a finger sensor with TR beats⫽3 (mean TR⫽ 3000 ms); each section group was triggered to reduce motion artifacts. A frequency-selective fat saturation was used to suppress the fat signal (spectral presaturation with inversion recovery). The
whole spinal cord was scanned in all cases by using 11 contiguous sections without spacing in the coronal plane. To improve mag-netic field homogeneity, we performed a localized MR shimming on the cervical spinal cord. We did not use sensitivity encoding imaging associated with the rFOV technique to avoid inhomoge-neous noise amplification due to the g-factor penalty.
The mean acquisition time of the optimized DTI sequence was 7 minutes 30 seconds according to the heart rate. There were no changes in the MR imaging hardware/software during the entire study (52 MR imaging examinations).
Sagittal (turbo spin-echo, TE⫽80 ms; TR⫽3465 ms; section thickness⫽3 mm; frequency-selective fat saturation spectral-attenuated inversion recovery) and axial (fast-field echo, TE⫽6.9
ms; TR⫽683 ms; section thickness ⫽3.5 mm) T2-weighted
acquisitions of the spinal cord were obtained in all subjects. In addition, sagittal T1-weighted acquisitions (turbo spin-echo,
TE⫽7.5 ms; TR⫽530 ms; section thickness⫽3 mm) were
obtained in patients with and without gadolinium enhancement. The total acquisition lasted 17 minutes in volunteers and 25 minutes in patients.
Image Analysis
T1- and T2-Weighted Imaging. One neuroradiologist (J.H.) analyzed all images. On the basis of T1- and T2-weighted images, the reader assessed the occurrence of spinal cord T2 hyperinten-sities, spinal cord atrophy, and gadolinium enhancement.
DTI Image Quality. Image quality was qualitatively evaluated in consensus by 2 readers (M.R. and X.L.) for both healthy volun-teers and patients. The occurrence of abnormal fiber-bundle de-viation or interruption related to susceptibility artifacts was ana-lyzed by viewing the tracts registered on T2-weighted acquisitions in 3D mode.
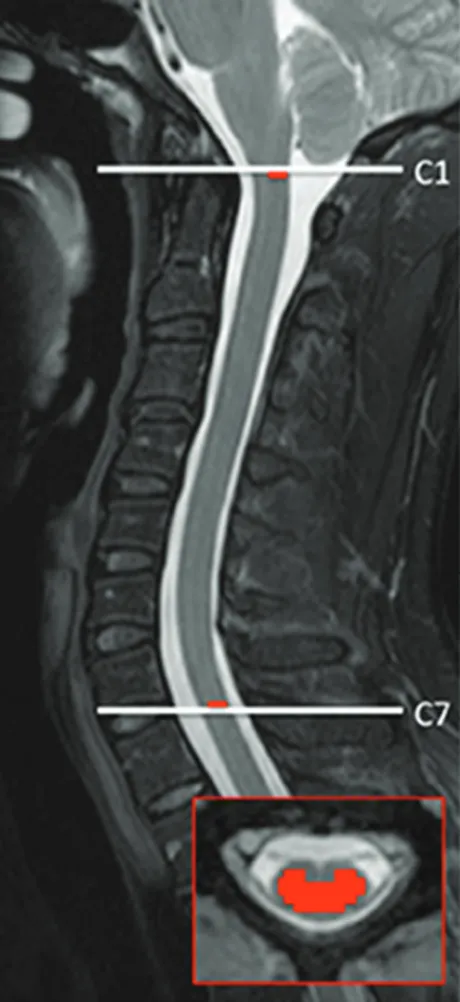
Tractography. Motion-related misalignment of the diffusion tensor MR images was corrected by using the available Automated Image Registration software. Data were converted to the NIfTI format by using the Dcm2nii software (http://www.mccaus landcenter.sc.edu/mricro/mricron/dcm2nii.html). One neurora-diologist (J.H.) drew ROIs as seed masks and termination masks by using the MD images in the axial plane at the C1 and C7 levels. ROIs are described in Fig 1. Axial T2-weighted images were reg-istered on MD images to improve the delineation of ROIs. There was a consistent sparing of the outer margin of the cervical cord to minimize volume averaging with the CSF. Probabilistic tractography was performed for each subject by using FMRIB Diffusion Toolbox software (http://www.fmrib.ox.ac.uk/fsl/ fdt/index.html).18,19Due to the termination masks, the pathways
did not extend beyond the C1 or C7 levels. One tract including posterior and lateral cord funiculi was then obtained for each subject.
Statistical Analysis
Statistical analysis was performed (O.O.) with the SPSS software, Version 13.0 (SPSS, Chicago, Illinois). Normality of variable dis-tribution was tested by the Shapiro-Wilk test. If a variable was normally distributed, we applied the Studentttest to compare means and the Pearson correlation test to measure the strength of association between different parameters. If a variable was not normally distributed, we applied the corresponding nonparamet-ric tests: Mann-WhitneyUtest and Spearman correlation test. To
control for multiple comparisons, we applied a Bonferroni correction.
RESULTS
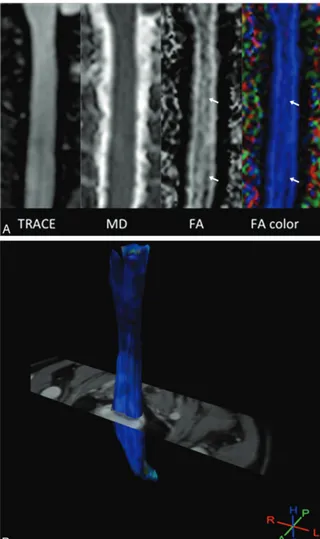
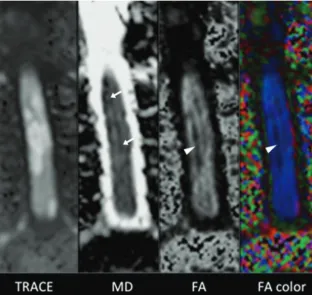
Image QualityIn all subjects, the fiber pathways matched their expected anatomic location on registered T2-weighted images. There was no abnormal fiber-bundle interruption reported. DTI parametric maps and trac-tography of a healthy volunteer are shown in Fig 2. DTI parametric maps of a patient with active lesions are shown in Fig 3.
Clinical Data and Conventional Imaging
Twelve HC and 40 patients were recruited. Cervical spinal cord MR imaging did not show any cervical lesions in 2 patients with MS and 3 patients with neuromyelitis optica. These 2 patients with MS did not present with any clinical signs of spinal cord involvement, but among the 3 patients with neuromyelitis optica, 1 had already presented with extended cervical myelitis and the 2 others had already presented with extended thoracic myelitis. All the other patients presented with at least 1 cervical lesion. Among the total cohort, 6 patients presented with a clinical relapse at the time of MR imaging, and cervical spinal cord MR imaging showed at least 1 gadolinium-enhanced lesion (5 with MS and 1 with myelitis).
DTI Values and Statistical Analysis
Mean DTI values are shown in Table 1 for patients and healthy volunteers. Comparison of HC with the total cohort and all sub-groups identified statistically significant differences for almost all DTI parameters as shown in Table 2. In active inflammatory le-sions, FA increased and MD decreased significantly compared with HC values. In the absence of active lesions and regardless of the pathology (MS or other), FA decreased and MD increased significantly.
Because the Expanded Disability Status Scale score depends on other clinical parameters such as cognitive, visual, and cerebellar impairment, we only correlated Pyramidal Functional Score and Sensory Functional Score with 2 relevant DTI parameters, FA and MD. No significant correlation was noted between age and DTI parameters in HC and in the whole cohort and subgroups of the cohort. In the total cohort (n⫽40), we did not observe any sig-nificant correlation between DTI parameters and clinical parameters.
Considering all patients (MS or other) without active lesions (n⫽34), we observed significant correlation between Sensory Functional Score and FA (r⫽ ⫺0.419,P⫽.014;P⫽.056 after Bonferroni correction). In the cohort of patients with MS without active lesions (n⫽20), we observed significant correlation be-tween Pyramidal Functional Score and FA (r⫽ ⫺0.487,P⫽.03;
P⫽.12 after Bonferroni correction). In the cohort of patients with other causes of myelitis (n⫽14), we observed significant correlation between Pyramidal Functional Score and MD (r⫽ ⫺0.694,P⫽.006;P⫽.024 after Bonferroni correction). In the cohort of patients with active lesions, we did not observe any significant correlation between clinical parameters and DTI parameters.
In the cohort of patients with MS without active lesions, we
[image:3.594.54.284.48.549.2]observed that progressive forms of MS (secondary-progressive MS, primary-progressive MS, or both) had more minor FA and ratio values than in those with relapsing-remitting MS. We also observed that patients with progressive MS had higher MD
values and greater disability than those with relapsing-remitting MS (Table 3). Mean FA and ratio values were signifi-cantly (P ⫽.01 andP⫽ .047, respec-tively) lower in progressive MS (n⫽8)
than in relapsing-remitting MS (n ⫽
12). Mean MD values of progressive MS were not significantly higher than those in relapsing-remitting MS (P⫽.286).
DISCUSSION
In this study, we aimed to quantitatively assess the cervical cord damage in patients with myelitis by using DTI at 3T. Image blurring and susceptibility-related distor-tions are known limitadistor-tions of single-shot EPI DTI, mainly related to its long read-out time in the phase-encoding direction. Reduced FOV techniques allow the re-duction of susceptibility artifacts.20 In
this study, we used a rFOV technique that included both inner volume excitation and outer volume suppression. Reducing the FOV in the phase-encoding direction was particularly suitable for imaging of the spinal cord and led to a drastic short-ening of the EPI readout train length. In our study, the EPI readout train was shortened to 35 phase-encoding lines with a TE of 38.7 ms, explaining reduced distortions. With the aim of reducing mo-tion-related artifacts, we also performed a prospective gating.21,22
Region-of-interest measurements are commonly achieved for the quantitative assessment of the spinal cord with DTI, in healthy volunteers2and in patients with
MS9or spondylotic myelopathy.23In our
study, we performed tractography-based measurements of the DTI indices. Partial volume effects may be minimized with such an approach compared with the pos-sible inclusion of highly isotropic CSF in the ROIs. The intra- and interobserver agreement of both approaches was previ-ously evaluated24; they were low with
ROIs and excellent with tractography. We used the FMRIB Diffusion Toolbox18,19
to perform probabilistic tractography. In comparison with a tracking algorithm based on FA values, this approach may be more accurate considering the changes in terms of FA values observed in inflamma-tory lesions. The quantitative diffusion measures that we found are within the range of the previously reported values.7,24-30
Par-ticularly, our results are in agreement with previous studies that used tractography-based measurements of the DTI indices.24,30 FIG 2. A, Diffusion tensor images of a healthy volunteer (volunteer 1). Parametric maps obtained
[image:4.594.54.374.46.585.2]Hyperintensities of the spinal cord represent a broad spectrum of lesions, from reversible to more severe lesions. DTI parameters are more sensitive than T2 signal analysis in assessing patients with myelitis.9We observed lower FA and higher MD values in
patients with chronic myelitis, as previously reported.30Decrease
in the FA values may reflect the degree of microstructural disor-ganization of the spinal cord, suggesting either local extracellular edema or a smaller number of fibers matching a larger extracellu-lar space or both.9In addition, radial diffusivity may serve as a
marker of overall tissue integrity within chronic MS lesions.8We
also observed an increase in FA associated with a marked decrease in diffusivity values in patients with active lesions, a finding pre-viously suggested in active brain lesions.10Increased FA within
gadolinium-enhancing lesions may be related to the resolution of edema and the inflammatory infiltrates. Further studies are re-quired in a larger population of patients with different patterns of myelitis to confirm these results.
Extensive spinal cord lesions are more frequent in neuromy-elitis optica than in MS. Neuromyneuromy-elitis optica and MS are 2 auto-immune demyelinating diseases, but their physiopathology ex-tensively differs.31Thus, this observation could easily explain why
statistical differences concerning DTI parameter values were most likely observed when we compared HC with homogeneous sub-groups (ie, separating patients with and without acute lesions and patients with and without MS) rather than with our inhomoge-neous total cohort. Otherwise correlations between DTI
parame-ters and clinical parameparame-ters were also most likely observed within the sub-groups rather than in our total cohort.
Correlations between clinical and DTI parameters validated our approach. For some of the tested parameters, we ob-served only trends after applying the Bon-ferroni correction. By increasing the size of each group, we may find more and bet-ter correlations. However, in this study, we observed that both FA and the ratio of aD and rD were lower in progressive forms of MS. Indeed, patients with pro-gressive forms of MS were more disabled
than those with relapsing-remitting
MS: They had longer disease duration, higher Expanded Disability Status Scale scores, and also greater neuronal damage measured by brain and gray matter atro-phy.32Patients with primary-progressive
MS were also characterized by spinal cord atrophy.33Even if our different groups are
small, these findings suggest the validity of our technique.
Our study had some limitations. We used a DTI sequence with a b-value of 600 and 15 directions due to a compromise between image quality and time acquisi-tion. With such parameters, sensitivity to axial or lower diffusion fibers might be decreased and longitudinal fibers will dominate within the tracts obtained. However, this study was fo-cused on patients with myelitis for whom the longitudinal fibers of the spinal cord such as corticospinal or lemniscal funiculi are more frequently involved. Triggering each section may improve the image quality. However, to reduce the scanning time, we per-formed triggering on each section group with an interleaved ac-quisition order. Hand-drawn regions of interest were used to de-fine the seed masks. This approach may decrease the reproducibility of the DTI metrics because the number of voxels in the FOV may be small. This was especially challenging in the subjects with myelitis who had cord atrophy. However, to ap-proximate the known locations of the posterior and lateral col-umns, we drew ROIs on MD images registered with anatomic T2-weighted images.
Given the curvature of the spinal cord, signal differences could be observed at the outer margins of the cord due to partial volume averaging with CSF. However, when we defined seed ROIs, there was a consistent sparing of the outer margin of the cervical cord to minimize this bias. The values we reported were gray and white averaged FA values; however, spinal white matter fibers have a craniocaudal orientation and thus are very anisotropic, contrary to gray matter, which is more isotropic. We did not image the whole spinal cord. Indeed the cervical cord is easier to assess by MR imaging due to its larger size and decreased mobility com-pared with the thoracic cord.34We have calculated DTI metrics
along the entire tract from C1 to C7. With such an approach, the
[image:5.594.57.370.48.343.2]measure of DTI indices was potentially less sensitive in cases of limited lesions of the spinal cord due to the averaged values. How-ever, despite this shortcoming, findings showed that all patients with myelitis could be distinguished from healthy volunteers. Furthermore, histogram analysis of DTI indices may be provided to improve the sensitivity of the technique.
CONCLUSIONS
We showed that the pulse-triggered single-shot EPI DTI sequence with the rFOV technique was reliable for the routine assessment of quantitative DTI indices over the cervical spinal cord at 3T. The further finding that DTI indices were associated with disability scores suggested the clinical value of this approach for the man-agement of patients with myelitis.
Disclosures: Olivier Outteryck—UNRELATED:Payment for Lectures (including ser-vice on Speakers Bureaus): Biogen-Idec, Bayer, Sanofi,Travel/Accommodations/ Meeting Expenses Unrelated to Activities Listed: Bayer, Biogen-Idec, TEVA, Sanofi, Novartis, Merck-Serono. He´le`ne Ze´phir—UNRELATED:Board Membership: Biogen-Idec, Sanofi,Consultancy: Biogen-Idec, TEVA, Sanofi, Merck, Novartis, Bayer, Pay-ment for Lectures (including service on Speakers Bureaus): Biogen-Idec,* Bayer,*
Novartis,*Travel/Accommodations/Meeting Expenses Unrelated to Activities List-ed: Biogen-Idec,* Merck,* Novartis,* Bayer,* Sanofi,* Teva.* David Che´chin— UNRE-LATED:Employment: Philips Healthcare,Comments: I am employed by Philips Healthcare, and this work was done on a Philips 3T MRI system. I supported this work by installing, evaluating, and optimizing the sequences. Patrick Vermersch— UNRE-LATED:Board Membership: honoraria from Biogen-Idec, TEVA, Sanofi, Bayer, No-vartis, Almirall,Consultancy: honoraria from Biogenidec, TEVA, Sanofi, Bayer, No-vartis, GlaxoSmithKline,Payment for Development of Education Presentations: from GlaxoSmithKline, Almirall,Travel/Accommodations/Meeting Expenses Unre-lated to Activities Listed: travel expenses from Biogen-Idec, TEVA, Sanofi, Bayer, Novartis. *Money paid to the institution.
REFERENCES
1. Budzik JF, Balbi V, Le Thuc V, et al.Diffusion tensor imaging and fibre tracking in cervical spondylotic myelopathy. Eur Radiol
2011;21:426 –33
2. Ellingson BM, Ulmer JL, Kurpad SN, et al.Diffusion tensor MR im-aging of the neurologically intact human spinal cord.AJNR Am J Neuroradiol2008;29:1279 – 84
3. Ellingson BM, Ulmer JL, Kurpad SN, et al.Diffusion tensor MR im-aging in chronic spinal cord injury. AJNR Am J Neuroradiol
2008;29:1976 – 82
[image:6.594.53.535.55.196.2]4. Mohamed FB, Hunter LN, Barakat N, et al.Diffusion tensor imaging
Table 1: DTI parameters in healthy controls, the total cohort of patients with myelitis, and different subgroups
Healthy Controls
All Patients with or without Active Lesions
Patients without Active Lesions
Patients with Active Lesions Patients with MS
and Other Patientsa
Patients with MS
Other Patientsa
No. 12 40 34 20 14 6
Sex (F/M) 7:5 19:21 18:16 9:11 9:5 1:5
Age (yr) (mean) 31.6⫾9.1 43.3⫾12.0 43.6⫾11.8 40.5⫾13.0 48.0⫾7.5 41.5⫾14.7 FA (mean) 0.61⫾0.01 0.54⫾0.06 0.52⫾0.05 0.54⫾0.04 0.50⫾0.05 0.64⫾0.05 MD (10⫺3mm2/s) (mean) 1.17⫾0.07 1.30⫾0.28 1.38⫾0.22 1.40⫾0.20 1.34⫾0.25 0.84⫾0.13 E1⫽aD (10⫺3mm2/s) (mean) 1.96⫾0.10 2.02⫾0.36 2.12⫾0.28 2.17⫾0.25 2.04⫾0.32 1.45⫾0.17 E2 (10⫺3mm2/s) (mean) 0.92⫾0.05 1.10⫾0.27 1.18⫾0.22 1.18⫾0.20 1.18⫾0.25 0.68⫾0.12 E3 (10⫺3mm2/s) (mean) 0.63⫾0.06 0.77⫾0.24 0.83⫾0.19 0.84⫾0.17 0.82⫾0.23 0.39⫾0.13 rD (10⫺3mm2/s) (mean) 0.77⫾0.05 0.93⫾0.26 1.00⫾0.20 1.00⫾0.19 1.00⫾0.23 0.53⫾0.12 Ratiob(mean) 2.5⫾0.08 2.25⫾0.37 2.15⫾0.25 2.20⫾0.26 2.09⫾0.22 2.82⫾0.45 aPatients with myelitis with other causes of inflammatory myelopathy (neuromyelitis optica, sarcoidosis, Gougerot-Sjögren syndrome, idiopathic).
b
[image:6.594.56.534.242.340.2]Ratios of aD and rD.
Table 2: Comparison of DTI parameter values among HC, the total cohort of patients (including MS and other cause of inflammatory myelopathy), and different subgroups of patients
HC vs Total Cohort
Patients without Acute Cervical Lesions HC vs Patients with
Acute Cervical Lesions
HC vs (MS + Other) HC vs MS HC vs Other
FA (10⫺3mm2/s) P⫽.001a,b P⬍.0001a,b P⬍.0001a,b P⬍.0001a,b P⫽0.091 MD (10⫺3mm2/s) P⫽.131 P⫽.002a P⬍.0001a,b P⫽.025a P⬍.0001a,b
E1 (10⫺3mm2/s) P⫽.610 P⫽.075 P⫽.011a P⫽.432 P⬍.0001a,b
E2 (10⫺3mm2/s) P⫽.014a P⬍.0001a,b P⬍.0001a,b P⫽.005a P⬍.0001a,b E3 (10⫺3mm2/s) P⫽.056 P⬍.0001a,b P⬍.0001a,b P⫽.012a P⬍.0001a,b rD (10⫺3mm2/s) P⫽.040a P⬍.0001a,b P⬍.0001a,b P⫽.003a P⬍.0001a,b
Ratio P⬍.0001a,b P⬍.0001a,b P⬍.0001a,b P⫽.005a P⫽.291
a
SignificantPvalues.
bPvalues remaining significant (P⬍.05) after Bonferroni correction.
Table 3: Clinical and DTI parameters of patients with MS without active lesions
RRMS (n= 12) PPMS (n= 4) SPMS (n= 4) Progressive MS (n= 8)
EDSS (median关min;max兴) 3.0关0;8兴 6.75关4;8兴 6.5关6.5;7.5兴 6.5关4;8兴
Pyramidal FS (median关min;max兴)a 2关0;5兴 4关2;5兴 4关4;4兴 4关2;5兴
Sensory FS (median关min;max兴)a 2关0;3兴 3关1;4兴 3.5关3;4兴 3关1;4兴
FA (mean) 0.56⫾0.03 0.53⫾0.04 0.49⫾0.03 0.51⫾0.04
MD (10⫺3mm2/s) (mean) 1.36⫾0.15 1.40⫾0.26 1.52⫾0.25 1.46⫾0.25
Ratio (mean)b 2.29⫾0.26 2.13⫾0.20 1.99⫾0.18 2.06⫾0.19
Note:—min indicates minimum; max, maximum; FS, functional score; RRMS, relapsing-remitting MS; SPMS, secondary-progressive MS; PPMS, primary-progressive MS; EDSS, Expanded Disability Status Scale.
a 0 – 6. b
[image:6.594.52.534.378.452.2]of the pediatric spinal cord at 1.5T: preliminary results.AJNR Am J Neuroradiol2011;32:339 – 45
5. Shanmuganathan K, Gullapalli RP, Zhuo J, et al.Diffusion tensor MR imaging in cervical spine trauma.AJNR Am J Neuroradiol
2008;29:655–59
6. Freund P, Wheeler-Kingshott C, Jackson J, et al.Recovery after spi-nal cord relapse in multiple sclerosis is predicted by radial diffusiv-ity.Mult Scler2010;16:1193–202
7. Hesseltine SM, Law M, Babb J, et al.Diffusion tensor imaging in multiple sclerosis: assessment of regional differences in the axial plane within normal-appearing cervical spinal cord.AJNR Am J Neuroradiol2006;27:1189 –93
8. Klawiter EC, Schmidt RE, Trinkaus K, et al.Radial diffusivity pre-dicts demyelination in ex vivo multiple sclerosis spinal cords. Neu-roimage2011;55:1454 – 60
9. Renoux J, Facon D, Fillard P, et al.MR diffusion tensor imaging and fiber tracking in inflammatory diseases of the spinal cord.AJNR Am J Neuroradiol2006;27:1947–51
10. Fox RJ, Cronin T, Lin J, et al.Measuring myelin repair and axonal loss with diffusion tensor imaging. AJNR Am J Neuroradiol
2011;32:85–91
11. Farzaneh F, Riederer SJ, Pelc NJ.Analysis of T2 limitations and off-resonance effects on spatial resolution and artifacts in echo-planar imaging.Magn Reson Med1990;14:123–39
12. Bammer R, Augustin M, Prokesch RW, et al.Diffusion-weighted imaging of the spinal cord: interleaved echo-planar imaging is su-perior to fast spin-echo.J Magn Reson Imaging2002;15:364 –73 13. Melhem ER.Technical challenges in MR imaging of the cervical
spine and cord.Magn Reson Imaging Clin N Am2000;8:435–52 14. Wilm BJ, Gamper U, Henning A, et al.Diffusion-weighted imaging
of the entire spinal cord.NMR Biomed2009;22:174 – 81
15. Wilm BJ, Svensson J, Henning A, et al.Reduced field-of-view MRI using outer volume suppression for spinal cord diffusion imaging.
Magn Reson Med2007;57:625–30
16. Kurtzke JF.Rating neurologic impairment in multiple sclerosis: an expanded disability status scale (EDSS).Neurology1983;33:1444 –52 17. Zaharchuk G, Saritas EU, Andre JB, et al.Reduced field-of-view dif-fusion imaging of the human spinal cord: comparison with conven-tional single-shot echo-planar imaging.AJNR Am J Neuroradiol
2011;32:813–20
18. Smith SM, Jenkinson M, Woolrich MW, et al.Advances in functional and structural MR image analysis and implementation as FSL. Neu-roimage2004;23(suppl 1):S208 –19
19. Woolrich MW, Jbabdi S, Patenaude B, et al.Bayesian analysis of neuroimaging data in FSL.Neuroimage2009;45:S173– 86
20. Saritas EU, Cunningham CH, Lee JH, et al.DWI of the spinal cord
with reduced FOV single-shot EPI. Magn Reson Med
2008;60:468 –73
21. Habib J, Auer DP, Morgan PS.A quantitative analysis of the benefits of cardiac gating in practical diffusion tensor imaging of the brain.
Magn Reson Med2010;63:1098 –103
22. Summers P, Staempfli P, Jaermann T, et al.A preliminary study of the effects of trigger timing on diffusion tensor imaging of the hu-man spinal cord.AJNR Am J Neuroradiol2006;27:1952– 61 23. Demir A, Ries M, Moonen CT, et al.Diffusion-weighted MR
imag-ing with apparent diffusion coefficient and apparent diffusion ten-sor maps in cervical spondylotic myelopathy. Radiology
2003;229:37– 43
24. Van Hecke W, Leemans A, Sijbers J, et al.A tracking-based diffusion tensor imaging segmentation method for the detection of diffu-sion-related changes of the cervical spinal cord with aging.J Magn Reson Imaging2008;27:978 –91
25. Agosta F, Benedetti B, Rocca MA, et al.Quantification of cervical cord pathology in primary progressive MS using diffusion tensor MRI.Neurology2005;64:631–35
26. Benedetti B, Valsasina P, Judica E, et al.Grading cervical cord dam-age in neuromyelitis optica and MS by diffusion tensor MRI. Neu-rology2006;67:161– 63
27. Clark CA, Werring DJ, Miller DH.Diffusion imaging of the spinal cord in vivo: estimation of the principal diffusivities and applica-tion to multiple sclerosis.Magn Reson Med2000;43:133–38 28. Ohgiya Y, Oka M, Hiwatashi A, et al.Diffusion tensor MR imaging of
the cervical spinal cord in patients with multiple sclerosis.Eur Ra-diol2007;17:2499 –504
29. Valsasina P, Rocca MA, Agosta F, et al.Mean diffusivity and frac-tional anisotropy histogram analysis of the cervical cord in MS pa-tients.Neuroimage2005;26:822–28
30. van Hecke W, Nagels G, Emonds G, et al.A diffusion tensor imaging group study of the spinal cord in multiple sclerosis patients with and without T2 spinal cord lesions. J Magn Reson Imaging
2009;30:25–34
31. Popescu BF, Lucchinetti CF.Pathology of demyelinating diseases.
Annu Rev Pathol2012;7:185–217
32. Fisher E, Lee J, Nakamura K, et al.Gray matter atrophy in multiple sclerosis: a longitudinal study.Ann Neurol2008;64:255– 65 33. Bieniek M, Altmann D, Davies G, et al.Cord atrophy separates early
primary progressive and relapsing remitting multiple sclerosis.
J Neurol Neurosurg Psychiatry2006;77:1036 –39