F OM NEW ZEALAND
SHELLFISH
A thesis submitted under the requirements
for the Degree of
Doctor of Philosophy in Chemistry at the
University of Canterbury
by
Michael Stewart ~
University of Canterbury Christchurch New Zealand
C NTENTS
Abstract 1
Acknowledgments 3
Cha~ter One
Shellfish Toxins
4
1.1 Introduction 5
1.1.1 Phytoplankton 5
1.1.2 Shellfish Toxins 6
1.2
Paralytic Shellfish Poisoning7
1.2.1 Saxitoxins 7
1.2.2 Mode of Action of Saxitoxins 9
1.3
Tetrodotoxin Poisoning11
1.4
Neurotoxic Shellfish Poisoning12
1.4.1 Brevetoxins 13
1.4.2 Mode of Action of Brevetoxins 14
1.5
Diarrhetic Shellfish Poisoning15
1.5.1 Okadaic Acid 15
1.5.2 Mode of Action of Okadaic Acid 16
1.5.3 Pectenotoxins and Y essotoxin 16
1.6
Amnesic Shellfish Poisoning19
1.6.1 Mode of Action of Domoic Acid 20
1.7
Ciguatera Poisoning21
1.7.1 Ciguatoxin 21
1.7.2 Mode of Action of Ciguatoxin 22
1.7.3 Maitotoxin 23
1.8
Miscellaneous Toxins25
1.8.1 Neosurugatoxin and Prosumgatoxin 25
1.8.2 Polyoxygenated Compounds 25
1.8.3 Nitrogen Containing Macrocycles 27
Chapter Two
Investigation of Toxicity In Coromandel Mussels
2.1 Introduction
2.2 Investigation of Toxicity
2. 2.1 Alternative Extraction Method 2.2.2 Brevetoxins
2.2.3 Isolation of Cytotoxic Compound 2.3 Conclusions
Chapter Three
Yessotoxin
3.1 Introduction
3.2 Spectroscopic Assignment of YTX 3. 3 Stereochemical Assignment of YTX
3. 3. 1 Desulfation of YTX
3. 3.2 Spectroscopic Assignment of D-YTX 3. 3. 3 Conformations of Rings G-K In D-YTX 3 .4 Design and Synthesis of YTX Haptens
3 .4 .1 Design 3.4.2 Synthesis 3 .4. 3 Results
3. 5 Development of a Large Scale Isolation Method for YTX
3.5.1 3.5.2
Strategy
Extraction Methodology 3. 5. 3 Preliminary Isolation
3. 5 .4 Final Purification Methodology 3. 6 Conclusions
3.6.2 3.6.3 3.6.4
Spectroscopic Assignment of YTX Stereochemical Assignment of YTX Design and Synthesis of YTX Haptens
Chapter Four
Investigation of Toxicity In Foveaux Strait Oysters
4.1 Introduction
4.2 Investigation of Toxicity
4.2.1 Isolation of Gymnodimine
4.2.2 "Slow Acting" NSP Toxicity
4. 3 Conclusions
Chapter Five
103 104 107 113 115 118
Gymnodimine 119
5.1 Introduction 120
5.2 Structure Elucidation of Gymnodimine 124
5. 2. 1 Partial Structure Elucidation of Gymnodimine 124
5. 2. 2 Complete Structural Assignment of Gymnodimine 13 3
5. 3 Absolute Stereochemistry of Gymnodimine 141
5. 3. 1 Possible Methods 141
5.3 .2 Strategy 145
5. 3. 3 Reduction of Gymnodimine 145
5. 3 . 4 Spectroscopic Assignment of Gymnodamine 146
5. 3. 5 Fmmation of Crystalline Derivatives of Gymnodamine 149
5.3.6 Crystal Structure ofp-Bromobenzamide (56) 151
5.3.7 NMR Spectral Assignment ofp-Bromobenzamide (56) 155
5. 3. 8 Conformational Studies on Gymnodimine and
p-bromobenzamide 159
5.4 Design and Synthesis of Gymnodimine Haptens 165
5.4.1 Design 165
5 .4. 2 Synthesis 167
5.4.3 Results 172
5. 5 Development of a Large Scale
Isolation Scheme for Gymnodimine 17 5
5.5.1 Introduction 175
5.5.2
5.5.3
Development of Protocol
Final Purification of Gymnodimine
176
5.6 Development of a Chromatography Based
Assay for Gymnodimine 186
5.6.1 Introduction 186
5.6.2 Methodology 186
5.6.3 Results 187
5.7 Conclusions 192
5.7.2 Stmcture Elucidation of Gymnodimine 192
5.7.3 Absolute Stereochemistry of Gymnodimine 192
5.7.4 Design and Synthesis of Gymnodimine Haptens 193
5.7.5 Development of a Large Scale Isolation Scheme
for Gymnodimine 193
5.7.6 Development of a Chromatography Based Assay
for Gymnodimine 194
Chapter Six
Ex peri mental
195
196 196 197 198 199 201 201 202 6.1 General Methods
6.2
6.3
6. 1. 1 Nuclear Magnetic Resonance
6. 1 . 2 Mass Spectrometry
6. 1 . 3 High Performance Liquid Chromatography
6.1.4 Column Chromatography
6.1.5 Thin Layer Chromatography
6. 1. 6 Dry Solvents
Work Described In Chapter Two
6.2.1 Collection
6.2.2 Total Lipid Extract
6.2.3 Isolation of Cytotoxic Compound
Work Described In Chapter Three
6. 3. 2 Spectroscopic Assignment of YTX
202
202
209
212
212
6. 3. 3 Stereochemical Assignment of YTX 212
6. 3 . 4 Design and Synthesis of YTX Haptens 213
6. 3. 5 Development of a Large Scale Isolation Method for YTX 216
6.4 Work Described In Chapter Four 224
6. 4. 1 Collection 224
6.5
Work Described In Chapter Five 6.5.2 6.5.3 6.5.4 6.5.5 6.5.6 ReferencesAppendix One Assays
Structure Elucidation of Gymnodimine Absolute Stereochemistry of Gymnodimine Hapten Design and Synthesis of Gymnodimine Large Scale Isolation Scheme
Development of a Chromatography Based Assay for Gymnodimine
The Mouse Bioassay
The P388 Antitumour Assay The Neuroblastoma (N2A) Assay
The Enzyme-Linked Immunosorbent Assay
Appendix Two
X-Ray Data for Crystal Structure
Appendix Three Publication
Appendix Four
Models Created By Spartan
New Zealand experienced its first recognised outbreak of shellfish
poisoning around Northland in early 1993. The poisoning symdrome was characterised as neurotoxic shellfish poisoning (NSP) from the
observed symptoms. The major causative toxins were isolated and
characterised by the Japanese research groups of Professor Ishidaa
(University of Shizuoka) and Professor Yasumotob,c (Tohoku
University). The toxins were identified as brevetoxin B derivatives.
Diarrhetic shellfish poisoning (DSP) was suspected as responsible for
further poisoning around this area. Yessotoxin (YTX), a suspect DSP
toxin, was isolated as part of this research and is the first reported
instance of YTX in New Zealand.
A stereochemical study was carried out on a desulfated YTX
derivative. The results suggested anomalies in the reported
conformation of YTX. Attempted synthesis of haptens of YTX for
development of an ELISA is outlined in this thesis.
Another incident of shellfish contamination occurred around Foveaux
Strait in early 1994. The toxicity was characterised by NSP symptoms In mice. The causative toxin, gymnodimine, was first reported by a
Japanese research group, although independent parallel structure
elucidation was carried out as part of this research.
a Ishida, H.; Nozawa, A.; Totoribe, K.; Muramatsu, N.; Nukaya, H.; Tsuji, K.; Yamaguchi, K.; Yasumoto, T.; Kaspar, H.; Berkett, N.; Kosuge, T. Tetrahedron Lett., I995, 36,
725-728.
b Yasumoto, T. Marine Toxins Occurring in the Oceanian Waters. Symposium On Oceanian-Japanese Organic Chemistry Synthesis and Natural Products: Socs 12 - Tokushima, I996.
Tokushima Bunri University, Japan.
Acknowledgements
I would like to express gratitude to my supervisors Drs John Blunt and Murray Munro for their expert guidance throughout my time in the marine chemistry group at Canterbury.
I would also like to give thanks to my associate supervisor, Dr Donald Hannah of ESR in Wellington, who has "led from afar" and shown unwavering enthusiasm.
The technical staff at Canterbury have been excellent. I would like to thank especially Bruce Clark (mass spectrometry) and Gill Ellis (P388 assays).
For assistance outside of Canterbury I would like to thank Dr Penny Truman from CDC in Porirua for analysing shellfish extracts, and Dr Lewis Pannell, NIDDK, NIH, U.S.A., for additional mass spectrometry work.
Throughout my time in the marine chemistry group I have seen many faces come and go. It would take at least two pages to acknowledge them all and so I would like to thank everyone who has had a positive influence on my time here.
1 . 1
Introduction
1.1.1
Phytoplankton
1Phytoplankton are a diverse group of unicellular and colonial organisms, most of which are classified as algae. These microscopic plants form the base of the food chains in aquatic environments and support the bivalve and fin fisheries. Under favourable environmental conditions, phytoplankton populations multiply rapidly (or bloom) to reach high cell densities (105-108 cells per litre) and discolour the water, hence the term red tide.
The majority of phytoplankton species are harmless. However, some can be noxious or toxic, for example the dinoflagellates Gymnodinium
cf. breve and Alexandrium minutum (Fig 1.1.1). Dense blooms of
algae may deplete oxygen levels through nocturnal respiration or decay, leading to massive fish and shellfish mortalities. Some species of algae may kill fish through gill damage, whereas others produce toxins that pass through the food chain and may kill vertebrate predators. It is estimated that world-wide there are 2000 cases of shellfish poisoning caused by algal toxins each year, of which about 15% are fatal.
Fig 1.1.1 Scanning Electron Micrographs of Gymnodinium ct breve
(left) and Alexandrium minutum (right)
1. 1.2 Shellfish Toxins
1.2
Paralytic Shellfish Poisoning
Numerous dinoflagellate species are known to produce the toxins causing PSP: Alexandrium spp. (formerly Gonyaulax or Protogonyaulax), Gymnodinium catenatum and Pyrodinium bahamense
var. compressum.2 The toxins responsible have been named the saxitoxins.
PSP is by far the most lethal form of shellfish toxicity. It has been documented for over 50 years as a cause of deaths in North America and during the last 10 years has killed more than 40 people in the Philippines. In a single outbreak in Guatemala some years ago, 26 people were killed by eating PSP contaminated shellfish. 3
The symptoms of PSP are numbness, or hypersensitivity of the mouth and skin, a floating sensation and motor signs including ataxia, muscle weakness, paralysis and death, due to respiratory failure. The symptoms are usually rapid in onset (hours), but can vary from being acute, resulting in death, to prolonged, with less severe symptoms.4
1.2.1
Saxitoxins
are further distinguished by the presence of 11-0-sulfates (eg. GTX2, 3) and 21-N-sulfates (eg. B1, 2).5•6
H
N 0
R/2IT''
4 13200 H H
6
Rc:k
3
5
)=+
NH2 16 N
H2N+ N
12 H
1o OH
n,, 17 OH1s
,, ,, ,,
R3
Rt R2 R3 R4
STX (1) H H H H
B1 (2) H H H
so3-GTX2 (3) H H
oso3-
HC1 (4) H H
o
so3-GTX3 (5) H
oso3-
H HC2 (6) H
oso3-
Hso3-NEO (7) OH H H H
B2 (8) OH H H
so3-GTX1 (9) OH H
oso3-
HC3 (10) OH H
o
so3-GTX4 (11) OH
oso3-
H HC4 (12) OH
oso3-
H1.2.2
HO
H
)=NH2
N H
OH ,, OH
H
---oso3-dcSTX (13)
Mode of Action of Saxitoxins
Saxitoxins alter the function of sodium channels, which are essential for
the production of action potentials in excitable cells such as neurons.
Normally, a change in membrane potential causes sodium channels to
open, allowing sodium ions to flow through and rapidly depolarise the
nerve membrane. The result is that a wave of depolarisation is
propagated along the nerve. Saxitoxin binds to the outside of the
sodium channel, blocking the ion flow, thus slowing, or even
S.xrt01ttn oVId ~~O)IIfl s11et1<.e thf ntui'OI\S llwt ~ on mus le cf'lls. Sod! I'll liOn$ (/lold) mta flolv IIIlO llf'IUOM {" 1111 Jqf) In ordtf for 'IN
nNIOM to t llv Impulses (f.t) co Mbtr cdls. Snttnx'ln ~ necKilC to M ~
(IJM jphu lit right) ~ ~ ~lion by ~lltlnq tht loflS
trom PiJI»ICIQ jii(O tht 1'1CUlon • ~ the MtW c~Us tbus qu ed.
mus " h. I'K~ no 5llmula110n i1nd omt pan.lyz«<.
Fig 1.2.1 Mode of Action of Saxitoxin and Neosaxitoxin8
Since saxitoxins are charged, water soluble molecules, it is probable
that they do not penetrate the blood-brain barrier well and the majority
[image:16.602.105.502.85.387.2]1
a3
Tetrodotoxin Poisoning
The primary source of tetrodotoxin (TTX, 14) was traced to a dietary alga and finally to a symbiotic bacterium.10 The bacterium was first assigned as a Pseudomonas sp., then changed to Alteromonas sp. and
finally described as a new species, Shewanella alga.11 Subsequently, a broad spectrum of bacteria have been reported to produce the toxin.l2,13,14
HO
o-OH
H + N~NH2
N
H
Tetrodotoxin (TTX, 14)
TTX derives its name from the puffer fish family (Tetraodontidae) and is frequently involved in fatal food poisoning. The toxin has a unique structure and a similar mode of action to saxitoxin (1), causing the blockage of sodium channels of excitable membranes.
1 . 4
Neurotoxic Shellfish Poisoning
The dinoflagellate that is responsible for NSP is Gymnodinium breve
and the causative toxins have been named the brevetoxins.
Brevetoxins are potent fish toxins and have been responsible for mass fish mortalities along the Florida coast.17
NSP is characterised by a range of neurological and gastrointestinal symptoms, including paraesthesia, changes in thermoreception, muscle weakness, incoordination, headache, muscle and joint pains, malaise, chills, diarrhoea, nausea and vomiting. One distinct feature of brevetoxin-containing blooms is their ability to trigger respiratory distress when involved in sea spray.
In terms of symptoms, NSP overlaps significantly with PSP. However, time of onset and duration of illness are generally longer for NSP. Also, NSP is more likely to cause muscle weakness, rather than the paralysis associated with PSP. Importantly, NSP has never been recorded as causing death. 18
1.4. 1 Brevetoxins
Brevetoxin B (BTX-B, 15) was the first member of this class of compounds. Its structure was established by X-ray crystallography in 1980, and has a ladder-like skeleton consisting of trans-fused polyether
rings.19 All brevetoxins found subsequently have the same backbone as BTX-B.
0
0
H
~ ~ 0
OH
0
0 H
Brevetoxin B (15)
Brevetoxin A (16)
0 H
0
H
H
0
structure was elucidated by X-ray crystallography and the most unusual structural feature of BTX-A is its fused central rings (EFG), which have been shown to undergo slow conformational changes.5
1.4.2
Mode of Action of Brevetoxins
Brevetoxins act on the sodium channel at a site distinct from that affected by the saxitoxins. They cause the channel to remain open longer and stabilise the pre-open and open states. This then allows greater sodium ion inflow to occur, leading to neuronal membrane depolarisation and eventually causing nervous system failure. 20
In addition to neurotoxicity, cardiac and respiratory toxicity also occur. The former is caused by increased sodium influx allowing greater sodium-calcium exchange, thus inducing increased catecholamine release. The latter is due to both peripheral effects on respiratory reflexes and muscle function There are also central effects on respiratory and cardiovascular control.21
1 . 5
Diarrhetic Shellfish Poisoning
The causative organisms of DSP have been identified as several dinoflagellates in the genus Dinophysis.22 These algae produce okadaic acid (17) and the closely related dinophysis toxins, eg. DTX -1 (18).
Other toxins, suspected of being involved in DSP, eg. the pectenotoxins23 and yessotoxin (YTX, 19),24 have been isolated from Japanese scallops. However, the causative algae were of unknown origin. The dinoflagellate Protoceratium reticulatum has recently been established as the organism responsible for production of YTX. 25 DSP has wide distribution around the world and the poisoning is a serious problem, both to public health and to the shellfish industry. DSP was first recognised in 1976, when a mussel poisoning case occurred in Northeastern Japan. 26
The prominent human symptoms of DSP are gastrointestinal disorders such as diarrhoea, nausea, vomiting, and abdominal pain. Histopathological investigations have revealed that pectenotoxin-1 (20) is hepatotoxic by inducing rapid necrosis of hepatocytes.27
1.5.1 Okadaic Acid
Okadaic acid (17) and the closely related dinophysis toxins, eg. DTX -1
0 OH
~
0
0,, ,,,,
HO ,, ,, ,,,
0 ~,,,,,,,
,,
0 ,,'
OH
'',,,OH 0
~D
OH
R = H Okadaic acid (17)
R =Me DTX-1 (18)
1.5.2 Mode of Action of Okadaic Acid
Aside from causing symptoms of diarrhoea, okadaic acid is known to be a potent carcinogen and to cause neuronal cell damage in cultured neurons.9 The cause of diarrhoea and carcinogenicity are a result of a potent and specific inhibition of the serine/threonine protein phosphatases, PP1 and PP2A. This inhibition allows the build-up of phosphorylated proteins in cells that leads to pronounced "second messenger" production, eg. calcium influx, cyclic AMP and prostaglandin production.
1.5.3 Pectenotoxins and Yessotoxin
0
,,,
OH 0''''
OH
Pectenotoxin-1 (20)
Y essotoxin (YTX, 19) was first isolated from Japanese scallops and the
structure elucidated to be a brevetoxin-like polyether. 24 Its structural features include two sulfate groups and an olefinic C9 side chain. The relative31 and absolute32 stereochemistry of YTX has only recently been determined. Three new analogues of YTX have recently been discovered from shellfish, viz homo YTX (21), 45-hydroxy YTX (22)
R X
YTX (19)
~
1~
2homo YTX (21)
45-0H YTX (22)
~
1OH
1
B6
Amnesic Shellfish Poisoning
In late 1987 a mysterious and serious outbreak of food poisoning occurred in Canada. Symptoms of the poisoning included vomiting and diarrhoea. In some cases, this was followed by confusion, memory loss, disorientation and coma. Three elderly patients died and other victims still suffer from neurological problems.36 The compound was identified as domoic acid (24) a compound first identified in crude extracts of certain seaweed found in the waters around Japan.37 The Japanese used it as a folk medicine remedy for intestinal worm infestation. This argues against domoic acid as a toxin, however the higher doses found in the shellfish showed the obvious difference between therapeutic and toxic doses.
Domoic acid (24)
Further research showed that domoic acid was produced by a diatom
1. 6.1 Mode of Action of Domoic Acid
1 . 7
Ciguatera Poisoning
There are two groups of compounds implicated in ciguatera poisoning: the main responsible toxins are ciguatoxin (CTX, 25) and its congeners, and the other is maitotoxin (MTX, 26). Both groups are produced by the epiphytic dinoflagellate Gambierdiscus toxicus,40•41
transferred to herbivorous fish and subsequently to carnivores.
Ciguatera is a seafood poisoning prevalent in circum tropical areas. The poisoning is caused by ingestion of coral reef fish that have become toxic through their diet.
The clinical symptoms are diverse.42 Neurological disturbances are prominent. For example, reversal of thermoreception (as in NSP), called "dry ice sensation", is one of the most characteristic symptoms of ciguatera pmsomng. Other symptoms include joint pain, miosis, erethism, cyanosis and prostration. Gastrointestinal disorders are nausea, vomiting, and diarrhoea. Cardiovascular disturbances are low blood pressure and bradycardia.
1.
7.
1Ciguatoxin
Ciguatoxin (25) was first isolated in 1980 by Scheuer et al and
characterised as a polyether compound. 43 Insufficient material prevented the structural elucidation. In 1989, Murata et al elucidated
1989, ciguatoxin congeners have been isolated, either from toxic fish,45 or from cultured G. toxicus. 46
Ciguatoxin (25) CTX-4B (27)
R1 = -CH(OH)-CH20H; R2 = OH R1 = -CH=CH2; R2 = H
An interesting aspect is that the moray eel, which is at the top of the coral ecosystem, tends to contain more polar (more oxygenated) congeners, while the dinoflagellate produces less polar ones. Ciguatoxin itself, the most oxygenated member of this class of toxins is absent in the dinoflagellates. These data suggest that the less polar congeners produced by the dinoflagellate are precursors to the more polar toxins found in fish, the latter toxins formed by oxidative enzyme systems in the fish. The toxicity is also increased in the oxidised metabolites, with CTX being 11 times more toxic than its plausible precursor CTX -4 B. 5
1. 7.2 Mode of Action of Ciguatoxin
CTX was thought to be inhibition of choline esterase,47 until Rayner et
al revealed that it stimulated the sodium ion influx into cells. 48
1. 7.3
Maitotoxin
Maitotoxin (MTX, 26) is suspected of diversifying the ciguatera symptoms and is found particularly in herbivorous fish. MTX is an extremely potent polyether compound (LDso against mice is ca. 50
ng/kg, ip)49 constructed from a C142 carbon chain containing 32 ether rings, 28 hydroxyl groups, and two sulfate esters. With a molecular weight of 3422 Da, MTX is the largest non-peptidic natural product elucidated. The relative50•51 and absolute51 stereochemistry of MTX
H
OH
maitotoxin (26)
HO
OH
OH OH
OH
1 . 8
Miscellaneous Toxins
1.8.1 Neosurugatoxin and Prosurugatoxin
In 1965, there were 26 reported cases of intoxication after ingestion of the Japanese ivory shell, Babylonia japonica. Reported symptoms were
visual defects, thirst, numbness of lips, constipation and dysuria. The toxins responsible were isolated from the digestive glands of the ivory shell and named neosurugatoxin (28) and prosurugatoxin (29).52•53•54
1.8.2
H < O OH OH
OR
HO
oo
0
N eosurugatoxin (28) Prosurugatoxin (29)
NH
Br
R
=
~-xylosR=H
Polyoxygenated Compounds
The group of polyoxygenated compounds, named the amphidinolides eg. amphidinolide B (30), wete isolated from the dinoflagellate
breviviridis.55 The number of compounds in this series has recently been extended to include up to amphidinolide Q.56 The majority of the macrolides in this group exhibit extremely potent cytotoxicity against the L1210 and KB celllines.56
0
-0
0
amphidinolide B (30)
The dinoflagellate, Amphidinium klebsii, was found to produce
amphidinol (31), which belongs to a new class of polyhydroxypolyene compounds, showing potent antifungal and haemolytic activity.57 A new member of this class, amphidinol 2, has recently been reported. 58
HO OH
amphidinol (31)
HO
OH
The antifungal compound, goniodomin A (32) has been isolated from the tide pool dinoflagellate, Gonyaudoma pseudogonyaulax and
elucidated as a novel polyether lactone.59
OH
goniodomine A (32)
1.8.3
Nitrogen Containing MacrocyclesProrocentrolide (33) has been isolated from the ciguatera-associated dinoflagellate, Prorocentrum lima. The structure was elucidated as a
OH
OH
prorocentrolide (33)
The imine moiety, seen in prorocentrolide, is also found in a suite of recently isolated toxins. These compounds are further distinguished by the inclusion of a spiro-centre. The biological properties of these toxins are unique and characterised by the rapid onset of symptoms in the mouse bioassay. 62
Pinnatoxin A (34) was isolated from the Okinawan bivalve, Pinna
muricata.63 The relative stereochemistry of pinnatoxin A was
pinnatoxin A (34)
0
OH
pinnatoxin D (35)
0
0
spirolide B (36) R = H spirolide D (37) R = Me
spirolide E (38) il2•3 spirolide F (39)
0
0
- ~ N
u
1 . 9
Detection Methods for Shellfish
Toxins
Assay techniques for the toxicity testing of shellfish are dependent on the type of poisoning under consideration. Each poisoning syndrome is caused by one or more toxins, either multi-component (eg. PSP, DSP, NSP) or single component (eg. ASP) . The contribution of each component to overall toxicity, within a multi-component toxic shellfish poisoning (TSP), is variable . The testing and monitoring for TSP requires knowledge of the range and levels of each contributing component. 68
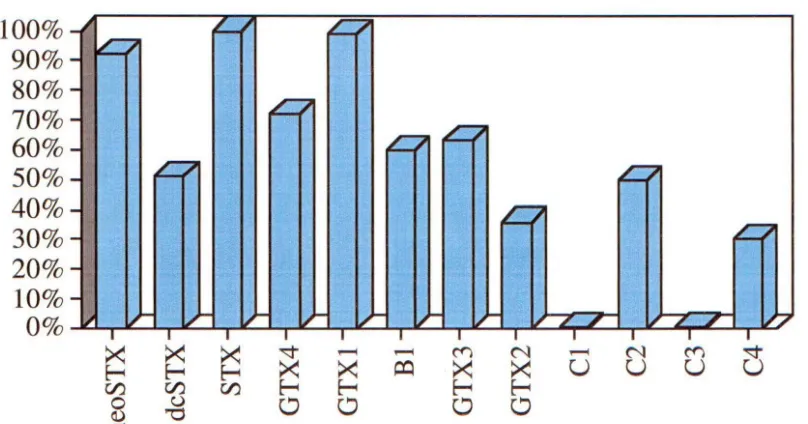
An excellent example is the multi-component PSP toxin class. Toxicities of each member in the class vary substantially (Fig 1.9 .1 ), 69 providing evidence that specific toxin testing is essential for accurate toxicity determination. 100% 90% 80% 70% 60% 50% 40% 30% 20% 10% 0% -Q Q
II .I
I I
><
><
E-.; E-.;
C/.) C/.)
0 C)
~ "'0
c:: Fig f.-I II I
~
C/.) 1.9.1 C.7 QqrCl
Q 0 Q.I .I .I L I L - " V7
I I I I I I I I I
-.::!" ... ... ~ N ... N ~
C3
><
><
~><
><
u
u
u
E-.; E-.; E-.; E-.;0 0 0 0
[image:38.603.106.510.538.750.2]A suitable toxicity test must be accurate, specific and reliable towards the type of toxin(s) assayed against. In addition, the test must provide quantitative measurements of toxicity for relating observed public health effects to toxicity. From this knowledge regulatory thresholds may be set. 68
Shellfish biotoxin toxicity testing is most often performed using the mouse bioassay.70•71 Extracts for testing are assayed by performing
inoculations into the peritoneal cavities of mice and observing symptoms and death times. This approach suffers from poor reproducibility, low sensitivity and interference from certain matrices. 72
The mouse bioassay is relatively non-specific, except in the case of NSP and PSP testing. The extraction method can also give some indication of the type of TSP toxicity (Table 1.9.1).
Table 1.9.1 Shellfish Toxins, Extraction Methods and Mouse
Bioassay68
TSP Extraction Method Observation In Mouse Bioassay
ASP Aqueous extraction Non-specific behaviour DSP Lipid extraction Non-specific behaviour NSP Lipid extraction Characteristic behaviour
PSP Aqueous acid extraction Characteristic behaviour
confirmation of the toxins responsible for each TSP, by specific, humane methods.
The testing for specific toxins (or groups of toxins, in the case of multi-component systems) can occur in a variety of ways. The most common assays include: the ELISA (Enzyme Linked /mmunoSorbent Assay) , currently under investigation for most TSP, RIA (Radio ImmunoAssay) , for NSP analysis, and PPA (Protein Phosphatase enzyme Assay) for DSP testing (Table 1.9.2). In addition, highly specific chemical assays, such as HPLC with specific detection, are being developed for the major TSP incidents encountered (Table
1.9.2).
Table 1.9.2
TSP
ASP
DSP
NSP
PSP
Chemical Assay Techniques for Shellfish Toxin
Testing68
Specific Techniques
HPLCwith UV
HPLC/Fluorescence with pre-column derivatisation
Enzyme Immunoassays (ELISA)
Phosphatase enzymes
HPLCwith UV
Sodium channel binding assays (N2A)
Radio immunoassays (RIA)
HPLC/Fluorescence with post-column reaction
Enzyme Immunoassays (ELISA)
Investigation of Toxicity
2. 1
Introduction
On 4 January 1993 the initial indications of New Zealand's first recognised outbreak of shellfish toxicity became apparent. In Whangarei, several cats were diagnosed by local veterinary surgeons as having been poisoned after consuming shellfish. Owners of the affected animals were also found to have experienced toxic symptoms after consuming shellfish. Publicity led to further notifications of human illness following shellfish consumption. In addition, respiratory irritation was reported by people present near Orewa beach.18 These reports were consistent with reported incidents of a syndrome associated with red tides of Gymnodinium breve in Florida. 73 The illness is caused by an aerosol containing particles of G. breve, a
particularly fragile species, which is broken up by the pounding action of surf. As a result, the New Zealand coastline was progressively closed for shellfish harvesting. The entire coastline was closed from 22 January 1993, and was progressively re-opened as the levels of biotoxins dropped below the regulatory limit.18
Four specific toxin groups were detected in shellfish from different localities around New Zealand. For three of the toxin groups, the specific toxin was identified by bioassay or chemical means. These were the saxitoxins (PSP), domoic acid (ASP) and okadaic acid (DSP).
Island, between North Cape and East Cape, and could be related to shellfish collected from coastline between Northland and Bay of Plenty. However, mouse bioassays indicated that the area where shellfish were affected with lipid soluble toxins was between Bay of Islands and Bay of Plenty, hence around the Coromandel Peninsula (Fig 2.1.1).18
North Cape
\
Bay of Islands
I
/ Whangarei Harbour
• -~-Coromandel Peninsula Auckland Bay of Plenty
East Cape
Wellington --~
Fig 2.1.1 New Zealand's North Island
[image:43.595.148.448.240.584.2]Table 2.1.1 Summary of the Clinical Symptoms Observed and Biotoxins Demonstrated During the 1993 Crisis
Prototype Causative Clinical Phytoplankton Toxin Clinical Toxins Syndrome Observed Demonstrated
Syndrome Observed By
PSP Saxitoxins Doubtful Alexandrium Mouse bioassay
minutum
A. tamarense
NSP Brevetoxins Yes Gymnodinium Mouse bioassay
breve
Respiratory Brevetoxins Yes G. breve
irritation
DSP Okadaic acid Probable Dinophysis sp. Chemical assay and related
compounds
ASP Domoic acid Doubtful Nitzschia pungens Chemical assay
However, subsequent work at the Institute of Environmental and Scientific Research (ESR) laboratories in New Zealand, as well as research findings from the USA and in Japan, suggested that the toxins involved were not any of the known brevetoxins. Differences in chromatographic behaviour and in mode of action suggested that the toxic reaction was caused by a compound (or compounds) that might have some relationship to the brevetoxins, but may be in a unique class.
2.2
Investigation of Toxicity
The establishment of a mouse bioassay was deemed as essential for the isolation of the toxic components in the shellfish. The mouse bioassay (Appendix 1) shows total toxicity in the extracts although it had three limitations. The assay was run at the Communicable Diseases Centre (CDC) in Porirua, where samples were sent for analysis. This made for long turn-around times between sending the samples off and receiving the results, slowing progress measurably. The infancy of the mouse bioassay in New Zealand and the lack of experienced technicians at the time, meant that major problems existed while the assay was being run. The most important problem was the difficulty 1n dissolving highly lipid soluble samples in a detergent/saline solution.
A total lipid extract, prepared by the NZ acetone extraction method75 and supplied by ESR, was assayed and the result was an ICso value of
50 ~g/mL. This result, although only showing mild cytotoxicity,
prompted further investigation of the suitability of the P388 assay to detect the toxicity in the shellfish.
The total lipid extract was partitioned between 80% methanol/water and petroleum ether (b.p. range 50-70 °C). The P388 assay revealed that all the cytotoxicity was in the aqueous methanol phase, with an ICso value of 20 ~g/mL. Mouse bioassays were then run on both fractions. Mouse toxicity occurred in the aqueous/methanol phase only, hence supporting a likely correlation between the two assays.
800
600
D
mass (mg)D
P388 cytotoxicity (u)400
200
[image:47.603.100.500.90.473.2]0
... C"l ('f') ~ tr) \0 r- 00 0\ 0
<
<
<
<
<
<
<
~<
...<
C"l C"l C"l C"l C"l C"l C"l C"l C"l
C'i
Fraction
Fig 2.2.1 Graph Showing Cytotoxicity and Mass of Fractions off
CI 8 Reverse Phase Column
P388 cytotoxicity (u) =mass (mg)IICso (ng/mL) x
Jo4
125 -~
I'~
100-1
li
75 -1 '
50-
25-D
mass (mg)[J P388 cytotoxicity (u)
. ... . ...
~ {::.. :::::: :;: I
c. :::::: :::
0 lti'7'-7--{-"7.· -~. ·.J:'7'---z.,-{'7.·.:::7:-:Tr-:.-z-r--::;_, I ,__-~ l&.~~--r-L{'7--I-zr-";''7"---l..l :::::: ::: ~ :::::: ~
,...; N ~ -:::t Vl \0
p:) ~ ~ p:) p:) p:)
N N N N N N
Fraction
Fig 2.2.2 Graph Showing Cytotoxicity and Mass of Fractions off LH-20 Gel Permeation Column
P388 cytotoxicity (u) =mass (mg)/ICso (nglmL) x
Jo4
Fractions 2.B7 and 2.B8 were then re-chromatographed on LH-20 using 10% methanol in dichloromethane a eluti ng olvent. The cytotoxic compound(s) treaked badly on thi column. Con eq uently, most of the cytotoxicity was lost. The behaviour on LH-20 ugge ted toxin solubility problems in both dichloromethane and 10% methanol in dichloromethane. These results suggested that the compound( ) showing cytotoxicity are more polar than the known brevetoxins.
[image:48.603.103.502.89.403.2]2.2.1 Alternative Extraction Method
The new method involved freeze drying the frozen mussel tissue to remove the water (80% by weight). The dried shellfish were then crushed to release the contents of the cells and extracted with a succession of solvents from water, methanol, ethyl acetate through to dichloromethane.
The water and methanol extracts were toxic in the mouse bioassay. This was consistent with the toxin solubility problems encountered earlier on LH-20. The use of highly polar extraction solvents has an advantage over a total lipid extraction. Shellfish have a high lipid content, of which only a minimal amount will be extracted by using water or methanol/water mixtures below 80% methanol/water.
crude extract
.().
C 18 desalting column .().
C 18 column chromatography .().
400 200 400 400 200 400
30%MeOH 50% 70% 80% MeOH DCM
I
2.t2 2.t3 2.t4
I I
2.C1 2.C5 2.C6
1690mg 155 mg 239mg 264mg 248mg 374mg
>1250000 <9750 <9750 <9750 34000 260000
(<14) (>159)
I (>245)
(>271)
I
(73) (14)
dioll
40 40 40 40 40 40 40 40 40 80
DCM 10%Et0Ac 20% 50% EtOAc 5%MeOH 10% 20% 50% MeOH
I I I I I I I I I
2.rho 2.D1 2.D2 2.D3 2.D4 2.D5 2.D6 2.D7 2.D8 2.D9
96mg 32mg 11 mg 8mg 6mg 8mg 20mg 60mg 127mg 120mg
<975 28000 6300 15000 38000 14000 1300 <975 <975 19000
(>985) (11) (17) (5) (2) (6) (154) (>615) (>1303) (63)
I
amino70 22 22 22 22
LH-20
I
22 22 22 22 100
loss of I I I I I I I I I I
activity 2.E1 2.E2 2.E3 2.E4 2.E5 2.E6 2.E7 2.E8 2.E9 2.E10
1.5 mg 4.1 mg 4.5 mg 10.0 mg17.6 mg 8.6 mg 6.6 mg 1.2 mg 0.8 mg 3.7mg
>25000 18000 9500 9300 15500 965 <195 120 1800 9000
(<0.6) (2.3) (4.7) (10.8) (11.4) (89.1) (>338.5)(100.0) (4.4) (4.1)
LH-20
125 50 50 50 50 60 70 110 110 110
2.ln 2.l?2 2.F3 2.1F4 2.Fs 2.1F6 2.F7 2.Fs 2.F9 2.-lno
6.8 mg 20.0 mg 25.8 mg 29.0 mg 18.8 mg 7.3 mg 5.2mg 4.0mg 2.5 mg 2.5mg
14000 16000 9000 8500 285 <195 3500 >12500 >12500 >12500
(4.9) (12.5) (28.7) (34.1) (659.6) (>374.4) (14.9) (<3.2) (<2.0) (<2.0)
Legend aaa Elution volume (mL)
bbb Elution Solvent Mix
ccc Sample Code
ddd Sample mass (mg)
eee 1Cso (ng/mL)
(fff) P388 cytotoxicity= mass (mg)/IC5o (ng/mL) x 104
Fractions 2.D8 and 2.D9 exhibited the strongest total cytotoxicity and were chromatographed separately on LH-20 gel permeation columns. Fraction 2.D8 was fractionated into 2.E1 - 2.E10, with the majority of the cytotoxicity contained in 2.E6 - 2.E8 (Scheme 2.2.1). Fraction 2.D9 was fractionated further into 2.F1 - 2.F1 0 with the cytotoxicity concentrated in 2.F5- 2.F6 (Scheme 2.2.1).
Early promise for purification of fraction 2.D 1 on amino phase chromatographic sorbent was shown. However, when the full amount was passed through a column containing this phase, almost all cytotoxicity was lost. The acidic nature of the compound (hence strong binding to amino phase chromatographic material) was also observed for subsamples of 2.D8 and 2.D9. The large difference in chromatographic behaviour (as exhibited on diol phase chromatographic material) was unexplained but could be due to residual methanol still present, which was used to clean the diol material, before use. Thus, it was believed that the cytotoxic compound contained in 2.D 1 was the same as that exhibiting the major cytotoxicity in 2.D8 and 2.D9.
400
"BTX" (ng/J.Lg)
300
D
P388 cytotoxicity (u)200
100
0
,...; N ('0 '<:j- V') \0 r- 00 0\ 0
~ ~ ~ ~ ~ ~ ~ ~ ~ ,...;
N N N N N N N N N ~
N Fraction
Fig 2.2.3 Graph Showing Cytotoxicity and "BTX" of Fractions off
LH-20 Gel Permeation Column
"BTX"
=
breve toxin B equivalents from N2A assayP388 cytotoxicity (u) =mass (mg)IICso (ng/mL) x
Jo4
800
D
"BTX" (ng/Jlg)600
D
P388 cytotoxicity (u)400
200
0
... C'l ('0 '<:j" II") \0 r- 00 0"1 0
~ ~ ~ ~ ~ ~ ~ ~ ~ ...
C'l C'l C'l C'l C'l C'l C'l C'l C'l ~
C'l
Fraction
Fig 2.2.4 Graph Showing Cytotoxicity and "BTX" of Fractions off
LH-20 Gel Permeation Column
"BTX"
=
breve toxin B equivalents from N2A assayP388 cytotoxicity (u) =mass (mg)IICso (ng/mL) x
Jo4
Fig 2.2.4 does not show such an obvious result, with BTX activity in 2.F4 and 2.F5, but P388 cytotoxicity in 2.F5 and 2.F6. These data suggest overlapping areas of activity.
From these data it became apparent that the P388 cytotoxicity was not caused by BTX-like compounds, but possibly a unique compound which has no effect on the sodium channel.
2.2.2
Brevetoxins
While this work was in progress, it was discovered that a large amount of toxic shellfish had been sent to two research groups in Japan. A personal communication with Dr Ishida of University of Shizuoka in Japan, resulted in the notification of the isolation and identification of the major causative toxin in this same 1993 New Zealand outbreak. A following publication of the results unveiled a BTX-B conjugate, named BTX-B 1 (41), isolated from cockles, which were collected during the 1993 outbreak.76 BTX-B1 differs from BTX-B only in the side chain, where a taurine group is conjugated at the aldehyde position.
0
0
0 OH H Me
BTX-B1 (41)
conjugates, BTX-B2, BTX-B3 and BTX-B4, from mussels collected during the 1993 New Zealand outbreak of shellfish poisoning. It was not until recently, however, that the chemical structures of BTX-B2 (42)77 and BTX-B3 (43)78 were published.
0 OH
0
Me
-::.
Me
0
H Me
BTX-B2 (42)
BTX-B3 (43)
S./'yCOOH
II ~
0 NH2
OH
COOH 0
All the new BTX conjugates contain functional groups, which enhance the polarity of each molecule. In particular, each contains acidic and/or basic groups, eg. BTX-Bl (S03Na!NH), BTX-B2 (COOH/NH2) and BTX-B3 (COOH).
This lead to the assumption of the possibility of an entirely new class of compound.
None of the BTX conjugates have ever been isolated from the algae. It
is postulated that the shellfish modify the toxins to less toxic, water soluble conjugates, which are able to be excreted. 79
The similar chromatographic profile of the compound(s) exhibiting P388 cytotoxicity, suggested certain common characteristics to the newly discovered conjugated brevetoxins.
2.2.3
Isolation of Cytotoxic Compound
Although the causative NSP toxins had been identified from the mussels, the potent P388 cytotoxicity observed was of considerable interest. The priority of this research was then directed at elucidating the structure of the compound(s) which exhibited this activity.
Fractions 2.E6 - 2.E8 and 2.F6 were all analysed by 1 H NMR (Nuclear
to the low mass of the active fractions, combined with no clear common peaks observed by 1 H NMR spectroscopy, these fractions were kept as reference samples for a larger scale extraction.
A larger extraction was undertaken by ESR laboratories in Lower Hutt (using the protocol described in Section 6.2.3) on 6.5 kg of frozen mussels.
The extract was sent to University of Canterbury as a methanol/water solution. The methanol was evaporated off and the resulting water solution run through a large C18 column. The resulting fractions 2.Hl - 2.H7 (Scheme 2.2.2) were assayed in both the P388 and N2A assays. The majority of the P388 cytotoxicity was concentrated in fractions 2.H5 and 2.H6, while the BTX activity was in 2.H6.
methanol/water extract ,Q.
concentration to water ,Q.
C18
3000 2000 2000 2000 2000 2000 2000
H20 30%MeOH 50% 70% 80% MeOH MeOH/DCM
2.Hl 2.H2 2.H3 2.H4 2.H5 2.H6 2.H7
306.0 g 69.0 g 7.1 g 1.7 g 1.2 g 2.5 g 2.9 g
>1250000 >125000 >125000 11000 <975 2800 26000
(<2450) (<5520) (<570) (1550) (>12300) (8930) (1120)
diol
I
250 150 150 150 150 150 150 150 150 150 250
DCM 50% EtOAc EtOAc 5%MeOH 10% 10% 20% 20% 50% 50% MeOH
I I I I I I I I I I I
2.11 2.12 2.13 2.14 2.15 2.16 2.17 2.18 2.19 2.110 2.111
94mg 193 mg 85 mg 54mg 41 mg 48mg 61 mg 51 mg 248mg 59mg 115mg
7800 >12500 >12500 >12500 560 530 200 >12500 260 1260 3190
(121) (<154) (<68) (<43) (732) (905) (3050) (<41) (9538) (468) (361)
~0
H)LH-20
200 35 35 35 35 50 75 (MeOH)
2.Jl 2.J2 2.J3 2.J4 2.J5 2.J6 2.J7
33mg 22mg 32mg 22mg 14mg 23mg 1 mg
>2500 >2500 >2500 2200 500 70 490
(<132) (<88) (<128) (100) (280) (3286) (20)
175 35 35 35 50 50 75
I I I I I I I
2.Kl 2.K2 2.K3 2.K4 2.K5 2.K6 2.K7
48mg 58mg 29mg 17mg 13 mg 5.3 mg 4.1 mg
>2500 >2500 >2500 1660 220 <<19.5 <<19.5
(<192) (<232) (<116) (102) (591) (»2718X»2103)
LH-20
r
(50% MeOH/DCM)
2.Ll 2.L2 2.L3 2.L4 2.L5 2.L6 2.L7
2.4mg 0.8mg 0.6mg 2.3 mg 1.2 mg 2.6mg 1.9 mg
3
For Legend See Scheme 2.2.1 (8667) Scheme 2.2.2 Isolation Scheme for The P388 Cytotoxic
Fraction 2.19 was separated into 2.K1 - 2.K7 on LH -20 gel permeation chromatography (Scheme 2.2.2). Fractions 2.K6 and 2.K7 exhibited very potent P388 cytotoxicity with ICso values of<< 19.5 ng/mL.
The 1 H NMR spectra of 2.K6 and 2.K7 illustrated many well defined peaks, common to both fractions. Multiple signals in the 3 - 4 ppm region were characteristic of a polyether compound. This confirmed the earlier assumption that the compound(s) exhibiting P388 cytotoxicity had similar characteristics to those of the conjugated brevetoxins.
Final purification was achieved by fractionating 2.K6 and 2.K7 on a second LH-20 column to give 2.L6 (Scheme 2.2.2) as 2.6 mg of pure toxin, exhibiting a very potent P388 cytotoxicity, with an ICso value of 3 ng/mL.
The 1 H NMR spectrum of 2.L6 demonstrated signals different from
BTX with olefinic resonances at
o
6.35, 5.91, 5.86, 5.12, 5.10 and 4.84 ppm, suggesting an entirely different compound.YTX (19)
2.3
Conclusions
The toxins responsible for the outbreak in seafood poisoning and respiratory irritation, around Coromandel Peninsula, in early 1993, were isolated and characterised by two Japanese research groups. These compounds were identified as polar brevetoxin-B conjugates, viz BTX-Bl - BTX-B4.76•77•78
Y essotoxin (YTX) was isolated as the major P388 cytotoxic compound from these shellfish as part of this research. The extremely low levels of YTX in the shellfish suggested that the toxin was probably not a public health concern. However, this research was the first to identify YTX in New Zealand.
3. 1
Introduction
Yessotoxin (YTX, 19) was isolated from the New Zealand green lipped mussel, Perna canaliculus, harvested from the Coromandel Peninsula
during the toxic shellfish outbreak in early 1993. YTX is a previously isolated shellfish toxin from J apan24 and the confirmation of its structure is detailed in Section 3 .2.
YTX (19)
The relative31 and absolute32 stereochemistry of YTX has only recently been published. However partial elucidation of the relative stereochemistry of YTX was performed independently as part of this research topic. This work is described in Section 3.3.
YTX exhibits potent cytotoxicity against the P388 murine leukaemia cell line (ICso
=
3 ng/mL) and shows cytotoxicity towards rat hepatocytes. 80 Other studies revealed that YTX induces acute heart failure in mice when administered intra-peritoneally (i.p.) (LDso=
286For multi-component toxin systems, such as the "DSP shellfish poison complex", the mouse bioassay is unable to distinguish between the individual toxins in the system. The toxicity of YTX, observed in the mouse bioassay, requires the development of a more selective support assay to quantify the toxin in commercial shellfish samples. The rat hepatocyte assay, 80 used in conjunction with the mouse bioassay, for DSP toxins, is reasonably selective, although it provides no quantitative measure of the individual toxins. The most promising assay for detection of YTX is likely to be a YTX -specific ELISA. The development of an ELISA requires modification of the target compound. The modification of YTX for development of a YTX-specific ELISA is described in Section 3.4.
3.2
Spectroscopic Assignment of YTX
Negative ion LRFABMS (Low Resolution Fast Atom Bombardment
Mass Spectrometry) on a pure sample of YTX revealed an ion at mlz
1163.5. This ion corresponded closely to the published value of mlz
1163 (M-Na)- for YTX. Subsequent positive ion HRFABMS (High Resolution Fast A tom Bombardment Mass Spectrometry) was
performed on the mlz 1163.5 ion for accurate mass measurement.
Acceptable high resolution mass determination was achieved, with the caesium adduct of YTX, which gave an ion with m/z 1539.1680
corresponding to [M-2Na+3Cs]+ (CssHso021S2Cs3).
A full spectroscopic NMR assignment of YTX was essential for conclusive proof of chemical structure. This was achieved by 1 H, 13C, COSY (COrrelation SpectroscopY) and HMQC (Heteronuclear Multiple Quantum Coherence) NMR experiments.
Ttlble
3.2.1
Comparisons Between Published (CpP4 andObserved 13C NMR Data YTX
Position
o
Cp0 Co
Position ()0 Co
Position ()0 Co
1 65.1 65.1 20 82.4 82.5 38 39.0 39.0
2 40.1 40.2 21 33.2 33.1 39 143.1 143.1
3 76.5 76.6 22 87.3 87.4 40 85.1 85.2
4 78.4 78.4 23 77.0 77.0 41 78.4 78.4
5 32.8 32.8 24 47.0 47.0 42 136.7 136.7
6 78.4 78.4 25 32.8 32.8 43 130.6 130.6
7 70.6 70.6 26 40.8 40.8 44 145.4 145.5
8 36.5 36.5 27 89.4 89.5 45 37.8 37.8
9 78.3 78.3 28 84.1 84.1 46 137.5 137.6
10 78.3 78.3 29 40.0 40.0 47 116.6 116.5
11 36.2 36.2 30 73.2 73.3 48 16.4 16.3
12 77.6 77.6 31 79.6 79.6 49 23.9 23.9
13 78.1 78.1 32 73.8 73.8 50 20.7 20.7
14 38.0 38.0 33 76.7 76.8 51 22.4 22.3
15 81.1 81.1 34 73.2 73.2 52 15.4 15.3
16 82.2 82.2 35 31.7 31.7 53 115.7 115.7
17 30.3 30.3 36 73.1 73.0 54 26.2 26.2
18 41.1 41.1 37 73.0 73.0 55 116.6 116.5
19 78.4 78.4
47
51
YTX (19)
Three
-Yessotoxin
Fig
3.2.1
lH
NMR
Spectrum
of
Yessotoxin
(CD30D)
62
0
t"l
lO
t"l
0
~
lO
The olefinic resonances 8 5.85 (H46), 8 6.27 (H43) and 8 5.81 (H42) ppm were well isolated and assigned by direct comparison with published data. The COSY spectrum showed correlations from 8 5.85 (H46) to two further resonances at 8 5.03 and 2.95 ppm, completing the H45-H47 spin system and allowing the assignment of both H47 as 8 5.03/5.03 and H45 as 8 2.95/2.95 ppm.
All six methyl resonances in the 1 H NMR spectrum were assigned
conclusively by observation of lfcH couplings, from their respective carbon atoms, in an HMQC experiment.
Geminal coupling between proton resonances at 8 5.07 and 4.96 ppm in the COSY spectrum suggested their assignment as an olefinic methylene. Assignment of these resonances as H55 was achieved by observation of an allylic COSY correlation to 8 2.95 (H45). The remaining olefinic resonances at 8 5.00 and 4.77 ppm, exhibited geminal coupling to each other and were assigned as H53.
published proton chemical shift data, leading to the assignment of all protons in that system (Table 3.2.2).
Resonances at 8 4.19 (H1) and 8 4.22 (H4) were well removed from other resonances in the 1 H NMR spectrum and were assigned by direct comparison with published data. COSY correlations from
8
4.19 (H1) to two other resonances at8
2.30/1.90 ppm, were observed and assigned as the methylene protons belonging to H2. COSY correlations from 8 4.22 (H4) established the spin system only as far as H6 (Table 3.2.2). This was due to inadequate resolution of signals, close in chemical shift, which lay further along the spin system. An attempt at solving the spin system by the use of an HMBC (H eteronuclear MultiBond Coherence) NMR experiment was unsuccessful. The small amount of toxin was the major contributing factor as poor quality data was obtained in the HMBC experiment. This made further structural assignments by this method impossible.Table 3.2.2 Comparisons Between Published (Hpj24 and
Observed (H0 ) 1 H NMR Data for YTX
Position 8 H~
o
Ho Positiono
H~o
Ho Positiono
H~o
Ho1 4.24 4.19 17 1.84 36 4.09 4.05
1 4.24 4.19 18 1.89 37 3.43 3.40
2 2.21 2.30 18 1.83 38 2.75 2.73
2 1.99 1.90 20 3.46 38 2.47 2.42
4 4.26 4.22 21 1.97 40 3.92 3.86
5 1.77 1.70 21 1.79 42 5.86 5.81
5 2.60 2.55 22 3.53 43 6.35 6.27
6 3.09 3.10 24 1.77 1.75 45 3.00 2.95
7 3.36 24 1.54 1.50 45 3.00 2.95
8 2.22 25 1.75 1.75 46 5.91 5.85
8 1.44 25 1.51 1.50 47 5.12 5.03
9 3.18 26 1.74 1.65 47 5.10 5.03
10 3.16 27 2.81 2.75 48 1.31 1.25
11 2.30 28 3.34 3.30 49 1.29 1.24
11 1.45 29 2.32 2.25 50 1.20 1.14
12 3.06 29 1.58 1.49 51 1.74 1.01
13 3.12 30 3.64 3.61 52 1.25 1.19
14 2.34 31 3.22 3.25 53 5.05 5.00
14 1.47 32 3.89 3.84 53 4.84 4.77
15 3.37 34 3.80 3.76 54 1.43 1.37
16 3.26 35 2.14 2.07 55 5.09 5.07
17 1.99 35 1.53 1.47 55 5.01 4.96
3. 3
Stereochemical Assignment of YTX
3.3.1 Desulfation of YTX
The quality of the NMR data acquired on YTX was insufficient to carry out a stereochemical study. In addition to dealing with small amounts of sample, the data quality was affected by the need to use CD 3 OD as the NMR solvent. This was a consequence of the
insolubility of YTX in CDCb. The insolubility of YTX in CDCb is an inevitable result of the two sulfate functional groups at Cl and C4.
Removal of the sulfate groups was achieved by refluxing YTX in a solution of 50% pyridine/1,4-dioxane. After work-up, 0.8 mg of pure desulfated YTX, was achieved. The desulfated YTX used in this study is hereafter referred to as D-YTX ( 44).
55
43
HQ
/;
~
54 ~ 45 47
53
3.3.2
Spectroscopic Assignment of D- YTXPositive ion LRFABMS on D-YTX revealed a base peak at m/z 965.5, assigned as [M-H20+H]+. Subsequent HRFABMS was performed on this ion, (accurate mass 965.5619 corresponding to CssHs1 014, [M-H20+H]+). From this, a molecular formula of CssHs20 15 was confirmed for D-YTX.
The low sample mass restricted the use of NMR experiments solely to 1 H nuclei. As a result, a multitude of 1 H based NMR experiments were carried out on D-YTX, including; 1 H, TOCSY (TOtal Correlation SpectroscopY), NOESY (Nuclear Overhauser and Exchange SpectroscopY) and selective lD-TOCSY and NOE (Nuclear Overhauser Effect) experiments.
Proton assignments were made for rings G-K in the following manner:
D-YTX (44)
were virtually identical in chemical shifts to those in YTX and, as such, were assigned by direct comparison. The olefinic region of D-YTX was also assigned predominantly by comparison with that of YTX (Fig 3.3.1). However, a TOCSY experiment was needed to locate H53 (8 5.09), which was concealed by the H47 resonances (8 5.09). The TOCSY spectrum was also used to assign both H55 methylene protons at 8 5.04/5.01.
(b)
H43
(a)
H43
6.4 6.2
Fig 3.3.1
H42
H46
H42
H46
6.0 5.8 5.6 5.4
H47 ---t f--HOD
H53/H47 ---t
5.2
H53
JH55
J
H53H55
H
H535.0 4.8 ppm
lH NMR Spectra of Olefinic Regions of (a) D-YTX and (b) YTX
(H27) and 8 2.49 (H38), were well resolved and able to be assigned by direct comparison with those in YTX (Fig 3.3.2). The latter three proton positions served as ideal entry points for both 2D and 1D TOCSY NMR experiments, allowing the assignment of the other resonances in rings G-K.
Hl/H4
(b)
(a)
H40
H40 H32
.j
H32
.j
4.4 4.2 4.0 3.8 3.6 3.4 3.2 3.0 2.8 2.6 2.4 2.2 2.0 1.8 ppm
Fig 3.3.2 lH NMR Spectra of Ether Regions of(a) D-YTX and
(b) YTX
Long range allylic coupling was observed in the 2D TOCSY spectrum from the exocyclic methylene at
8
5.09/4.87 (H53), to the methylene at 8 2.49 (H38). A trace through the resonance at 8 2.49 (H38), revealed correlations to8
5.09, 4.87 (H53) and further unassigned resonances8
[image:75.595.89.503.239.561.2](c) 50 ms
(b) 25 ms
(a) 10 ms H37
4.4 4.2 4.0 3.8 3.6 3.4 3.2 3.0 2.8 2.6 2.4 2.2 2.0 1.8 ppm
Fig 3.3.3 1D TOCSY Spectrum of D-YTX With Excitation At H38 and Mixing Times of(a) 10 ms, (b) 25 ms, (c) 50 ms and (d) 100 ms
At a mixing time of 10 ms (Fig 3.3.3(a)), one strong correlation to () 3.42 was observed and assigned as H37. At 25 ms (Fig 3.3.3(b)), additional strong correlations could be seen for () 3.80 and weak correlations for () 1.57. These were assigned as H36 methine and one diastereotopic H35 methylene proton respectively. At 50 ms (Fig 3.3.3(c)), a further correlation appeared at () 3.68 (H34). In addition, the resonance at () 1.57 (H35) was of increased strength and a weak signal, at () 2.11 (H35), was observed. The trace, at a mixing time of 100 ms (Fig 3.3.3(d)), confirmed the correlation to() 2.11 (H35). This completed the assignment of the spin system H38-H34.
second 1D TOCSY, using excitation at 8 3.90 (H32), was used to assign the sequence of resonances along the spin system (Fig 3.3.4).
(c) 100 ms
(b) 50 ms
~H32 H31
(a) 10 ms
4.4 4.2 4.0 3.8 3.6 3.4 3.2 3.0 2.8 2.6 2.4 2.2 2.0 1.8
Fig 3.3.4 1D TOCSY Spectrum of D-YTX, With Excitation At H32
and Mixing Times of(a) 10 ms, (b) 50 ms and (c) 100 ms
At a mixing time of 10 ms (Fig 3.3.4(a)), a strong correlation was observed to 8 3.11 and assigned as H31. At 50 ms (Fig 3. 3 .4(b)) an additional correlation was observed to
8
3.61, accordingly assigned as H30. At 100 ms (Fig 3.3.4(c)), further correlations were observed to8
2.31/1.56 (H29). No further correlations were observed from H32.
by a third 1D TOCSY experiment, using excitation at
8
2.73 (H27) (Fig 3.3.5) and various mixing times.(c) 100 ms
(b) 25 ms
(a) 10 ms H26
Fig 3.3.5 1D TOCSY Spectrum of D-YTX, With Excitation At H27 and Mixing Times of(a) 10 ms, (b) 25 ms and (c) 100 ms
3.3.3
Conformations of Rings G-K In D- YTX
Conformational elucidation for rings G-K of D-YTX was made by measurement of observed coupling constants. Estimation of dihedral angles, from coupling constants, was achieved by consideration of the Karplus equation. 81
Analysis of the coupling constants between protons on rings G-K, was achieved by direct measurement of well resolved signals in the lH NMR spectra and by measurement of signals, resolved by lD TOCSY traces. In addition, various couplings were "removed" in lD TOCSY experiments, by the decoupling of selected resonances during the acquisition of data. This simplified some multiplets and allowed assessment of coupling patterns. The measurement of coupling constants could then be achieved both for the simplified multiplet and, by subtraction, the coupling removed.
H36 (c)
(b)
4.4 4.2 4.0
H35ax decoupled
2.4 2.2 2.0 1.8 ppm
Fig 3.3.6 ID TOCSY Spectrum of D-YTX With Excitation At H38
and Decoupling At (a) H36, (b) H37, (c), H35eq and (d) H35ax
Decoupling at
8
3.80 (H36) (Fig 3.3.6(a)) collapsed8
3.42 (H37) to a triplet (J=
7.9, 7.6), with the couplings assigned as 3fH37H38ax and3fH37H38eq· By subtraction, the coupling of 3fH37/H36 was shown as
large and approximately 8.5 Hz. This corresponds most closely to a dihedral angle of ca. 180° and, consequently, a trans-linked ring junction at H36/H37. The approximately equal couplings, of ca. 8 Hz for both 3fH37H38ax and 3fH37H38eq, are not consistent with a chair conformation for ring K. In particular, the 3fH37H38eq coupling constant would be expected to be small due to the dihedral angle being close to 90° for these protons. A more plausible explanation would be if ring K adopted a twisted chair conformation as shown in Fig 3.3.7.
The dihedral angles of the H37 /H38 protons are more clearly shown by the Newman projections (Fig 3.3.8) of both the chair (Fig 3.3.8(a)) and twisted chair (Fig 3.3.8(b)) conformations for ring K. The dihedral angle of H37/H38eq is close to 90° for the chair conformation, however is close to 0° for the twisted chair conformation.
(a)
/ l1arge
0"1111
H
H
38cq53 (b)
I large
H \ l1 arge 36 38ax /
H:t~
3?38eq
H
Fig 3.3.8 Newman Projections for (a) Chair and (b) Twisted Chair
Conformations for Ring K of D- YTX
Decoupling at
8
3.42 (H37) (Fig 3.3.6(b)) c llapsed8
2.49 (H38) to a singlet, revealing the vicinal 3JH38H37 coupling of 7.3 Hz.The conformation of ring J was proposed a follows:
and o 3.68 (H34). This showed small couplings from H36 and H34 too 2.11, assigning this resonance as equatorial H35. This was supported by decoupling at the other H35 resonance (1.57 ppm) (Fig 3.3.6(d)), which led to the collapse of o 3.80 (H36) to a doublet and o 3.68 (H34) to a singlet, assigning o 1.57 as axial H35. The coupling seen in the doublet o 3.80 J = 8.0, could only be explained by a trans orientation
from H37 to H36, further supporting the trans-linked ring junction