ORIGINAL RESEARCH
Hemodynamics of Cerebral Aneurysm Initiation:
The Role of Wall Shear Stress and Spatial Wall
Shear Stress Gradient
Z. Kulcsa´r A´ . Ugron M. Marosfo˝ i
Z. Berentei G. Paa´l I. Szikora
BACKGROUND AND PURPOSE: Cerebral aneurysms are preferentially located at arterial curvatures and bifurcations that are exposed to major hemodynamic forces, increasingly implicated in the life cycle of aneurysms. By observing the natural history of aneurysm formation from its preaneurysm state, we aimed to examine the hemodynamic microenvironment related to aneurysm initiation at certain arterial segments later developing an aneurysm.
MATERIALS AND METHODS: The 3 patients included in the study underwent cerebral angiography with 3D reconstruction before a true aneurysm developed. The arterial geometries obtained from the 3D-DSA models were used for flow simulation by using finite-volume modeling. The WSS and SWSSG at the site of the future aneurysm and the flow characteristics of the developed aneurysms were analyzed.
RESULTS: The analyzed regions of interest demonstrated significantly increased WSS, accompanied by an increased positive SWSSG in the adjacent proximal region. The WSS reached values of⬎5 times the temporal average values of the parent vessel, whereas the SWSSG approximated or exceeded peaks of 40 Pa/mm in all 3 cases. All patients developed an aneurysm within 2 years, 1 of which ruptured.
CONCLUSIONS:The results of this hemodynamic study, in accordance with the clinical follow-up, suggest that the combination of high WSS and high positive SWSSG focused on a small segment of the arterial wall may have a role in the initiation process of aneurysm formation.
ABBREVIATIONS:AcomA⫽anterior communicating artery; AFI⫽aneurysm formation indicator; CFD⫽ computational fluid dynamics; DSA⫽ digital subtraction angiography; GON⫽ gradient oscillatory number; ICA⫽internal carotid artery; MRA⫽MR angiography; PcomA⫽posterior communicating artery; SWSSG⫽spatial wall shear stress gradient; WSS⫽wall shear stress; WSSg⫽wall shear stress gradient
D
uring the past, intensive research has been focused on the role of hemodynamic forces in arterial pathologies. Cere-bral aneurysms are preferentially located at the outer curva-tures, bifurcations, or branching points of the brain vessels. As shown by CFD modeling, these vascular segments are affected by complex hemodynamic forces, including impinging flow and alteration of the WSS,1-3which may induce pathologicremodeling of the vascular structure, transmitted by the endo-thelial cells.4-6
The hemodynamic microenvironment that may be trig-gering the initiation of aneurysm formation has not yet
been clearly elucidated. Animal studies on artificially cre-ated vessel bifurcations, combined with CFD simulations, have suggested the coexistence of increased WSS and posi-tive SWSSG at the bifurcation as triggers of aneurysm ini-tiation, and this was supported by histologic findings.7,8
CFD studies on real human vessels harboring a sidewall aneurysm were also performed after virtual removal of the aneurysm, focusing on the affected vascular segment at its assumed “healthy” state.9,10 Mantha et al9 suggested that
stagnation zones, with an area of relatively low and rotating WSSs coincide with aneurysm-formation locations, and they introduced the AFI index for the detection of these zones. However, Shimogonya et al10could not reproduce
the correlation of either the AFI or the SWSSG with the location of aneurysm formation, and they introduced the GON for this purpose, which represents the fluctuation of SWSSG integrated over 1 pulse cycle. In these studies, only sidewall aneurysms were included, and the vascular geom-etry was artificially reconstructed to its assumed preaneu-rysmal state, insinuating that vessel wall remodeling does not take place during the process of aneurysm development and growth.
In observing the natural history of aneurysm formation from its preaneurysm state, our purpose was to examine the hemodynamic microenvironment related to aneurysm initia-tion at certain arterial segments later developing an aneurysm. The available 3D-DSA images, representing the true situation Received May 7, 2010; accepted after revision August 12.
From the Department of Interventional Neuroradiology (Z.K., M.M., Z.B., I.S.), National Neuroscience Institute, Budapest, Hungary; Department of Neuroradiology (Z.K.), Hirs-landen Clinic, Zurich, Switzerland; and Department of Hydrodynamic Systems (G.P.), Budapest University of Technology and Economics, Budapest, Hungary.
This work was partially supported by a grant from the Hungarian National Scientific and Research Fund (OTKA 73773), and by the “O¨veges Jo´zsef” PhD scholarship of GE Hungary ZRt Healthcare Division. This work is also related to the scientific program of the “Development of Quality-Oriented and Harmonized R⫹D⫹I Strategy and Functional Model at the BUTE” project. That project is supported by the New Hungary Development Plan (project ID: TA´MOP-4.2.1/B-09/1/KMR-2010 – 0002).
Please address correspondence to Istva´n Szikora, MD, PhD, Department of Interventional Neuroradiology, National Neuroscience Institute, Budapest, Hungary, Amerikai ut 57, Budapest 1145, Hungary; e-mail: [email protected]
Indicates open access to non-subscribers at www.ajnr.org
DOI 10.3174/ajnr.A2339
INTERVENTIONAL
ORIGINAL
before aneurysm initiation at both sidewall and bifurcation locations, provided a basis for CFD simulations.
Materials and Methods
Three patients who were scanned from the introduction of 3D-DSA imaging at our institution and for 9 years after were selected for anal-ysis. During the follow-up, these patients developed a saccular aneu-rysm at a location where, at the time of the initial angiogram including 3D-DSA, no aneurysm was present (2 patients) or only a small aneu-rysm-like dilation was demonstrated (1 patient). The studies were obtained due to ruptured (2 cases) and incidentally discovered aneu-rysms (1 case) at different locations from the studied segments. Med-ical history, risk factors, and the time between the initial angiogram and the follow-up studies showing a developed aneurysm were re-corded for all patients.
CFD modeling was performed in all 3 patients at baseline and also in 2 patients after aneurysm development. The CFD modeling was performed similarly, as previously described.11,12Briefly, the initial 3D rotational angiography obtained by a LCV⫹ DSA unit (GE Healthcare, Chalfont St. Giles, United Kingdom) was reconstructed by using an Advantage Windows workstation with ADW 4.2 recon-struction software (GE Healthcare, Milwaukee, Wisconsin). The 3D image data base was then converted to a 3D surface. The commercially available ICEM CFD 11.0 (ANSYS, Canonsburg, Pennsylvania) was used to generate an advanced tetrahedral mesh inside the extracted surface. To have a good numeric resolution near the vessel wall, we used 5 layers of prismatic cells in all cases. The mesh sizes were ap-proximately 350,000, 550,000, and 800,000 elements for patients 1, 2, and 3, respectively. The maximum element size was approximately 0.3 mm in all cases. Flow was then simulated in the resulting finite-volume model assuming the circulating fluid to be Newtonian and incompressible with an attenuation of 1050 kg/m3and a viscosity of 0.003 kg/m/s. Vessels were considered to be rigid tubes. Flow was simulated by using the CFX 11.0 commercial software (ANSYS). The analytic cardiac cycle was 0.8 seconds with a time-step of 0.01 sec-onds, so that 1 cycle comprised 80 time-steps.
We simulated a total of 3 cycles, making sure that the initial tran-sients disappeared. Flow was considered pulsatile with a synthetic inlet velocity function reproducing a realistic shape of the cardiac function. The mean inlet velocity varies between 1 and 0.37 m/s within 1 cardiac cycle with a parabolic distribution in space. Constant pressure was used as the outlet boundary condition, preceded by an additional artificial resistance. The resistance was modeled as a po-rous layer on the basis of Darcy’s law by taking only the part of the pressure loss into account that is linearly proportional with the veloc-ity. The parameters of the outlet boundary were set on the basis of the nature of the peripheral resistance and the almost constant pressure at the level of capillaries. The parameters were chosen so that the fluc-tuation of the average pressure level in the region under investigation remained between 80 and 120 mm Hg. This method leads to a velocity and pressure field inside the studied vessel segments fluctuating in the same phase.
Local flow fields of the affected vascular segment, namely of the basilar bifurcation (patient 1), the superior wall of the C2 segment of the ICA (patient 2), and of the PcomA origin (patient 3) were deter-mined by CFD analysis. CFD gave the velocity field, surface distribu-tions of relative surface pressure on the wall, luminal WSS, and SWSSG. Comparing the initial and the follow-up 3D-DSA images, we defined the vascular segment of interest in which the aneurysm devel-oped. At this segment in alignment with blood flow, a virtual line was
drawn, along which WSS and SWSSG was measured. The local flow fields were also determined on 2 models with the developed aneu-rysms, in which a 3D-DSA was performed after the formation of the aneurysm. The third patient, with an aneurysm at the basilar bifurca-tion, refused checkup angiograms, and she was followed with MR angiography, so a 3D-DSA for CFD modeling was not available in this case.
Results
Patients and Hemodynamic Microenvironment
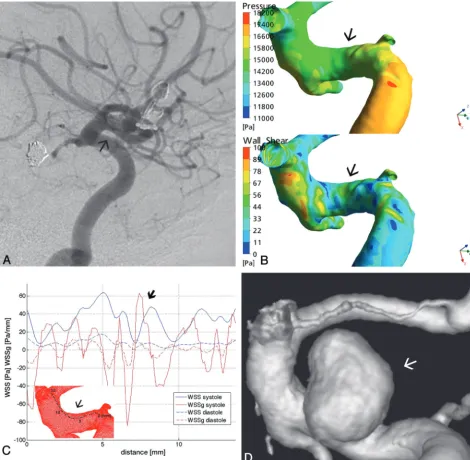
Case 1.A 52-year-old woman with a history of severe
obe-sity and hypertension was admitted with a ruptured 6-mm basilar tip aneurysm. During the hospital stay, the aneurysm endogenously thrombosed and demonstrated healing and complete remodeling of the basilar bifurcation, as previously described.13Because the aneurysm did not show any signs of
recurrence until 20 months, we assume that endogenous thrombus formation was subsequently followed by shrinkage of the aneurysm and remodeling of the basilar bifurcation. On the 20-month follow-up MR imaging and MRA, a small 3-mm regrown aneurysm was observed at the level of the former aneurysm neck, which remained unchanged during the fol-lowing 5 years (Fig 1). A 3D-DSA for CFD simulations was performed at the 3-month follow-up, when the basilar apex showed a complete remodeling, without an aneurysm remnant.
At the basilar apex, the surface pressure was relatively high compared with neighboring areas (Fig 1B). The numeric val-ues of the pressure are not given because as a characteristic of incompressible flow with rigid walls, only the pressure gradi-ents are relevant in the formation of the flow. The same flow field would result with an arbitrary constant added to the pres-sure field. The temporal average of the WSS in the parent vessel was 7 Pa. The WSS detected along the predefined line showed extremely high values, reaching nearly 40 Pa at peak systole, almost 6 times the average value. The WSS at its peak was immediately preceded by a short approximately 1-mm-long area, where the SWSSG showed a positive peak, exceed-ing 40 Pa/mm (Fig 1C). The proximal edge of the later-form-ing aneurysm neck matched this area under high hemodynamic stress (Fig 1D).
Case 2. A 44-year-old female patient, with a history of
smoking, was treated due to a ruptured AcomA aneurysm and an unruptured basilar bifurcation aneurysm. Twenty-five months later, she developed an 8-mm aneurysm at the upper wall of the C2 segment of the right ICA (Fig 2). The 3D-DSA for CFD simulations was obtained at the time of the AcomA aneurysm rupture, when no aneurysm was present at the C2 segment, and also 25 months later, with the already-developed aneurysm.
undu-lating pattern, with a second more significant peak at approx-imately 7 mm, reaching⬎60 Pa/mm, which was also accom-panied by an increased, though smaller, WSS peak compared with the previous one. These latter peaks of WSS and SWSSG fell into the future neck area (Fig 2C, -D).
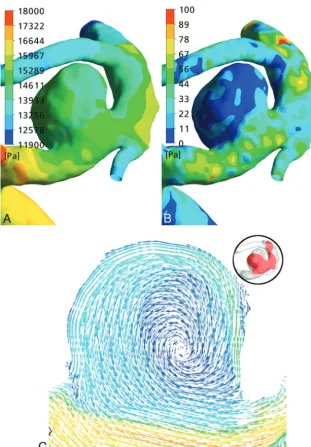
The fluid dynamic analysis of the model with the developed aneurysm showed a relatively uniform surface pressure distri-bution on the aneurysm wall, which was lower compared with the proximal parent artery (Fig 3A). The WSS was elevated at the edges, more significantly at the proximal and distal edges of the aneurysm neck (Fig 3B). The WSS map showed ampli-tude increases along the inflow and outflow regions through-out the cardiac cycle but withthrough-out temporal and spatial oscilla-tions. The flow field demonstrated 1 dominating vortex inside the aneurysm, which remained stable throughout the cardiac cycle, and showed no definable impingement region (Fig 3C).
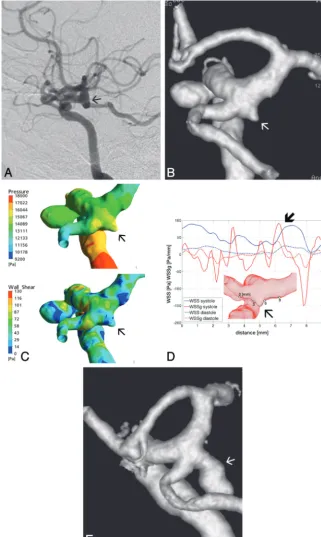
Case 3.A 58-year-old female patient was first treated for an
incidentally discovered right 4-mm carotid cave aneurysm. At the time of the treatment, a tiny aneurysm-like dilation was observed at the origin of the right PcomA. Twenty-three months later the patient had a subarachnoid hemorrhage from the PcomA aneurysm, which had grown to an 8-mm size (Fig
4). The 3D-DSA used for CFD simulations was obtained at the time of the carotid cave aneurysm treatment, when only a tiny aneurysm beginning was present at the PcomA origin.
[image:3.594.56.529.45.416.2]at this point for the distal carotid artery and the PcomA) (Fig 4D, -E).
The flow dynamic analysis of the developed and rup-tured aneurysm showed an evenly distributed elevated pressure at the aneurysm surface (Fig 5A). The WSS map showed an elevated WSS at the proximal medial and distal edge of the aneurysm neck and an oscillating pattern in the aneurysm dome throughout the cardiac cycle, with increas-ing values at peak systole (Fig 5B). Studying the flow field, we found a highly unsteady flow region near the aneurysm neck. The velocity distribution inside the aneurysm dem-onstrated a relatively small inflow jet, a changing small im-pingement region, and multiple changing intra-aneurysmal vortices (Fig 5C).
Discussion
By observing the natural history of aneurysm formation from its preaneurysm state and by using 3D reconstructions of the vascular segments not yet harboring a true aneurysm, we have performed CFD analysis at both sidewall and bifurcation ar-terial segments where aneurysms later developed. Increased WSS accompanied by high positive SWSSG was found at the sites of future aneurysms, potential factors involved in aneu-rysm initiation.
[image:4.594.58.528.44.504.2]WSS.1,2Both of these measures are significantly influenced by the vessel geometry and, thus, may show significant interindi-vidual differences.1 The seeming relationship between
ele-vated stresses and the preferential locations of cerebral aneu-rysm was further strengthened by research on the biologic response of the vessel wall to these mechanical stimuli. It has been suggested that normal functioning of the endothelial cells is mediated through WSS5,14and that high WSS is linked
to different biologic reactions, such as increased metallopro-teinase15and nitric oxide production,16,17which may play a
role in pathologic vessel wall remodeling and aneurysm formation.
Although intra-aneurysmal hemodynamics has been quite extensively studied and linked to aneurysm growth and rup-ture risk,18-21much less is known about the specific
hemody-namic microenvironment, which may initiate aneurysm for-mation. Besides the incriminated high WSS, effort has been
made to identify other hemodynamic measures that may play a role in this process, like the oscillatory shear index,22the
GON,10and the AFI.9In animal models of artificially created
bifurcations, hemodynamics was related to biologic reaction and concomitant vessel wall remodeling, as proved by histol-ogy.7,8Wang et al associated the combination of increased
WSS and high positive SWSSG with specific molecular alter-ations in the vessel wall, which were formerly implicated in aneurysm formation.17They speculated that a high positive SWSSG may compromise the normal physiologic response of the endothelial cells to high WSS. The stretching forces exerted by the shear stress gradient would loosen the intercellular con-tact between the endothelial cells, leading to the onset of de-structive remodeling.
[image:5.594.135.446.43.490.2]tions were performed on vessels harboring a sidewall aneu-rysm, after artificial reconstruction of the parent vessel by computational methods.10Shimogonya et al10have suggested
that the fluctuation of the SWSSG over 1 pulse cycle, as mea-sured by the GON, may have a better prognostic value. These results are not necessarily contradictory to our findings, be-cause we could also show an important amplitude difference in the systolic and diastolic SWSSG in all 3 cases (Figs 1C, 2C,
and 4D), also suggesting the temporal fluctuation of the SWSSG over the cardiac cycle. On the other hand, the reason for this apparent discrepancy might be related to the fact that the hemodynamic environment may differ at a bifurcation and at a sidewall location. Second, the artificially recreated vascular segment in the study by Shimogonya et al10may not
[image:6.594.134.455.45.582.2]vascular anatomy. Changing geometry has a very important impact on flow fields,1meaning the retrospective
reconstruc-tion of a parent vessel may not necessarily show the same flow patterns as at baseline. On the basis of these principles, in our study, we focused on the analysis of WSS and SWSSG, and our cases could reflect both sidewall and bifurcation locations.
The relative surface pressure at the affected segments was increased in all 3 patients. In those 2 patients in whom origi-nally no aneurysm was present, the high peak in WSS and the SWSSG peak presented exactly at the site of the proximal edge of the neck of the aneurysm that developed later. The WSS values at these points were at least 5 times higher than the temporal average values of the parent vessel. One can assume that the initial destructive changes in the vessel wall, like rup-ture of the internal elastic lamina and weakening of the mus-cular layer, take place at the site of the highest hemodynamic stress. However, the combination and the relative magnitudes
of WSS and SWSSG at similar vascular segments of healthy individuals not developing an aneurysm need to be investi-gated. In patient 1, the aneurysm developed at the site of the bifurcation where both of these parameters were increased, whereas on the other side of the bifurcation, both parameters were closer to normal, a condition that may also reflect the importance of individual vascular anatomy.
Once an aneurysm beginning is formed, as in patient 3, the hemodynamic microenvironment will change. The major stresses will be shifted to attack a broader area of the aneurysm neck, as shown by the simulation on the models with devel-oped aneurysms. These forces, together with low WSS on the aneurysm wall, may lead to the growth of the aneurysm sac and neck.20,21The hemodynamic analysis of the 2 developed
aneurysms in our patients reflected previously published da-ta.18The flow analysis of the ruptured PcomA aneurysm of
[image:7.594.133.455.40.501.2]ment zones and multiple intra-aneurysmal vortices, described as type IV pattern by Cebral et al.18This flow pattern was
described as most often present in PcomA aneurysms and was also correlated with elevated risk of rupture.18On the other hand, the nonruptured aneurysm of patient 2 demonstrated a stable 1-vortex flow pattern, without a definable impingement zone. This type I flow pattern, defined as the simplest, was specific for unruptured aneurysms.18
The potential significance of our observations may be lim-ited by the low number of patients studied; by the fact that at baseline, 2 of the 3 studied arterial segments (patients 1 and 3) may not be considered as completely healthy at a tissue level; and by the lack of similar measurements on healthy controls not developing an aneurysm.
Conclusions
By observing the natural history of aneurysm formation from its preaneurysm state, in correspondence with previous ani-mal experimental data, the current CFD study with clinical follow-up suggests that the combined presence of increased WSS and high positive SWSSG focused at a small arterial seg-ment may have a role in the initiation process of an aneurysm. Because both of these parameters are relatively easily deduc-ible by CFD simulations, they may be considered for further analysis in this disease process. The exact pathomechanism of how this complex hemodynamic setting will translate to a bi-ologic response also needs further study.
References
1. Alnaes MS, Isaksen J, Mardal KA, et al.Computation of hemodynamics in the circle of Willis.Stroke2007;38:2500 – 05
2. Takeuchi S, Karino T.Flow patterns and distributions of fluid velocity and wall shear stress in the human internal carotid and middle cerebral arteries.
Surg Neurol2009 Oct 22 [Epub ahead of print]
3. Foutrakis GN, Yonas H, Sclabassi RJ.Saccular aneurysm formation in curved and bifurcating arteries.AJNR Am J Neuroradiol1999;20:1309 –17 4. Schirmer CM, Malek AM.Wall shear stress gradient analysis within an
ideal-ized stenosis using non-Newtonian flow.Neurosurgery2007;61:853– 63, dis-cussion 863– 64
5. Malek AM, Alper SL, Izumo S.Hemodynamic shear stress and its role in ath-erosclerosis.JAMA1999;282:2035– 42
6. Resnick N, Yahav H, Shay-Salit A, et al.Fluid shear stress and the vascular endothelium: for better and for worse.Prog Biophys Mol Biol2003;81:177–99 7. Meng H, Swartz DD, Wang Z, et al.A model system for mapping vascular
responses to complex hemodynamics at arterial bifurcations in vivo. Neuro-surgery2006;59:1094 –100, discussion 1100 – 01
8. Meng H, Wang Z, Hoi Y, et al.Complex hemodynamics at the apex of an arterial bifurcation induces vascular remodeling resembling cerebral aneu-rysm initiation.Stroke2007;38:1924 –31
9. Mantha A, Karmonik C, Benndorf G, et al.Hemodynamics in a cerebral artery before and after the formation of an aneurysm.AJNR Am J Neuroradiol
2006;27:1113–18
10. Shimogonya Y, Ishikawa T, Imai Y, et al.Can temporal fluctuation in spatial wall shear stress gradient initiate a cerebral aneurysm? A proposed novel he-modynamic index, the gradient oscillatory number (GON).J Biomech
2009;42:550 –54
11. Szikora I, Paal G, Ugron A, et al.Impact of aneurysmal geometry on intraan-eurysmal flow: a computerized flow simulation study. Neuroradiology
2008;50:411–21
12. Paal G, Ugron A, Szikora I, et al.Flow in simplified and real models of intra-cranial aneurysms.International Journal of Heat and Fluid Flow2007;28:653– 64 13. Kulcsar Z, Berentei Z, Marosfoi M, et al.Thromboembolic complication in-duced stable occlusion of a ruptured basilar tip aneurysm: case report and review of the literature.Interv Neuroradiol2010;16:83– 88
14. Resnick N, Collins T, Atkinson W, et al.Platelet-derived growth factor B chain promoter contains a cis-acting fluid shear-stress-responsive element.Proc Natl Acad Sci U S A1993;90:7908
15. Sho E, Sho M, Singh TM, et al.Arterial enlargement in response to high flow requires early expression of matrix metalloproteinases to degrade extracellu-lar matrix.Exp Mol Pathol2002;73:142–53
16. Fukuda S, Hashimoto N, Naritomi H, et al.Prevention of rat cerebral aneu-rysm formation by inhibition of nitric oxide synthase. Circulation
2000;101:2532–38
17. Wang Z, Kolega J, Hoi Y, et al.Molecular alterations associated with aneurys-mal remodeling are localized in the high hemodynamic stress region of a cre-ated carotid bifurcation.Neurosurgery2009;65:169 –77, discussion 177–78 18. Cebral JR, Castro MA, Burgess JE, et al.Characterization of cerebral
aneu-rysms for assessing risk of rupture by using patient-specific computational hemodynamics models.AJNR Am J Neuroradiol2005;26:2550 –59
19. Cebral JR, Sheridan M, Putman CM.Hemodynamics and bleb formation in intracranial aneurysms.AJNR Am J Neuroradiol2010;31:304 –10
20. Boussel L, Rayz V, McCulloch C, et al.Aneurysm growth occurs at region of low wall shear stress: patient-specific correlation of hemodynamics and growth in a longitudinal study.Stroke2008;39:2997–3002. Epub 2008 Aug 7 21. Jou LD, Lee DH, Morsi H, et al.Wall shear stress on ruptured and unruptured
intracranial aneurysms at the internal carotid artery.AJNR Am J Neuroradiol
2008;29:1761– 67