http://www.scirp.org/journal/ojpsych ISSN Online: 2161-7333 ISSN Print: 2161-7325
DOI: 10.4236/ojpsych.2018.81003 Dec. 20, 2017 35 Open Journal of Psychiatry
Evaluation of Expression Recognition Function
in Autism Spectrum Disorder Using
Near-Infrared Spectroscopy
Kaoru Furukawa
1, Kenji Mori
2, Keiko Mori
2, Saori Nakano
2, Kumi Takahashi
2,
Hiroko Hashimoto
2, Tetsuya Tanioka
21Graduate School of Health Sciences, Tokushima University, Tokushima, Japan
2Institute of Biomedical Sciences, Tokushima University Graduate School, Tokushima, Japan
Abstract
One of the characteristics of Autism Spectrum Disorder (ASD) is social dis-order. The specificity of facial and expression recognition for people with ASD is gathering attention as a factor of this social disorder. The study examined the hemodynamic activities in the prefrontal cortex using near-infrared spectroscopy (NIRS) when a person with ASD performed an expression recognition task. The subjects were twenty males (18 - 22 years old) with ASD and without intellec-tual disabilities. Forty-five healthy males matched for age and sex were included as a control group. In both groups, the degree of autistic tendencies was eva-luated using the Autism-Spectrum Quotient (AQ). Using eight standard emo-tional expressions of Japanese people, two expression recognition tasks were set. An NIRS was used to measure the prefrontal cortex blood mobilization during the expression-processing process. The AQ was significantly higher in the ASD group, while the rate of overall correct expression response was signif-icantly lower (p < 0.001). A negative correlation was found when the relation-ship between the AQ and the rate of overall correct expression response was evaluated by combining the results of the control group with those of the ASD group (ρ = −0.40 p < 0.001). In the automatic expression-processing task, no ac-tivation in the prefrontal cortex was found in either the ASD or the control group. In the conscious expression-processing task, the activation of the left and right lateral prefrontal cortex was weaker in the ASD group compared to the con-trol group. Unlike in the concon-trol group, a mild activation of posterior prefron-tal cortex was found in the ASD group. The expression-processing process of the ASD group was found to be different from that of the control group. NIRS was effective in detecting a brain function disorder in people with ASD during an expression-processing process.
How to cite this paper: Furukawa, K., Mori, K., Mori, K., Nakano, S., Takahashi, K., Hashimoto, H. and Tanioka, T. (2018) Evaluation of Expression Recognition Func-tion in Autism Spectrum Disorder Using Near-Infrared Spectroscopy. Open Journal of Psychiatry, 8, 35-49.
https://doi.org/10.4236/ojpsych.2018.81003
Received: November 27, 2017 Accepted: December 17, 2017 Published: December 20, 2017
Copyright © 2018 by authors and Scientific Research Publishing Inc. This work is licensed under the Creative Commons Attribution International License (CC BY 4.0).
DOI: 10.4236/ojpsych.2018.81003 36 Open Journal of Psychiatry
Keywords
Autism Spectrum Disorder, Near-Infrared Spectroscopy, Autism-Spectrum Quotient, Facial Expression Recognition, Prefrontal Cortex
1. Introduction
Autism Spectrum Disorder (ASD) is a developmental disorder that manifests in infancy. It is characterized by impaired interpersonal communication and reciprocal social interaction, in addition to limited and repetitive patterns of behaviors, in-terests, and activities [1].
Although people with ASD exhibit a diverse pattern of behavior, the specifici-ty in facial and expression recognition is a particularly important research theme. With ASD, the ability to infer others’ intentions and emotions from their expres-sions is impaired [2], and people with ASD often show a prominent deficit in their interpersonal behaviors. Being able to recognize the faces and facial expres-sions of others is greatly involved in social development [3], and the specificity in the recognition of expressions is believed to be a possible foothold for devel-oping a treatment.
There have been reports that people with ASD look at the mouths and noses of others, rather than the eyes, which provide a stronger indication of physical ex-pression [4] [5] [6]. The difficulties of expression recognition in people with ASD may be caused by atypical expression-processing. It was reported that when expres-sion recognition was examined using five types of expresexpres-sion stimuli (happiness, sadness, anger, surprise, and neutral); people with ASD had a lower number of cor-rect responses than those without ASD [5].
In terms of brain regions involved in expression recognition, research using func-tional magnetic resonance imaging (fMRI) and Positron Emission Tomography (PET) revealed that the fusiform gyrus, superior temporal sulcus, amygdala, and inferior frontal gyrus are involved in this process [7] [8] [9] [10]. It has been found that the activation reaction in these brain regions is lower in people with ASD than in those without [11] [12] [13] [14]. Using fMRI, Schultz et al. [14] examined brain activity when people perceived faces and objects. Their results showed that in the face identification task, activation reaction of the fusiform gyrus facial area, which plays an important role in facial perception processing, was found to be lower in the ASD group than in the control group. Meanwhile, the activation reaction of the inferior temporal gyrus was found in the ASD group. Conversely, activation reac-tion of inferior temporal gyrus was found in the control group when perceiving objects.
pro-DOI: 10.4236/ojpsych.2018.81003 37 Open Journal of Psychiatry posed a mirror neuron disorder theory to be part of ASD pathology [11].
A Near-Infrared Spectroscopy (NIRS) is a method of capturing change in ce-rebral blood flow associated with neural activities using near-infrared rays [15]. The fMRI and PET have excellent spatial resolution and are extremely effective in identifying sections exhibiting brain dysfunction. However, there are many difficulties in using fMRI and PET for people with ASD, as well as infants, because of their loud noise, physical restriction, and resulting exposure to radiation. By contrast, a NIRS is small in size and can be carried around [16]. After simply at-taching a probe to the head, it can evaluate brain function easily and non-invasively. Furthermore, NIRS is not restrictive and has the advantage of allowing a real-time measurement when asking the subject to perform a task [17] [18].
In recent years, there have been attempts to use NIRS to evaluate the prefron-tal cortex functions of people with ASD. It has been reported that people with ASD show a decrease in activity in the prefrontal cortex while they are perform-ing verbal fluency and executive function tasks [19] [20]. Kita et al. reported on the functional deficiency in the right inferior frontal gyrus, which is involved in recognizing one’s own face, in children with ASD [21]. Mori et al. [21] examined the activities in the frontal cortex, which is involved in imitation of expressions, of children with ASD and children with typical development. The activation of the inferior frontal gyrus on both sides was found to be significantly lower in child-ren with ASD than in typically developing childchild-ren [21].
On the other hand, Hosokawa et al. examined the relationship between autis-tic tendencies and the frontal cortex blood mobilization in expression recognition tasks in healthy people [22]. Results showed that when a healthy person exhibited thoughts and behavioral patterns characteristic of ASD, it was difficult for them to recognize expressions, and they had decreased prefrontal cortex activity. However, studies that have used NIRS to evaluate the expression recognition function using people with ASD as subjects are still few in number [23] [24].
Using the expressions of fear and happiness, Kamio et al. reported that the au-tomatic processing of emotional faces had been impaired within an ASD group [25]. Nakamura et al. reported that in their PET study, the right hemisphere of the lateral inferior frontal gyrus was activated in healthy subjects during a conscious ex-pression evaluation task [10]. Using the results of these reports, the present study uses two expression-processing tasks: one automatic and one conscious. We used NIRS to examine the blood mobilization in the frontal cortex of people with ASD when they were performing expression recognition tasks.
The objective of this study was to clarify the effectiveness of NIRS in identifying the functional abnormality of the frontal cortex during the expression-processing process of people with ASD.
2. Methods
2.1. Subjects
di-DOI: 10.4236/ojpsych.2018.81003 38 Open Journal of Psychiatry agnosed with ASD. The ASD group comprised of outpatients of Tokushima Uni-versity Hospital who had been diagnosed by a specialist using DSM-V diagnostic criteria [1]. Most of the patients who participated in this study were diagnosed with ASD around 3 years of age. Those who were on medication during the ex-amination, as well as those who exhibited clear symptoms of depression or mental illness, were excluded. Their intellectual level was evaluated using the Wechsler Adult Intelligence Scale, Fourth Edition. The control group was comprised of forty-five healthy, male university students who were matched with the ASD group in terms of age and sex. They attended Tokushima University and had no prob-lems with their academics or general school life. In both groups, the degree of their autistic tendencies was evaluated using the Japanese edition of the Autism-Spectrum Quotient (AQ) [26] [27]. AQ is comprised of fifty items and is a self-administrated evaluation scale in which anyone, including healthy people, can be screened for autistic tendencies. The cut-off point is 33, with higher AQ scores indicating au-tistic tendencies. Each individual filled out the test after undergoing NIRS ex-amination. In the ASD group, subjects and their guardians filled out the AQ to-gether.
2.2. Expression Recognition Task
The expression recognition task was developed by referencing the facial expres-sions that Hosokawa et al. used eight facial expressions (anger, sadness, happiness, contempt, disgust, surprise, fear and neutral) [22]. Static images of Japanese mod-els were selected from the ATR (ATR International Human Information Science Laboratories) face database containing eight facial expressions [28]. This face database includes images of the basic facial expressions of 60 male and 60 female Japanese models. The expressions were created by combining the eight expres-sions of six males and four females. The subject sat on a comfortable chair and viewed the faces on a computer screen. On a 15.6-in (screen size: 34.5 cm × 19.4 cm) laptop, 25 × 19.4 cm photographs of facial expressions were presented. The visual range was approximately 50 cm, but the positions and angles were adjusted so that the photos were easy for the subjects to see according to personal factors such as height and body build. The subjects were asked to identify the sex of each person in the photo and the type of expression they exhibited by touching a piece of paper with “male”, “female”, and the eight expression types printed on it. The paper was positioned in front of the screen where the subjects could easily reach out and indicate with their finger. The subjects were asked not to make ma-jor movements with their head and eyebrows during the testing.
Task 1: automatic expression-processing task
DOI: 10.4236/ojpsych.2018.81003 39 Open Journal of Psychiatry of men and women with the seven non-neutral expressions (happiness, sadness, anger, disgust, surprise, fear, and contempt) were shown randomly every two seconds, and the subjects were asked to select only which gender they were by pointing with their fingers.
Task 2: conscious expression-processing task
This task was to measure the activation reaction when subjects consciously identi-fied the facial expression. The same computer and photographs of facial expres-sions from Task 1 were used. The control task involved showing photographs of expressionless men and women on the computer every four seconds, with the subjects being asked to indicate with their fingers both the gender of the models in the photographs as well as which of them were expressionless. In the activa-tion task, photographs of 7 types of non-neutral facial expressions were shown at random every four seconds, with the subjects asked to select the gender and the expression with their fingers. The number of correct responses and incorrect responses of expression recognition in these tasks were used to calculate the rate of correct responses.
2.3. NIRS Data Collection Methods
NIRS measurements were performed using ETG4000, a 24-channel NIRS system (Hitachi Medical Corporation, Tokyo, Japan), at two wavelengths of near-infrared light (695 and 830 nm), the absorption of which was measured, and concentra-tion changes of oxygenated hemoglobin (oxy-Hb) and deoxygenated hemoglo-bin (deoxy-Hb) were calculated using the difference of absorbance based on the Beer-Lambert law. The distances between injector and detector were 3.0 cm, and it was determined that the machine measures points 2 - 3 cm beneath the scalp, that is, the surface of the cerebral cortices. The probes of the NIRS machines were symmetrically placed on a subject’s bilateral frontal regions. Two plastic shells to which nine optodes were attached were symmetrically fixed on the left and right forehead. The probes on the bilateral frontal region measured the rela-tive concentrations of oxy-Hb and deoxy-Hb changes at 12 measurement points in a 6 × 6-cm area in the left and right hemispheres, respectively, with the lowest probes positioned along the Fp1-Fp2 line, according to the international 10/20 electrode system used for electroencephalography. The distances from the mid-line to the most medial and the most lateral probes were 3.0 and 9.0 cm, respec-tively. Ch3 and Ch8 correspond to the left inferior frontal gyrus (Broca’s area) [29]. The time resolution of the NIRS machine was set at 0.1 second.
The control task (60 seconds) and the activation task (60 seconds) were alter-nated three times each for both Task 1 and Task 2. After the concentration changes of oxy-Hb were added, the variation in NIRS signal (changes in concentration of oxy-Hb) was calculated by subtracting the control task result from the activation task result, and the result was used as a statistical analysis subject.
2.4. Data Analysis
DOI: 10.4236/ojpsych.2018.81003 40 Open Journal of Psychiatry responses during Task 2, and change in the concentration of oxy-Hb, were done using the Mann-Whitney-U test. The correlation between these groups was cal-culated using the Spearman’s rank correlation coefficient. The comparison of the left and the right for each channel of NIRS signal variation (change in the con-centration of oxy-Hb) was examined using the paired t-test. The statistical anal-ysis was done using SPSS 24 (SPSS Inc., Chicago, IL, USA). The level of statistic-al significance was set at 0.05.
A priori power of the study was estimated using G*power (version 3.1) [30]. Suf-ficient sample size of this study using an alpha 0.05, a power of 0.95, Two-tailed test: Mann-Whitney-U test’s computed desired sample size was 18; paired t test’s computed desired sample size was 54; and the Correlation’s computed desired sample size was 46, and based on the aforementioned assumptions.
2.5. Ethical Considerations
This research study was approved by the Tokushima University Hospital Ethics Board (No. 1671). Subjects were assured that their personal information would be protected, and the results of the study would only be reported as aggregate data, and used only for research purposes. The purpose and procedure of the study were explained to all subjects and informed consent was obtained from the subjects. A similar explanation was given to the guardians of ASD patients and students under the age of 20, and in these cases, consent was obtained from the guardians.
3. Results
The ASD group was comprised of 20 males (age; range: 18 - 22, median: 20.5 years old; all subjects were right-handed). The IQ of the ASD group was between 95 and 114 (median: 103). The control group consisted of 45 right-handed males (age; range: 18 - 22, median: 21.0 years old). The number of years of education for the ASD group was between 12 and 16 (median: 13) and between 12 and 16 (median: 15) for the control group, with the control group having a significantly higher number of years of education (p < 0.001). The AQ for the ASD group was between 23 and 46 (median: 35) and between 8 and 33 (median: 17) for the con-trol group (Table 1).
3.1. AQ and Rate of Correct Expression Response
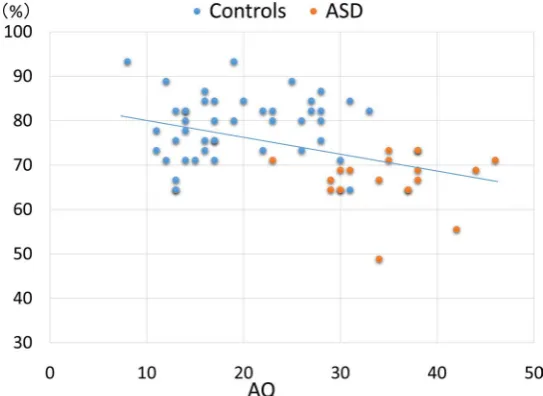
The relationship between AQ and rate of overall correct expression is displayed in a distribution map (Figure 1). In the ASD group, AQ was plotted in high po-sitions, and the correct response rates were plotted in low positions. Although no correlation was found in either the ASD group or the contrast group, when the relationship between AQ and rate of correct expression response was examined after combining the two groups, a negative correlation (ρ = −0.40 p < 0.001) was found.
DOI: 10.4236/ojpsych.2018.81003 41 Open Journal of Psychiatry
Table 1. Subject characteristics.
ASD (N=20) Controls (N = 45)
p-value
Range (Median) Range (Median)
Age (years) 18 - 22 (20.5) 18 - 22 (21) 0.20
Education (years) 12 - 16 (13) 12 - 16 (15) <0.001
IQ 95 - 114 (103) N/A
AQ 23 - 46 (35) 8 - 33 (17) <0.001
Handedness (R/L) 20/0 45/0
Sex (M/F) 20/0 45/0
[image:7.595.237.509.262.460.2]Mann-Whitney-U test; IQ: Wechsler Adult Intelligence Scale, Fourth Edition; AQ: Autism-Spectrum Quo-tient.
Figure 1. The correlation between AQ and rate of overall correct expression response.
When the ASD group and control group were combined and examined together, it showed a negative correlation between AQ and rate of correct responses (ρ = −0.40 p < 0.001).
higher in the ASD group than in the control group (p < 0.001), and the rate of overall correct expression response was significantly lower in the ASD group than in the control group (p < 0.001). In the rate of each correct expression re-sponse, the rates of “fear” “contempt” “disgust” and “surprise” were significantly lower in the ASD group than in the control group (Table 2). In the ASD group, it was noticeable that the expression of “fear” was wrongly answered as “sadness” or “surprise”. Many cases with ASD mistook the expression of “disgust” for “an-ger”, and the expression of “contempt” for “disgust”.
3.2. Comparison of NIRS Signal Variation (Oxy-Hb Concentration
Changes) in the Expression Recognition Task
DOI: 10.4236/ojpsych.2018.81003 42 Open Journal of Psychiatry
Table 2. The group comparison for rate of correct expression response.
ASD (N = 20) Controls (N = 45)
p-value
Range (Median) Range (Median)
Total 48.9 - 73.3 (67.8) 64.4 - 93.3 (80.0) <0.001
Happiness 100 85.7 - 100 (100) 0.17
Sadness 28.6 - 100 (92.9) 57.1 - 100 (85.7) 0.91
Anger 0 - 100 (100) 66.7 - 100 (100) 0.05
Fear 0 - 71.4 (21.4) 0 - 100 (42.9) 0.01
Contempt 16.7 - 100 (58.3) 50.0 - 100 (100) <0.001
Disgust 0 - 50.0 (25.0) 0 - 100 (50.0) 0.01
Surprise 0 - 100 (91.7) 50.0 - 100 (100) 0.02
[image:8.595.98.540.88.441.2]Mann-Whitney-U test.
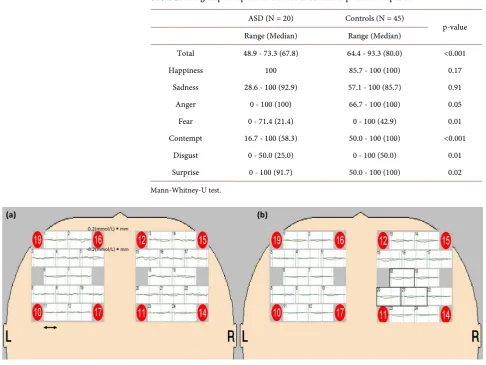
Figure 2. The change in the concentration of oxy-Hb in Task 1. (a) = ASD group (n = 20); (b) = control group (n = 45). Grand
average waveform of hemoglobin concentration changes during the task 1 for ASD group and control group. Red, oxygenated hemoglobin (oxy-Hb); blue, deoxygenated hemoglobin (deoxy-Hb); green, total hemoglobin (total-Hb). Black arrow, activation task period. In the automatic expression-processing task, both the ASD and control groups showed virtually no activation of the prefrontal cortex. Ch.18.20.21 was found to have significantly decreased in the control group (p < 0.05, Mann-Whitney-U test). The left and the right differences for each channel of NIRS signal variation (change in the concentration of oxy-Hb) did not show significant differences by the paired t-test.
task). Virtually no activation of the prefrontal cortex was seen in the automatic expression-processing task, in either the ASD or control groups. Rather, in the control group, the medial prefrontal showed lower activation. The channel (ch.) 18.20.21 significantly decreased in the control group when compared to that in the ASD group (p < 0.05). In both groups, no difference between the left and the right in the variation (change in the concentration of oxy-Hb) of the NIRS signal in each channel was found.
[image:8.595.209.540.89.265.2]DOI: 10.4236/ojpsych.2018.81003 43 Open Journal of Psychiatry
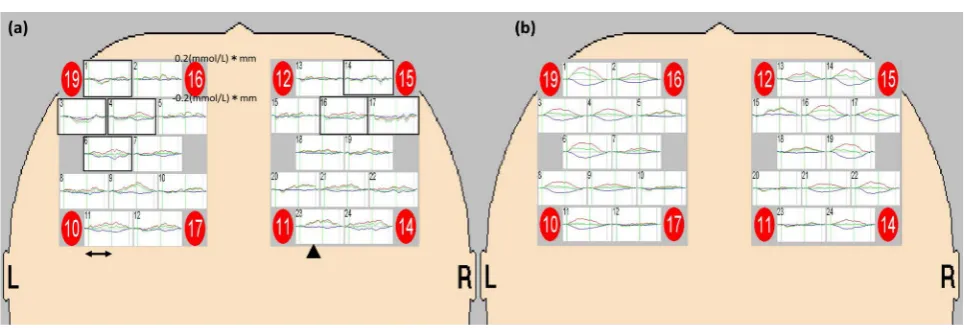
Figure 3. The change in the concentration of oxy-Hb in Task 2. (a) = ASD group (n = 20); (b)=control group (n = 45). The left
and right lateral prefrontal cortex was activated in the control group. In the ASD group, the frontal cortex activation was poor and a mild activation was found in the posterior section. The activation of the Ch.1.3.4.6.14.16.17 of the ASD group was significantly weaker than that in the control group (p < 0.05). The activation of Ch. 23 (▲) was significantly stronger in the ASD group than in the control group (p < 0.05, Mann-Whitney-U test). The left and the right differences for each channel of NIRS signal variation (change in the concentration of oxy-Hb) did not show significant differences by the paired t-test.
group, the activation of Ch.1.3.4.6.14.16.17 was significantly weaker in the ASD group (p < 0.05). In contrast, the activation of Ch. 23 was significantly stronger in the ASD group than in the control group (p < 0.05). In both groups, the dif-ference between the left and right in the variation (change in the concentration of oxy-Hb) of the NIRS signal of each channel was not found.
4. Discussion
In this study, the median AQ score was 35 points for the ASD group and 17 points for the control group, with the ASD group having significantly higher AQ scores. However, an overlap in the ranges was seen, with the scores ranging from 23 - 46 points in the ASD group, and from 8 - 33 points in the healthy group. Furthermore, when the control and ASD groups were combined in order to ex-amine the relationship between the AQ and the overall correct response rate, a negative correlation was found. This indicates that continuity is seen in the healthy men and those with autism within the same spectrum.
DOI: 10.4236/ojpsych.2018.81003 44 Open Journal of Psychiatry eyes and the position of the eyebrows play a large part in these expressions. It was considered that people with ASD cannot correctly recognize these expressions be-cause they do not look at the eyes in order to differentiate between them.
Nakadoi et al. [23] used NIRS to evaluate the automatic processing process of the expression of fear among people with ASD. As a result, they reported that the activation reaction of the prefrontal cortex of the ASD group is significantly lower than that of the control group. However, Task 1 in the present study, which examines the automatic expression-processing process, found no activation in the prefrontal cortex for either the ASD or control groups. Unlike the study by Nakadoi et al. [23] in which a task only used the expression of “fear”, the present study used various expressions other than “fear” for its task. The reason of discre-pancy between the results of above two studies could be attributed to differences in the presented photographs.
The control group in Task 1 showed a decrease in the concentration of oxy-Hb in the medial prefrontal cortex. Such a decrease was not found in the ASD group. When a healthy person starts a task, the activities of the medial prefrontal cortex and its adjacent regions decrease. These regions comprise a “default mode network”, which operates during a quiet period and is believed to be involved in processing related to introspection and high-order sociability [34]. Research has begun to address the fact that in people with ASD, deactivation in this region when per-forming the task does not occur [35]. The result of this research may reflect dif-ficulty in regulating the default mode network for people with ASD.
Nakamura et al. reported that in their PET studies, the lateral inferior frontal gyrus of the right hemisphere was activated for healthy subjects when perform-ing a conscious expression evaluation task [10]. The non-verbal communication of gestures, expression, and voice fluctuation are believed to be controlled pre-dominantly by the right hemisphere, unlike in verbal communication [36] [37] [38]. In this study, the activation of the right and left lateral prefrontal cortex was found in the control group during the conscious expression-processing task (Task 2); however, no difference between the left and the right was found. This result could be attributed to the left verbal area (Broca’s area) being activated when the subjects were asked to select the expression name printed on paper. In the ASD group, no activation at the lateral prefrontal cortex was found. Instead, the posterior prefrontal cortex showed mild activation. With ASD, a functional dis-order exists in the prefrontal cortex in expression recognition, suggesting a possi-bility that the ASD group processed the expressions in a manner different from the control group. These findings show the usefulness of NIRS in detecting brain func-tion disorder in the expression-processing process of people with ASD, and it could recommend that NIRS can be used to aid the diagnosis of ASD.
im-DOI: 10.4236/ojpsych.2018.81003 45 Open Journal of Psychiatry proved in people with ASD by training them to identify expressions from an early age. NIRS can repeatedly measure cerebral blood flow in real-time and was consi-dered to be useful in setting effective tasks and judging the effects of training.
5. Limitations
There are several limitations of the present study. The first limitation is that the sample size of the ASD group was small, and that only men served as subjects. Since ASD occurs less frequently in women, there have not been many studies on whether ASD in women displays significant differences in cognitive and neural functions when compared to ASD in men. In the future, women with ASD also need to be examined. The second limitation is that the intellectual level of the control group was not evaluated. There is a significant difference in the number of years of education, and this was not matched to the ASD group. As such, there is a possibility that the control group has a higher intellect, given that there was a significant difference in the number of years of education, and failing to match this properly may have had an effect on the results. The third limitation is that the evaluation of autistic properties was only conducted using the AQ. In the future, evaluations using the Autism Diagnostic Interview-Revised (ADI-R), the Perva-sive Developmental Disorders Autism Spectrum Disorders Rating Scale (PARS), and other scales should be conducted, in order to examine the relationship be-tween autistic properties and the NIRS findings.
6. Conclusion
The present study succeeded in using NIRS to show that the expression-processing process of people with ASD differs to that of people without ASD. The automatic expression-processing task saw no activation in the prefrontal cortex in either the ASD or control groups. In the control group, the concentration of oxy-Hb with-in the medial prefrontal cortex had with-in fact, decreased. This decrease was not found in the ASD group. With the conscious expression-processing task, the ASD group did not show activation of the lateral prefrontal cortex when compared to the con-trol group. In the ASD group, a mild activation was seen in the posterior section of the prefrontal cortex instead. The expression-processing process of the ASD group was considered different from that of the control group. For these reasons, NIRS might be effective in detecting brain function disorder in the expression-processing process of people with ASD.
Acknowledgements
The authors would like to thank subjects, patients and all staff members of the hospital who have helped this research. And we also would like to express our deep gratitude to the academic supervisors.
Competing Interests
DOI: 10.4236/ojpsych.2018.81003 46 Open Journal of Psychiatry
Author’s Contributions
KF was responsible for the idea behind this study and its structure. KF was also responsible for the measurement and evaluation of NIRS. KM was responsible in diagnosing autism and recruiting autistic patients. KM, SN, KT, and HT were re-sponsible in recruiting regular subjects and aided with NIRS measurements. TT conducted the statistical analysis.
References
[1] American Psychiatric Association (2013) Diagnostic and Statistical Manual of Mental Disorders. 5th Edition, American Psychiatric Association Publishing, Arlington, VA. [2] Baron-Cohen, S., Leslie, A.M. and Frith, U. (1985) Does the Autistic Child Have a
“Theory of Mind”? Cognition, 21, 37-46.
https://doi.org/10.1016/0010-0277(85)90022-8
[3] Schultz, R.T. (2005) Developmental Deficits in Social Perception in Autism: The Role of the Amygdala and Fusiform Face Area. International Journal of Develop-mental Neuroscience, 23, 125-141. https://doi.org/10.1016/j.ijdevneu.2004.12.012
[4] Spezio, M.L., Adolphs, R., Hurley, R.S. and Piven, J. (2007) Abnormal Use of Facial Information in High-Functioning Autism. Journal of Autism and Developed Dis-orders, 37, 929-939. https://doi.org/10.1007/s10803-006-0232-9
[5] Gross, T.F. (2004) The Perception of Four Basic Emotions in Human and Nonhu-man Faces by Children with Autism and Other Developmental Disabilities. Journal of Abnormal Child Psychology, 32, 469-480.
https://doi.org/10.1023/B:JACP.0000037777.17698.01
[6] Pelphrey, K.A., Sasson, N.J., Reznick, J.S., Paul, G., Goldman, B.D. and Piven. J. (2002) Visual Scanning of Faces in Autism. Journal of Autism and Developmental Disorders, 32, 249-261. https://doi.org/10.1023/A:1016374617369
[7] Adolphs, R. and Tranel, D. (2004) Impaired Judgments of Sadness but Not Happi-ness Following Bilateral Amygdala Damage. Journal of Cognitive Neuroscience, 16, 453-462. https://doi.org/10.1162/089892904322926782
[8] Adolphs, R. (2002) Neural Systems for Recognizing Emotion. Current Opinion in Neurobiology, 12, 169-177. https://doi.org/10.1016/S0959-4388(02)00301-X
[9] Kanwisher, N., McDermott, J. and Chun, M.M. (1997) The Fusiform Face Area: A Module Inhuman Extrastriate Cortex Specialized for Face Perception. Journal of Neuroscience, 17, 4302-4311.
[10] Nakamura, K., Kawashima, R., Ito, K., Sugiura, M., Kato, T., Nakamura, A., Hatano, K., Nagumo, S., Kubota, K., Fukuda, H. and Kojima, S. (1999) Activation of the Right Inferior Frontal Cortex during Assessment of Facial Emotion. Journal of Neurophysiology, 82, 1610-1614.
[11] Dapretto, M., Davies, M.S., Pfeifer, J.H., Scott, A.A., Sigman, M., Bookheimer, S.Y. and Iacoboni, M. (2006) Understanding Emotions in Others: Mirror Neuron Dys-function in Children with Autism Spectrum Disorders. Nature Neuroscience, 9, 28-30. https://doi.org/10.1038/nn1611
[12] Williams, J.H., Waiter, G.D., Gilchrist, A., Perrett, D.I., Murray, A.D. and Whiten, A. (2006) Neural Mechanisms of Imitation and ‘Mirror Neuron’ Functioning in Au-tistic Spectrum Disorder. Neuropsychologia, 44, 610-621.
https://doi.org/10.1016/j.neuropsychologia.2005.06.010
Wil-DOI: 10.4236/ojpsych.2018.81003 47 Open Journal of Psychiatry liams, S.C. (2000) The Amygdala Theory of Autism. Neuroscience & Biobehavioral Reviews, 24, 355-364. https://doi.org/10.1016/S0149-7634(00)00011-7
[14] Schultz, R.T., Gauthier, I., Klin, A., Fulbright, R.K., Anderson, A.W., Volkmar, F., Skudlarski, P., Lacadie, C., Cohen, D.J. and Gore, J.C. (2000) Abnormal Ventral Temporal Cortical Activity during Face Discrimination among Individuals with Autism and Asperger Syndrome. Archives of General Psychiatry, 57, 331-340.
https://doi.org/10.1001/archpsyc.57.4.331
[15] Jöbsis, F.F. (1977) Noninvasive Infrared Monitoring of Cerebral and Myocardial Oxygen Sufficiency and Circulatory Parameters. Science, 198, 1264-1267.
https://doi.org/10.1126/science.929199
[16] Kita, Y., Gunji, A., Inoue, Y., Goto, T., Sakihara, K., Kaga, M., Inagaki, M. and Ho-sokawa, T. (2011) Self-Face Recognition in Children with Autism Spectrum Dis-orders: A Near-Infrared Spectroscopy Study. Brain & Development, 33, 494-503.
https://doi.org/10.1016/j.braindev.2010.11.007
[17] Hoshi, Y. (2005) Functional Near-Infrared Spectroscopy: Potential and Limitations in Neuroimaging Studies. International Review of Neurobiology, 66, 237-266.
https://doi.org/10.1016/S0074-7742(05)66008-4
[18] Hoshi, Y. (2011) Towards the Next Generation of Near-Infrared Spectroscopy. Phi-losophical Transactions. Series A, Mathematical, Physical, and Engineering Sciences, 369, 4425-4439.https://doi.org/10.1098/rsta.2011.0262
[19] Yasumura, A., Kokubo, N., Yamamoto, H., Yasumura, Y., Moriguchi, Y., Nakagawa, E., Inagaki, M. and Hiraki, K. (2012) Neurobehavioral and Hemodynamic Evalua-tion of Cognitive Shifting in Children with Autism Spectrum Disorder. Journal of Behavioral and Brain Science, 2, 463-470.
https://doi.org/10.4236/jbbs.2012.24054
[20] Kawakubo, Y., Kuwabara, H., Watanabe, K., Minowa, M., Someya, T., Minowa, I., Kono, T., Nishida, H., Sugiyama, T., Kato, N. and Kasai, K. (2009) Impaired Pre-frontal Hemodynamic Maturation in Autism and Unaffected Siblings. PLoS ONE, 4, e6881.https://doi.org/10.1371/journal.pone.0006881
[21] Mori, K., Toda, Y., Ito, H., Mori, T., Mori, K., Goji, A., Hashimoto, H., Tani, H., Miyazaki, M., Harada, M. and Kagami, S. (2015) Neuroimaging in Autism Spec-trum Disorders: 1H-MRS and NIRS Study. The Journal of Medical Investigation, 62, 29-36.https://doi.org/10.2152/jmi.62.29
[22] Hosokawa, M., Nakadoi, Y., Watanabe, Y., Sumitani, S. and Ohmori, T. (2015) As-sociation of Autism Tendency and Hemodynamic Changes in the Prefrontal Cortex during Facial Expression Stimuli Measured by Multi-Channel Near-Infrared Spec-troscopy. Psychiatry and Clinical Neurosciences, 69, 145-152.
https://doi.org/10.1111/pcn.12240
[23] Nakadoi, Y., Sumitani, S., Watanabe, Y., Akiyama, M., Yamashita, N. and Ohmori, T. (2012) Multi-Channel Near-Infrared Spectroscopy Shows Reduce Activation in Prefrontal Cortex during Facial Expression Processing in Pervasive Developmental Disorder. Psychiatry and Clinical Neurosciences, 66, 26-33.
https://doi.org/10.1111/j.1440-1819.2011.02290.x
[24] Iwanaga, R., Tanaka, G., Nakane, H., Honda, S., Imamura, A. and Ozawa, H. (2013) Usefulness of Near-Infrared Spectroscopy to Detect Brain Dysfunction in Children with Autism Spectrum Disorder when Inferring the Mental State of Others. Psy-chiatry Clinical Neurosciences, 67, 203-209.https://doi.org/10.1111/pcn.12052
DOI: 10.4236/ojpsych.2018.81003 48 Open Journal of Psychiatry Journal of Autism and Developmental Disorders, 36, 155-167.
https://doi.org/10.1007/s10803-005-0056-z
[26] Baron-Cohen, S., Wheelwright, S., Skinner, R., Martin J. and Clubley, E. (2001) The Autism-Spectrum Quotient (AQ): Evidence from Asperger Syndrome/High-Functioning Autism, Males and Females, Scientists and Mathematicians. Journal of Autism and Developmental Disorders, 31, 5-17.https://doi.org/10.1023/A:1005653411471
[27] Wakabayashi, A., Baron-Cohen, S., Wheelwright, S. and Tojo, Y. (2006) The Aut-ism-Spectrum Quotient (AQ) in Japan: A Cross-Cultural Comparison. Journal of Autism and Developmental Disorders, 36, 263-270.
https://doi.org/10.1007/s10803-005-0061-2
[28] Kamachi, M., Bruce, V., Mukaida, S., Gyoba, J., Yoshikawa, S. and Akamatsu, S. (2001) Dynamic Properties Influence the Perception of Facial Expressions. Percep-tion, 30, 875-887.https://doi.org/10.1068/p3131
[29] Singh, A.K., Okamoto, M., Dan, H., Jurcak, V. and Dan, I. (2005) Spatial Registra-tion of Multichannel Multi-Subject fNIRS Data to MNI Space without MRI. Neu-roImage, 27, 842-851.https://doi.org/10.1016/j.neuroimage.2005.05.019
[30] Faul, F., Erdfelder, E., Lang, A.-G. and Buchner, A. (2007) G Power 3: A Flexible Statistical Power Analysis Program for the Social, Behavioral, and Biomedical Sciences. Behavior Research Methods, 39, 175-191.
https://doi.org/10.3758/BF03193146
[31] Howard, M.A., Cowell, P.E., Boucher, J., Broks, P., Mayes, A., Farrant, A. and Ro-berts, N. (2000) Convergent Neuroanatomical and Behavioural Evidence of an Amygdala Hypothesis of Autism. NeuroReport, 11, 2931-2935.
https://insights.ovid.com/pubmed?pmid=11006968
https://doi.org/10.1097/00001756-200009110-00020
[32] Dalton, K.M., Nacewicz, B.M., Johnstone, T., Schaefer, H.S., Gernsbacher, M.A., Goldsmith, H.H., Alexander, A.L. and Davidson RJ. (2005) Gaze Fixation and the Neural Circuitry of Face Processing in Autism. Nature Neuroscience, 8, 519-526.
https://doi.org/10.1038/nn1421
[33] Tanaka, J.W. and Sung, A. (2016) The “Eye Avoidance” Hypothesis of Autism Face Processing. Journal of Autism and Developmental Disorders, 46, 1538-1552.
https://doi.org/10.1007/s10803-013-1976-7
[34] Greicius, M.D., Krasnow, B., Reiss, A.L. and Menon, V. (2003) Functional Connec-tivity in the Resting Brain: A Network Analysis of the Default Mode Hypothesis. Proceedings of the National Academy of Sciences, 100, 253-258.
https://doi.org/10.1073/pnas.0135058100
[35] Kennedy, D.P. and Courchesne, E. (2008) Functional Abnormalities of the Default Network during Self- and Other-Reflection in Autism. Social Cognitive and Affec-tive Neuroscience, 3, 177-190.https://doi.org/10.1093/scan/nsn011
[36] Kolb, B. and Taylor, L. (1981) Affective Behavior in Patients with Localized Cortical Excisions: Role of Lesion Site and Side. Science, 214, 89-91.
https://doi.org/10.1126/science.7280683
[37] Ahern, G.L., Schomer, D.L., Kleefield, J., Blume, H., Cosgrove, G.R., Weintraub, S. and Mesulam, M.M. (1991) Right Hemisphere Advantage for Evaluating Emotional Facial Expressions. Cortex, 27, 193-202.
https://doi.org/10.1016/S0010-9452(13)80123-2
DOI: 10.4236/ojpsych.2018.81003 49 Open Journal of Psychiatry [39] Herba, C. and Phillips, M. (2004) Annotation: Development of Facial Expression
Recognition from Childhood to Adolescence: Behavioural and Neurological Pers-pectives. Journal of Child Psychology and Psychiatry, 45, 1185-1198.