ISSN Online: 2158-2750 ISSN Print: 2158-2742
DOI: 10.4236/ajps.2017.813227 Dec. 19, 2017 3377 American Journal of Plant Sciences
Nitrogen and Phosphorus Fertilization
Promotes Aerial Part Development and
Affect Nutrient Uptake by Carobinha
of the Brazilian Cerrado
Willian Vieira Gonçalves
1*, Maria do Carmo Vieira
1, Thiago de Oliveira Carnevali
2,
Néstor A. Heredia Zárate
1, Heldo Denir Vhaldor Rosa Aran
1, Kátia Cristina Silva Mineli
31Agrarian Science Faculty, Federal University of Grande Dourados—UFGD, University City, Dourados, Brazil ²Federal University of Pará—UFPA, São Sebastião, Brazil
³Biological and Environmental Sciences Faculty, UFGD, Dourados, Brazil
Abstract
Producing Brazilian Cerrado plants, especially ones endangered, is essential for your maintenance. In this way, fertilization is furthermore uncertain. Here, we demonstrate the impact of soil addition of nitrogen (N, 4.20, 18.90, 31.50, 44.10 and 59.85 mg·dm−3) and phosphorus (P, 9.56, 57.38, 95.62, 133.86
and 181.67 mg·dm−3) fertilizers levels on the development and on nutrients
uptake by Jacaranda decurrens subsp. symmetrifoliolata (carobinha), species of the Brazilian Cerrado, in a long term pot trial. The N and P addition to-gether increased plant height and N concentration in roots. N and P also in-creased the P concentration and content on the roots in young plants, but in the older plants, isolated effect of both was stronger than their combined ac-tion. The N addition promoted branching, production of dry leaves and dry xylopodium, contents of K, Ca and P on the leaves, and N content on the roots. However, the N reduced xylopodium diameter, leaf area, and Mg con-tents in the young plants, but increased them in the older plants. The P addi-tion increased stem diameter and dry biomass, P concentraaddi-tion and N content on the leaves, Ca content on the roots and also reduced N concentration on the leaves. However, the P addition increased Mg concentration on the roots in the young plants and reduced it in the older plants. In general, N levels ranging between 25.69 - 38.85 mg·dm−3 and P levels between 84.39 - 109.23
mg·dm−3 promote more effectively the plant development. Thus, N and P
fer-tilization can promote the aerial development of plant and a differential allo-cation of nutrients between the carobinha tissues.
How to cite this paper: Gonçalves, W.V., do Carmo Vieira, M., de Oliveira Carnevali, T., Zárate, N.A.H., Aran, H.D.V.R. and Mineli, K.C.S. (2017) Nitrogen and Phos-phorus Fertilization Promotes Aerial Part Development and Affect Nutrient Uptake by Carobinha of the Brazilian Cerrado. American Journal of Plant Sciences, 8, 3377-3398.
https://doi.org/10.4236/ajps.2017.813227
Received: October 3, 2017 Accepted: December 16, 2017 Published: December 19, 2017
Copyright © 2017 by authors and Scientific Research Publishing Inc. This work is licensed under the Creative Commons Attribution International License (CC BY 4.0).
DOI: 10.4236/ajps.2017.813227 3378 American Journal of Plant Sciences
Keywords
Jacaranda decurrens Sub sp. symmetrifoliolata, Bignoniaceae, Nitrogen Management, Phosphorus Management
1. Introduction
Even though the flora of the Brazilian Cerrado is rich in economically important species, their cultivation is still incipient. An aggravating factor is that many of them are endangered, either due to deforestation or because of indiscriminate exploitation, without an appropriate crop management [1] [2]. The use of the roots of these species in traditional medicine increases their risk of extinction. The subject of study in the present work was the carobinha (Jacaranda decurrens subsp. symmetrifoliolata, Bignoniaceae) [3], an underbush species that occurs exclusively in the south of the Mato Grosso do Sul State [4]. The folk medicine indicates their roots as blood depurative, in the healing of uterine and ovarian wounds, and in the treatment of rheumatic problems and dysentery. Recently reports indicate the anti-inflammatory effect of the carobinha roots and the an-ti-oxidative, anti-tumoral and anti-obesity activities of its leaves [5] [6] [7].
Soil enrichment with nutrients may promote or delay the development of na-tive species in the Brazilian Cerrado [8]. N and P play an important role in such responses [9] [10]. In the weathered soils of this ecosystem, P is one of the most limiting factors [11]. In the plant, P is essential in the supply of energy and in the composition of RNA, DNA, and photosynthesis and respiration derived sugars. Besides, it is a crucial component of the cellular membrane [12]. [13] also showed that fertilization with inorganic P may promote growth and leaf and root production in the carobinha. In turn, N composes the structure of amino acids and nucleic acids, being quantitatively the nutrient that is most required by plants [12]. In general, N increases potassium (K) demands and P uptake in the plant. Furthermore, it increases the amounts of sulfur (S) needed for amino acid synthesis [14]. However, an excessive application of N may lead to K deficiency and reduced calcium (Ca) levels [15], and ammonium (NH4+) addition to the soil may increase its acidity [16]. Therefore, the balanced addition of N and P is essential for the correct balancing of plant development and nutrient uptake [17] [18].
Based on the exposed situation, we investigated the effect of soil fertilization with N and P on the development and nutrients uptake by the carobinha.
2. Material and Methods
2.1. Protected Growth
DOI: 10.4236/ajps.2017.813227 3379 American Journal of Plant Sciences
were cultivated in vases with 5.70 kg substrate (very clayey dystroferric Red La-tosol; 1.20 kg∙dm−3; pH CaCl
2 = 4.33; P = 1.71 mg∙dm−3; K = 0.041 cmolc∙dm−3; Al
= 1.2 cmolc∙dm−3; Ca = 0.67 cmolc∙dm−3; Mg = 0.18 cmolc∙dm−3; H + Al = 2.99
cmolc∙dm−3; T = 3.89 cmolc∙dm−3; V = 22.9%). After addition of 24.54 g limestone
(221.55 g Ca kg−1 and 126.64 g Mg kg−1, PRNT = 1000 g∙kg−1, Calpar®, Paraná,
Brazil) and 200 mL water kg−1 to the substrate, the vases were incubated for 14
days.
Five nitrogen (N) (N1: 4.20, N2: 18.90, N3: 31.50, N4: 44.10 and N5: 59.85 mg∙dm−3) and five phosphorus (P) (P1: 9.56, P2: 57.38, P3: 95.62, P4: 133.86 and
P5: 181.67 mg∙dm−3) fertilizers levels and cycles were tested. Their combinations
were defined based on the experimental matrix Plan Plueba III, which suggested nine treatments (1: N2P2, 2: N4P2, 3: N2P4, 4: N4P4, 5: N3P3, 6: N1P2, 7: N5P4, 8: N2P1 and 9: N4P5) arranged in randomized blocks and four repetitions. The experimental unit consisted of four vases. Phosphorus was provided by Ca2(H2PO4) (187.7g P kg−1 + 150g Ca kg−1), nitrogen by (NH4)2SO4 (210 g N kg−1
+ 220 g S kg−1), and potassium (120 mg∙dm−3) by KCl (498.1 g K kg−1).
After incubation, one 70-day-old carobinha plantlet was transferred to each vase. Total P was applied on the same day; 40% N and K were added 30 days lat-er; and the remaining was applied 60 (30%) and 90 (30%) days after transplant-ing (DAT). At 151 DAT, 0.15 mL of a 1.2 kg L−1 fertilization solution (60 g Ca
L−1, 12 g Mg L−1, 24 g S L−1, 2.4 g B L−1, 3 g Cu L−1, 12 g Mn L−1, 0.432 g Mo L−1
and 12 g Zn L−1; Supra Mix®, Supra Fertilizantes) were added to each vase. The
substrate was kept at 70% of the field capacity.
Plant height and stem diameter were measured during the experimental cycle (between 44 and 672 DAT). At 259 DAT and 770 DAT, two entire plants were harvested in order to determinate xylopodium diameter; number of leaves and branches; leaf area; and the production of leaves, stems, xylopodium, and fresh and dry roots. The material was dried in a drying oven with forced air ventila-tion, at 60˚C ± 5˚C, until it reached a constant weight.
2.2. Chemical Analyses of Soils and Plants
The substrate collected before correction and at 259 DAT was dried, under nat-ural conditions, grinded and sieved (<2 mm). Then, were determined the pH (CaCl2), H + Al [SMP method, ln (H + Al) = 8.0857763 − 1.0621553 × pH SMP],
K (flame photometry, Melich 1), Ca and Mg (atomic absorption spectrophoto-metry-AAS, Varian SpectrAA-240 FS, Varian), Al (volumetry) and P (spectro-photometry, Melich 1). Sum of bases (Ca + Mg + K), cation exchange capacity (CEC) (sum of bases + H + Al) and base saturation (sum of basis/CEC) were al-so calculated.
DOI: 10.4236/ajps.2017.813227 3380 American Journal of Plant Sciences
2.3. Statistical Analyses
The open source software R [19] and Origin (OriginLab, Northampton, MA) were used to carry out the statistical analyses. The data vignette of R was stored in the EACS package [20]. The residues were initially tested for normality; if they did not show a normal distribution, the data were transformed using the boxcox test (MASS package) [21] in order to maximize their normality. Table 1 is all transformations. We then tested the constant effect of the treatments on the de-pendent variables, with the random effect of the block per experimental unit, compared to the model with the random effect of the block (lme, nlme package) [22]. The same model was applied to test the combined effect of N and P on plant age, considering age as variable.
Without the effect of the experimental unit, the linear models were tested (lm, lattice package) [23]. We tested the effect of nitrogen and phosphorus on nu-trient concentration in the soil and on the leaves at 259 DAT, since at 770 DAT the amount of leaves was insufficient. The repetitions were therefore combined and only the effect of age at harvest was tested. Wireframe plots (lattice package) were used to build response surfaces and boxplots (ggplot2) were used to represent the graphs showing the effect of age at harvest [24]. The logistic non-linear model adjusted itself to the effect of evaluation time on plant height, and, the modified Hill equation [25], to the effect of plant age on stem diameter. The repetitions were taken into account in the regressions, therefore, the coefficients of determination (R2) are multiple.
3. Results and Discussion
3.1. Effect of N and P Fertilization on Soil Chemistry
Both N (p = 0.10) and P (p = 0.52) had no effect on soil pH (CaCl2). The N
addi-tion elevated of K contents (p = 0.01) and slight increased the levels of H + Al (p = 0.07). Intermediate N doses (24.85 mg∙dm−3) increased K levels to highest
(0.34 cmolc∙dm−3) (maximum P), Figure 1(a). The regression models were not
adjusted to the effect of N on H + Al (R², p = 0.59). The N addition elevated of H + Al levels up to 31.5 mg∙dm−3 but, as doses increased, the levels drastically
de-creased. The P addition affected Mg levels (p = 0.01) and the sum of bases (p = 0.02 and p = 0.02), and more slightly Ca contents (p = 0.04 and p = 0.07), CEC (p = 0.02 and p = 0.10) and base saturation (p = 0.05 and p = 0.09). However, the regression models were not adjusted to the effect of P on Ca (R2, p = 0.23), the
sum of bases (R2, p = 0.11 and p = 0.15), the CEC (R2, p = 0.12) and the base
sa-turation (R2, p = 0.16). The proportional increase of P doses elevated the Mg
contents up to a maximum of (5.39 cmolc∙dm−3) (minimum N), Figure 1(b). The
addition of N and P affected the P levels (N, p < 0.01 and p = 0.03, and P, p < 0.01 and p = 0.01) and the P recovery efficiency (N, p = 0.04 and P, p = 0.01). Soil supplementation with P (from 11.42 mg∙dm−3 until a maximum dose) and of
N (until 19.32 mg∙dm−3) resulted in the highest P contents (38.56 mg∙dm−3),
DOI: 10.4236/ajps.2017.813227 3381 American Journal of Plant Sciences
Table 1.Regression equations of fitted models for plant age at evaluation or harvest (H), nitrogen (N) and phosphorus (P) effects.
Dependent
variable (dv) Transformation for Normality† Fitted models Multiple R²
Soil chemistry
K dv−0.41 ŷ = −0.041849(p = 0.730)b1 − 0.0816(p = 0.044)b2 − 0.044357(p = 0.276)b3
− 0.052133(p = 0.189)b4 + 0.116161(p = 0.018) N + 0.007102(p = 0.205) P − 0.01165(p = 0.019)N 0.359(p = 0.039)
Mg - − 0.022856ŷ = 4.879078(p = 0.858)(p < 0.000) b4 − 0.008871b1 − 0.155711(p = 0.010)(p = 0.228)N + 0.003007b2 − 0.027805(p = 0.008)(p = 0.833)P b3 0.291(p = 0.063)
P dv0.46 ŷ = 0.83309(p = 0.911) ‡ b1a + 2.38973(p = 0.182)b2 + 1.8747(p = 0.307)b3 + 1.1502(p = 0.516)b4
+ 2.27874(p = 0.295) N - 2.44087(p = 0.033) P - 0.25923(p = 0.237)N + 0.36121(p < 0.000)P 0.922(p < 0.000)
P
expected/P soil -
ŷ = 0.2687536(p = 0.009)b1 + 0.0353915(p = 0.125)b2 + 0.0289716(p = 0.220)b3 + 0.0173949(p = 0.444)b4
+ 0.0394384(p = 0.161) N − 0.0514625(p = 0.001) P − 0.0038727(p = 0.170)N + 0.0029828(p = 0.001)P 0.454(p = 0.013)
Growth and development
Plant
height dv−0.19
N and P effects: ŷ = 5.425592(p = 0.005) + 0.413743(p = 0.361) N + 0.653603(p = 0.008) P
− 0.144198(p = 0.037)N − 0.055969(p = 0.008)P + 0.101196(p = 0.177) N* P
Plant age effect:
(
( )9.23491)
ˆ 2.91918 2.91918 15.23677 1 204.283
y= + − + x
- 0.694
(Χ² = 12.534, k = 524)
Stem
diameter dv−0.05
N and P effects: ŷ = 2.4122229(p = 0.026) + 0.1398655(p = 0.629) N + 0.5901713(p = 0.000) P
− 0.0189229(p = 0.515)N − 0.0254747(p = 0.004)P
Plant age effect: ˆ 1.29818 8.80959 1.29818
(
)
224.893327.833897.83389 7.83389x y x = + − × + - 0.681
(Χ² = 4.570, k = 536)
Branching dv0.10 ŷ = 1.624617(p = 0.101)b1 + 0.657073(p = 0.465)b2 − 0.845044(p = 0.362)b3 + 0.157073(p = 0.861)b4
+ 0.052074(p = 0.024)N − 0.009139(p = 0.218)P + 3.281516(p < 0.000)Hb (p = 0.000)0.364
Xylopodium
diameter dv0.10
ŷ = 12.44178(p = 0.001)b1 − 1.027(p = 0.230)b2 − 1.88898(p = 0.035)b3 − 2.47894(p = 0.005)b4
− 1.78980(p = 0.207) N + 0.04876(p = 0.771) P + 0.20118(p = 0.162)N − 5.07082(p = 0.325)H
+ 5.49379(p = 0.008) N * H + 0.09654(p = 0.684) P*H − 0.56656(p = 0.007)N*H
0.744
(p < 0.000)
Leaf area dv0.35 ŷ = 465.37492
(p < 0.000)b1 − 49.56625(p = 0.247)b2 − 69.63742(p = 0.116)b3 − 68.42314(p = 0.112)b4
− 10.62847(p = 0.044)N + 0.31991(p = 0.518)P + 0.20204(p = 0.011)N2 − 416.06656(p = 0.000)H
+ 14.188(p = 0.061)N * H − 0.40932(p = 0.559)P * H − 0.25522(p = 0.025)N2 * H
0.705
(p < 0.000)
Dry leaves dv0.50 ŷ = 8.628721
(p < 0.000)b1 − 0.091967(p = 0.893)b2 − 0.740256(p = 0.297)b3 − 0.811167(p = 0.239)b4
− 0.152607(p = 0.071)N − 0.005056(p = 0.526)P + 0.003567(p = 0.006)N2 − 8.059523(p < 0.000) H
+ 0.183065(p = 0.131)N * H + 0.003525(p = 0.754)P * H − 0.003959(p = 0.031)N2 * H
0.798
(p < 0.000)
Dry stems dv0.40 ŷ = 0.67805(p = 0.654)b1 − 0.3142(p = 0.376)b2 − 0.70753(p = 0.056)b3 − 0.67275(p = 0.061)b4
− 0.2451(p = 0.573) N + 0.48083(p = 0.033) P + 0.03615(p = 0.407)N − 0.02617(p = 0.048)P
0.201
(p = 0.048)
Dry
xylopodium dv0.20 ŷ = 0.05681
(p = 0.976)b1 + 0.948(p = 0.584)b2 − 0.68121(p = 0.702)b3 − 2.02281(p = 0.244)b4
+ 0.05426(p = 0.216)N − 0.01043(p = 0.464)P + 6.95798(p < 0.000)H (p = 0.000)0.373
Dry roots dv0.20 ŷ = 3.7396659(p = 0.009)b1 − 1.4331236(p = 0.260)b2 − 1.2369638(p = 0.345)b3
− 1.843158(p = 0.149)b4 + 0.0201585(p = 0.529)N + 0.0001814(p = 0.986)P + 5.1851406(p < 0.000)H (p = 0.000)0.366
Nutrients concentration and content Leaf P
concentration dv−0.05 ŷ = 1.602808
(p < 0.000)b1 + 0.204678(p = 0.355)b2 + 0.039961(p = 0.856)b3
+ 0.011696(p = 0.958)b4 − 0.009975(p = 0.092)N + 0.004881(p = 0.013)P (p = 0.194)0.167
Leaf N
concentration -
ŷ = 21.25279(p = 0.001)b1 + 5.75556(p < 0.000)b2 + 3.5(p = 0.005)b3 + 3.57778(p = 0.004)b4
− 1.52302(p = 0.309) N − 1.40047(p = 0.071) P + 0.14062(p = 0.348)N + 0.08411(p = 0.066)P
0.4611
DOI: 10.4236/ajps.2017.813227 3382 American Journal of Plant Sciences Continued
Root Mg
concentration -
ŷ = 2.056803(p = 0.000) + 0.0268999(p = 0.051)N + 0.0020677(p = 0.113)P
− 0.0004479(p = 0.031)N2 − 0.4621669(p = 0.058)H − 0.0344858(p < 0.042)N * H
− 0.0001672(p < 0.042)P * H + 0.0005432(p < 0.033)N2 * H -
Root N
concentration dv0.70
ŷ = 11.3349596(p < 0.000)b1 + 0.8571477(p = 0.353)b2 + 1.6749204(p = 0.081)b3
+ 1.5571477(p = 0.094)b4 + 0.0750559(p = 0.362)N − 0.0508524(p = 0.051)P
− 0.0008661(p = 0.482)N2 + 0.000345(p = 0.011)P2 − 7.6807986(p<0.000) H
0.726
(p < 0.000)
Root P
concentration dv0.10
ŷ = 2.391(p = 0.000)b1 − 0.02556(p = 0.899)b2 + 0.08954(p = 0.667)b3 + 0.2154(p = 0.285)b4
− 0.007839(p = 0.754)N + 0.00002428(p = 0.998)P − 0.0004613(p = 0.411)N2 − 0.00001497(p = 0.800)P2
+ 0.0002969(p = 0.301)N * P − 1.383(p = 0.050)H + 0.004393(p = 0.903)N * H + 0.004635(p = 0.681)P * H
+ 0.001117(p = 0.175)N2 * H + 0.00009119(p = 0.292)P2 * H − 0.0006997(p = 0.093)N * P * H
0.485
(p = 0.000)
Leaf K content dv0.31 ŷ = 3.906313(p < 0.000)b1 + 0.062593(p = 0.907)b2 − 0.248765(p = 0.642)b3 − 0.530851(p = 0.312)b4
+ 0.029042(p = 0.031)N − 0.002014(p = 0.631)P − 4.018072(p < 0.000)H (p < 0.000)0.712
Leaf Ca content dv0.29 62.079(p < 0.000)b1 − 0.98366(p = 0.905)b2 − 9.46959(p = 0.253)b3 − 10.92011(p = 0.178)b4
+ 0.44128(p = 0.033)N − 0.02716(p = 0.6741)P − 62.04177(p < 0.000)H (p < 0.000)0.716
Leaf Mg content dv0.25 ŷ = 23.13
(p < 0.000)b1 − 1.396(p = 0.544)b2 − 3.124(p = 0.172)b3 − 3.109(p = 0.163)b4 − 0.4771(p = 0.052)N
+ 0.0003478(p = 0.988)P + 0.0103(p = 0.006)N2 − 0.2101(p = 0.001)H + 0.5867(p = 0.151)N * H
− 0.0102(p = 0.774)P * H − 0.01146(p = 0.056)N2 * H
0.770
(p < 0.000)
Leaf N content dv0.27 ŷ = 133.1
(p < 0.000)b1 + 9.096(p = 0.490)b2 - 16.33(p = 0.212)b3 − 15.07(p = 0.238)b4 − 3.209(p = 0.025)N
+ 0.2466(p = 0.573)P + 0.06748(p = 0.002)N2 − 0.00137(p = 0.530)P2 - 117.2(p = 0.009)H
+ 3.385(p = 0.154)N * H − 0.385(p = 0.577)P * H − 0.06893(p = 0.049)N2 * H + 0.001938(p = 0.572)P2 * H
0.806
(p < 0.000)
Leaf P content dv0.25 ŷ = 10.948408
(p = 0.007) − 0.319135(p = 0.120)N + 0.099322(p = 0.123)P + 0.006029(p = 0.053)N2
− 0.000384(p = 0.227)P2 − 9.793508(p = 0.122)H + 0.3227(p = 0.336)N * H
− 0.111079(p = 0.260)P * H − 0.005992(p = 0.226)N2 * H + 0.000449(p = 0.357)P2 * H -
Root Ca content dv0.08
ŷ = 10.33276(p = 0.704)b1 − 5.67455(p = 0.224)b2 − 8.03203(p = 0.096)b3 − 9.28819(p = 0.049)b4
− 1.4206(p = 0.857) N + 1.44502(p = 0.719) P + 0.20271(p = 0.798)N − 0.09138(p = 0.701)P
+ 44.28281(p = 0.262)H − 2.66291(p = 0.815) N * H − 8.87399(p = 0.129) P*H
+ 0.14825(p = 0.897)N * H + 0.62855(p = 0.070)P * H
0.3333
(p = 0.017)
Root P content dv0.21
ŷ = 9.5097314(p = 0.141)b1 − 1.8589245(p = 0.474)b2 − 3.1484625(p = 0.240)b3 − 2.8415475(p = 0.275)b4
− 0.1465441(p = 0.645)N + 0.0347105(p = 0.728)P + 0.0002882(p = 0.968)N2 − 0.0003529(p = 0.638)P2
+ 0.0015151(p = 0.676)N * P − 0.0498683(p = 0.996)H − 0.0035868(p = 0.994)N * H
+ 0.0241799(p = 0.868)P * H + 0.0137572(p = 0.200)N²*H + 0.0016135(p = 0.154)P² * H
− 0.0090576(p = 0.091)N * P * H
0.358
(p = 0.023)
†Defined by the Box-Cox test. ‡Probability by F test. aThe block (b) 1 coefficients are used to surface plot. bThese coefficients must add or subtract to
coeffi-cients of intercept or b1, and respectively effects (N, P, P2, N2, N, P and their interactions) on harvest of 770 DAT.
intermediate N doses increased, while P doses reduced it. The lower N dose and 74.42 mg∙dm−3 P resulted in the lowest recovery efficiency (0.11), whereas 25.93
mg∙dm−3 N and the lowest P dose caused the highest P recovery efficiency (0.24),
Figure 1(d).
Ca2(H2PO4) contains 150 g Ca kg−1, therefore supplementation with crescent P
[image:6.595.64.532.86.546.2]DOI: 10.4236/ajps.2017.813227 3383 American Journal of Plant Sciences
Figure 1. Effect of nitrogen (N) and phosphorus (P) fertilization on soil chemistry. K (a), Mg (b), P (c) and expected P/soil P (d)
by nitrogen and phosphorus doses. Fitted models are in Table 1. Soil sampled at 259 DAT, sample composed of substrate col-lected from two vases. Mg (KCl), P and K (Mehlich 1).
3.2. Effect of Plant Age or Age at Harvest and of N and P
Fertilization on the Carobinha Development
Plant age had an effect on plant height and stem diameter (p < 0.01), while age at harvest affected the number of branches, xylopodium diameter, leaf number, and leaf area (p < 0.01). Plant height slowly increased up to 105 DAT (0.0000059 - 0.0012 cm∙day−1), and then rapidly until 359 DAT (0.0024 - 0.1408 cm∙day−1),
with a peak at 200 DAT. After that, the growth rate decreased from 0.00079 to 0.000011 cm∙day−1 at 662 DAT (Figure 2(a1)). Likewise, stem diameter slowly
increased until 121 DAT (0.0000099 - 0.0024 mm∙day−1), rapidly until 426 DAT
(0.0021 - 0.0665 mm∙day−1), reaching a peak at 218 DAT, and continued growing
at a reduced rate (from 0.00087 to 0.000018 mm∙day−1) until 672 DAT (Figure
DOI: 10.4236/ajps.2017.813227 3384 American Journal of Plant Sciences
Supplementation with both N and P resulted in an elevation in plant height (p = 0.01). Increasing the N dose up to 26.03 mg∙dm−3 and the P dose up to 109.23
mg∙dm−3 led the plants to reach their maximum height (9.90 cm) (Figure 2(a2)).
P addition also increased stem diameter in up to 54.42% (p < 0.01 and p = 0.01) at the highest dose (Figure 2(b2)).
Between 259 and 770 DAT, the number of branches expanded 1518.22% (Figure 3(a)), and, xylopodium diameter, 66.49% (Figure 3(b)). However, the leaf area reduced 87.43% (Figure 3(c)).
N slightly promoted branching (p = 0.07) (Figure 3(a)) and acted inversely on xylopodium diameter (p = 0.01) (Figure 3(b)) and leaf area (p = 0.04) (Figure 3(c)) between 259 and 770 DAT. N addition led to the maximum branching (4.65 branches/plant at 259 DAT and 7.94 branches/plant at 770 DAT) at the highest dose (minimal P) (Figure 3(a)). At 259 DAT, the application of inter-mediate doses of N led to a reduction in xylopodium diameter until the lowest value of 8.61 mm/plant at a dose of 19.79 mg∙dm−3 N (Figure 3(b)) and the
smallest leaf area of 328.65 mm2/plant at a dose of 26.30 mg∙dm−3 N (minimal P)
Figure 2. Effects of plant age or age at harvest and of nitrogen (N) and phosphorus (P) fertilization on the carobinha growth.
DOI: 10.4236/ajps.2017.813227 3385 American Journal of Plant Sciences
Figure 3. Effects of plant age or age at harvest and of nitrogen (N) and phosphorus (P) fertilization on the carobinha growth.
Branching (a), xylopodium diameter (b) and leaf area (c) by age at harvest and the N and P doses (n = 2). Fitted models are in
DOI: 10.4236/ajps.2017.813227 3386 American Journal of Plant Sciences
(Figure 3(c)). However, at 770 DAT, the addition of intermediate N doses caused the xylopodium to reach its largest diameter (18.72 mm/plant) at 25.69 mg∙dm−3 of N (highest P) and leaf area (108.02 mm2/plant) at 33.47 mg∙dm−3 of
N (lowest P).
Plants at 259 DAT produced more leaves (Figure 3(c) and Figure 4(a)). In contrast, the plants produced less xylopodium (Figure 4(b)) and dry roots (Figure 4(d)) (p < 0.01) than those at 770 DAT. Plants at 770 DAT produced 90.99% less dry leaves, 261.83% more dry xylopodium and 121.57% more dry roots. Applying N increased production of dry leaves (p = 0.04) (Figure 4(a)) at 259 DAT. In addition, the N promoted the production of dry xylopodium (p < 0.10) (Figure 4(b)). Supplementation with P caused a higher production of dry stem (Figure 4(c)). At 259 DAT harvest, when applied N dose of 21.71 mg∙dm−3
plants produced the lowest dry leaves biomass (6.08 g/plant) (highest P). How-ever, at highest N dose the plants produced the highest dry leaves biomass (12.22 g/plant) (minimal P). In regard with plants at 770 DAT, the addition of N doses up to 38.85 mg∙dm−3 increased dry leaf production until a maximum of 1.15
g/plant (minimal P). Supplementation with P led to the largest increase in the production of dry stem (3.15 g/plant at 84.39 mg∙dm−3) (minimal N). N addition
resulted in xylopodium production growing proportionally to the fertilization dose: the highest dose caused the highest production of dry xylopodium (2.49 g/plant at 259 DAT and 10.16 g/plant at 770 DAT) (minimal P).
The growth of the carobinha is age and season dependent. As the life cycle progresses, more stem and more branches are produced in detriment of height, with a reflection on the increased growth of the xylopodium, a storage organ important for the regrowth after the dormancy period and environmental stresses [27]. This phenomenon defines the change in the growth behavior along the life cycle, justifying the formation of underground forests in native areas, with sprouts emerging from the xylopodium or from the stem base [28]. The large decrease in leaf number in the older plants indicates that the deciduousness typical of the species [29] occurs even in the absence of a water deficit. Consi-dering that the carobinha organs used in the traditional medicine are the leaves and the roots [5] [6], the best time to harvest must be taken into account, since, the older the plant, the higher root production is. On the other hand, leaf pro-duction is larger upon regrowth in summer and lower in winter.
DOI: 10.4236/ajps.2017.813227 3387 American Journal of Plant Sciences
Figure 4. Effects of age at harvest and of nitrogen (N) and phosphorus (P) fertilization on carobinha yield. Production of dries
DOI: 10.4236/ajps.2017.813227 3388 American Journal of Plant Sciences
fact that fertilization with nitrogen and phosphorus had no effect on root pro-duction seems to confirm that root growth does not depend on nutrient supple-mentation [29] [31] [32]. However, in a previous study, the addition of P to-gether with chicken manure fertilizer led to increased root production [13]. In the present work, we showed that nitrogen fertilization affects the development of the aerial part in the carobinha, reflected in a higher number of leaves, whe-reas supplementation with P incwhe-reases stem production, an interesting observa-tion considering the change in plant growth.
3.3. Effect of Age at Harvest and N and P Fertilization
on Nutrient Uptake
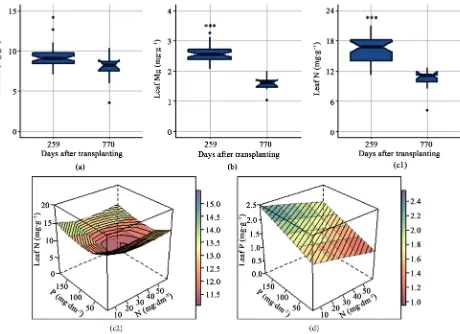
[image:12.595.70.530.322.656.2]Macronutrient concentration decrease in older plants. In the leaves between 259 and 770 DAT, Ca levels reduced 14.23% (p = 0.03) (Figure 5(a)); Mg levels 39.40% (p < 0.01) (Figure 5(b)) and N levels were 35.01% lower (p < 0.01) (Figure 5(c1)). Soil fertilization with P affected the concentration of K (p = 0.04), N (p < 0.07) and P (p = 0.01) in the leaves as well; however, N and P had
Figure 5. Effects of age at harvest and of nitrogen (N) and phosphorus (P) fertilization on macronutrient concentrations in
DOI: 10.4236/ajps.2017.813227 3389 American Journal of Plant Sciences
no effect on Ca (N, p = 0.98 and P, p = 0.80) and Mg levels (N, p = 0.85 e P, p = 0.59) in the leaves. Regarding K, the P coefficients were significant in the qua-dratic (p = 0.04) and quaqua-dratic root (p = 0.02) models, while the coefficients of regression determination were not (R2 = 0.22, p = 0.21 and R2 = 0.26, p > 0.10,
respectively). Supplementation with P reduces the N levels from highest (15.20 mg∙g−1) at the minimal P dose to lowest (12.06 mg∙g−1) at a dose of 69.31
mg∙dm−3 of P (highest N) (Figure 5(c2)). Nevertheless, the addition of P
pro-portionally increased the P concentrations, reaching a maximum of 1.65 mg∙g−1
at the highest dose (minimal N) (Figure 5(d)).
In the roots, between 259 and 770 DAT, K levels decreased 50.32% (p < 0.01) (Figure 6(a)); Ca levels 7.08% (p = 0.04) (Figure 6(b)); Mg levels 29.80% (p < 0.01) (Figure 6(c)) and N levels were 59.91% lower (p < 0.01) (Figure 6(d)). P concentration constituted an exception, increasing 232.74% (p < 0.01) (Figure 6(e)).
Addition of N and P did not affect K (N, p = 0.36 and P, p = 0.46) or Ca levels (N, p = 0.27 and P, p = 0.81) on the roots. However, adding N increased Mg le-vels at 259 DAT and reduced Mg lele-vels at 770 DAT (p = 0.03). Fertilization with P led to increased Mg levels at both harvests (p < 0.05) (Figure 6(c)). At 259 DAT, 30.03 mg∙dm−3 N and the highest P dose resulted in the highest Mg levels
(2.84 mg∙g−1), while, at 770 DAT, 39.80 mg∙dm−3 of N and the minimal P dose
resulted in the lowest Mg levels (1.46 mg∙g−1). Supplementation with both N (p =
0.01) and P (p = 0.04) led to increased N concentrations (Figure 6(d)); and 43.32 mg∙dm−3 N and the higher P dose led to the maximum N concentrations
(15.11 mg g−1, at 259 DAT and 7.43 mg∙g−1 at 770 DAT). However, P acted more
expressively at the dose of 133.86 mg∙dm−3 or higher. In this context, the
minim-al N dose and 73.70 mg∙dm−3 P resulted in the lowest N levels (9.76 mg∙g−1 at 259
DAT and 2.08 mg∙g−1 at 770 DAT). The combined addition of N and P led to
in-creased P concentrations at 259 DAT (Figure 6(e)); the addition of 49.97 mg∙dm−3 of N and the maximum P dose increased the P concentration to its
maximum (3.05 mg∙g−1). However, at 770 DAT the isolated effect of each
nu-trient was stronger than their combined action. At the lowest P dose, N addition elevated P concentration from 1.04 mg∙g−1 (4.20 mg∙dm−3) to 2.97 mg g−1 (59.85
mg∙dm−3) (p = 0.04).
DOI: 10.4236/ajps.2017.813227 3390 American Journal of Plant Sciences
Figure 6. Effects of age at harvest and of nitrogen (N) and phosphorus (P) fertilization on macronutrient concentrations in
DOI: 10.4236/ajps.2017.813227 3391 American Journal of Plant Sciences
Figure 7. Effects of age at harvest and of nitrogen (N) and phosphorus (P) fertilization on
DOI: 10.4236/ajps.2017.813227 3392 American Journal of Plant Sciences
highest N dose led to the highest K (5.63 mg at 259 DAT and 1.61 mg at 770 DAT), Ca (88.23 mg at 259 DAT and 26.19 mg at 770 DAT). The highest N dose regardless of harvest ages led to the highest leaf P contents (19.86 mg at 259 DAT and 1.51 mg at 770 DAT) but with an increase in the P dose up to 129.33 mg∙dm−3 in the younger plants (259 DAT) and to the highest P dose in the older
plants (770 DAT). On the other hand, in the older plants, an increase in the N dose up to 47.24 mg∙dm−3 elevated the Mg levels to a maximum of 23.72 mg
(minimal P). An increment in the P dose up to 90 mg∙dm−3 at 259 DAT and the
minimum P dose at 770 DAT, both with maximum N dose increased the leaf N content to the highest levels (193.85 mg at 259 DAT and 5.22 mg at 770 DAT).
In the roots, age at harvest and N (p > 0.99) and P (p = 0.81) addition did not affect K contents. However, age at harvest and P addition had a slight effect on Ca contents p = 0.08) (Figure 8(a)). In the plants at 259 DAT, an increment in the P dose up to 62.52 mg∙dm−3 resulted in the highest levels of radicular Ca
(17.19 mg), while an increase to the maximum P dose resulted in the lowest Ca contents (10.72 mg). As the plants aged, Ca contents decreased, whereas P addi-tion starting at a dose of 47.82 mg∙dm−3 increased these levels from a minimum
of 18.34 mg until a maximum of 45.18 mg at the highest P dose. On the other hand, with aging, Mg contents increased 69.57% (p = 0.01) (p = 0.01) (Figure 8(b)). The N addition affected N contents in the roots (p = 0.02) (Figure 8(c)). However, the linear (R2 = 0.108, p = 0.19) and quadratic root models (R2 = 0.101,
p = 0.23) were not adjusted to the effects of N. The N addition proportionally increased the levels of radicular N up to a maximum of 58.09 mg at the highest N dose. Together with age at harvest, N and P addition affected P contents (p = 0.04) (Figure 8(d)). In the plants at 259 DAT, the highest N and P doses led to the highest P levels (12.90 mg). However, the same N dose combined with the lowest P dose reduced the P contents to the minimum (2.94 mg). In the older plants (770 DAT), the lower N dose combined with the higher P dose resulted in a higher P level (55.63 mg), while the same N dose together with the lower P dose led a lower P content (9.45 mg).
DOI: 10.4236/ajps.2017.813227 3393 American Journal of Plant Sciences
Figure 8. Effects of age at harvest and of nitrogen (N) and phosphorus (P) fertilization on
nutrient contents in the carobinha roots. Contents of Ca (a) and P (d) by harvest age (259, n = 8 and 770 DAT, n = 5) and, N and P doses. Mg contents (b) by plant age at harvest (259, n = 72 and 770 DAT, n = 45). N levels (c) by N doses (n = 16 - 48). Fitted models are in Table 1. The Mg levels represents the average between treatments, and N contents refer to the average harvest age and the average P doses. Bars in the boxplot graphs indicate variability outside the upper and lower quartile, out-of-graph points in-dicate outliers, and the width of the box inin-dicates the sample size. *p > 0.05, **p > 0.01, ***p > 0.001, and ****p > 0.0001 by F test.
DOI: 10.4236/ajps.2017.813227 3394 American Journal of Plant Sciences
In the roots, supplementation with N acted synergistically with N, regardless of age, and with K, Ca, Mg, N and P in the leaves. However, it had no effect on K and Ca contents in the roots, since it did not affect radicular development. The growing addition of S doses in the form of ammonium sulfate may have in-creased the availability of ferredoxin (Fe2S2) involved in the transformation of
glutamine into glutamate following N uptake [15]. Furthermore, S is also present in cysteine and methionine, both crucial aminoacids in the assimilation of N in-to proteins, incrementing foliar N contents. Enhanced N uptake by the plants increases K demand in the tissues, and may result in K deficiency or dilution [14]. However, fertilization with K must have been sufficient to supply the in-creased demand caused by the foliar growth promoted by N. Due to its role in the incremented foliar growth, N also increased Ca demands in the leaves. Be-sides, with the elevated chlorophyll levels caused by higher N availability, the demand for Mg, a chlorophyll constituent [12], increased as well.
Despite the fact that supplementation with P increased Mg and N concentra-tions in the roots and P levels in the leaves, reducing K and N levels in the leaves. Nevertheless, P did not show a clear effect on these levels, since it did not affect Mg and N contents in the roots or K contents in the leaves, but increased foliar N contents. Furthermore, K, Ca and Mg contents in the leaves did not show any response to P fertilization. In the roots and leaves, P acted synergistically only with itself, due to the increased P availability in the soil.
This study was done under moderately controlled conditions, so in the field the plant response may be different. But it shows that the phosphorus and ni-trogen fertilizer together allow further development of carobinha plants. Popula-tion studies can better clarify the role of N and P fertilizaPopula-tion in the genetic di-versity of the species. In addition, we observed high didi-versity among the plants, since the species has not yet been selected. Thus, both individuals responsive and efficient in the use of nutrients should be selected for commercial production [35]. We did not determine the levels of nitrate (N-NO3) and nitrite (N-NO2) in
plant tissue, N forms that may be toxic to humans [36]. Therefore, future studies can determine these levels in the tissues and indicate the level of nitrogen fertili-zation in the carobinha that is safe for human health [37]. Future studies may also quantify the loss levels of N and P.
4. Conclusions
DOI: 10.4236/ajps.2017.813227 3395 American Journal of Plant Sciences
plants is independent of water availability. Nutrient contents in foliar and radi-cular tissues are usually lower in the adult plant, with the exception of P, which increases. In the leaves, macronutrient levels increase with age, compared with the roots. In the younger plants, there is a nutrient concentration in the roots and an allocation synergy in the leaves. However, in adult plants, nutrient con-tents dilute in the roots, while in the leaves, exchangeable nutrients concentrate and less motile nutrients suffer an antagonistic effect.
Acknowledgements
The authors thank the Foundation for Support to the Development of Teaching, Science and Technology of the Mato Grosso do Sul State-FUNDECT and the Coordination for the Improvement of Higher Education Personnel-CAPES for the financial support for the accomplishment and publication of the present work.
Conflict of Interest
There are no conflicts of interest in present study.
References
[1] Hopkin, M. (2004) Brazilian Savannah “Will Disappear by 2030.” Nature.
https://doi.org/10.1038/news040719-6
[2] Klink, C.A. and Machado, R.B. (2005) Conservation of the Brazilian Cerrado. Con-servation Biology, 19, 707-713. https://doi.org/10.1111/j.1523-1739.2005.00702.x [3] Farias, R. and Proença, C. (2003) Jacaranda decurrens subsp. symmetrifoliolata
(Bignoniaceae), Novo Táxon Para O Bioma Cerrado. Boletim do Herbarium Bra-deanum, 11, 5-9.
[4] Rezende, A.V., Walter, B.M.T., Fagg, C.W., Fagg, J.M.F., Júnior, M.C. da S., Noqueira, P.E., de Mendonça, R.C. and Filgueiras, T. de S. (2008) Cerrado: Ecologia e Flora. In: Sano, S.M., de Almeida, S.P. and Ribeiro, J.F., Eds., 2nd ed., Embrapa Informação Tecnológica, Brasília.
[5] Casagrande, J.C., Macorini, L.F.B., Antunes, K.A., dos Santos, U.P., Campos, J.F., Dias-Júnior, N.M., Sangalli, A., Lima Cardoso, C.A., do Carmo Vieira, M., Rabelo, L.A., Paredes-Gamero, E.J., dos Santos, E.L. and de Picoli Souza, K. (2014) Antioxidant and Cytotoxic Activity of Hydroethanolic Extract from Jacaranda decurrens Leaves. PLoS ONE, 9, e112748.
https://doi.org/10.1371/journal.pone.0112748
[6] Santos, J.A., Arruda, A., Silva, M.A., Cardoso, C.A.L., Vieira, M.D.C., Kassuya, C.A.L. and Arena, A.C. (2012) Anti-Inflammatory Effects and Acute Toxicity of Hydroethanolic Extract of Jacaranda decurrens Roots in Adult Male Rats. Journal of ethnopharmacology, 144, 802-805. https://doi.org/10.1016/j.jep.2012.10.024
[7] Antunes, K.A., Baldivia, D. da S., da Rocha, P. dos S., Casagrande, J.C., Argandoña, E.J.S., Vieira, M. do C., Cardoso, C.A.L., dos Santos, E.L. and de Picoli Souza, K. (2016) Antiobesity Effects of Hydroethanolic Extract of Jacaranda decurrens Leaves.
Evidence-Based Complementary and Alternative Medicine, 2016, 1-8.
https://doi.org/10.1155/2016/4353604
Na-DOI: 10.4236/ajps.2017.813227 3396 American Journal of Plant Sciences tive and Alien Herbaceous Plants in the Brazilian Cerrado Are (Co-)Limited by Different Nutrients. Plant and Soil, 400, 231-243.
https://doi.org/10.1007/s11104-015-2725-9
[9] Lannes, L.S., Bustamante, M.M.C., Edwards, P.J. and Venterink, H.O. (2012) Alien and Endangered Plants in the Brazilian Cerrado Exhibit Contrasting Relationships with Vegetation Biomass and N :P Stoichiometry. New Phytologist, 196, 816-823.
https://doi.org/10.1111/j.1469-8137.2012.04363.x
[10] Bustamante, M.M.C., de Brito, D.Q., Kozovits, A.R., Luedemann, G., de Mello, T.R.B., de Siqueira Pinto, A., Munhoz, C.B.R. and Takahashi, F.S.C. (2012) Effects of Nutrient Additions on Plant Biomass and Diversity of the Herbaceous-Subshrub Layer of a Brazilian Savanna (Cerrado). Plant Ecology, 213, 795-808.
https://doi.org/10.1007/s11258-012-0042-4
[11] Novais, R.F., Smyth, T.J. and Nunes, F.N. (2007) Fósforo. In: Novais, R.F., Alvarez Venegas, V.H., Barros, N.F. de, Fontes, R.L.F., Cantarutti, R.B. and Neves, J.C.L., Eds., Fertilidade do Solo, 1st ed., Sociedade Brasileira de Ciência do Solo, Viçosa, MG, Brazil, 471-552.
[12] Taiz, L. and Zeiger, E. (2010) Plant Physiology. Taiz, L. and Zeiger, E., Eds., 5th ed., Sinauer Associates, Inc, Sunderland, MA, USA.
[13] Gonçalves, W.V., Vieira, M. do C., Heredia Zárate, N.A., Luciano, A.T., Rodrigues, W.B. and Tabaldi, L.A. (2010) Fósforo e Cama-de-Frango Semidecomposta na Produção de Carobinha (Jacaranda decurrens subsp. symmetrifoliolata). Horticul-tura Brasileira, 2, 3215-3220.
http://www.abhorticultura.com.br/eventosx/trabalhos/ev_4/A2536_T5120_Comp.p df
[14] Cantarella, H. (2007) Nitrogênio. In: Novais, R.F. de, Venegas, V.H.A., Barros, N.F. De, Fontes, R.L., Cantarutti, R.B. and Neves, J.C.L., Eds., Fertilidade do Solo, 1st ed., Sociedade Brasileira de Ciência do Solo, Viçosa, MG, Brazil, 375-470.
[15] Souza, S.R. and Fernandes, M.S. (2006) Nitrogênio. In: Fernandes, M.S., Ed.,
Nutrição Mineral de Plantas, 1st ed., Sociedade Brasileira de Ciência do Solo, Viçosa, MG, Brazil, 214-252.
[16] Chien, S.H., Gearhart, M.M. and Collamer, D.J. (2008) The Effect of Different Ammonical Nitrogen Sources on Soil Acidification. Soil Science, 173, 544-551.
https://doi.org/10.1097/SS.0b013e31817d9d17
[17] Razaq, M., Zhang, P., Shen, H. and Salahuddin (2017) Influence of Nitrogen and Phosphorous on the Growth and Root Morphology of Acer mono. PLoS ONE, 12, e0171321. https://doi.org/10.1371/journal.pone.0171321
[18] Ahmed, S. and Hassan, K. (2015) Effect of Magnetic Water and Phosphorus Rates on Some Nutrients Uptake by Summer Squash Grown in Calcareous Soil of Duhok Governorate. Science Journal of University of Zakho, 3, 250-260.
https://doi.org/10.25271/2015.3.2.46
[19] R Core Team. (2016) R: A Language and Environment for Statistical Computing. R Foundation for Statistical Computing, Vienna. https://www.r-project.org/
[20] Zeviani, W.M. and Serafim, M.E. (2016) EACS: Estatística Aplicada à Ciência do Solo. http://gitlab.c3sl.ufpr.br/walmes/EACS
[21] Venables, W.N. and Ripley, B.D. (2002) Modern Applied Statistics with S. Modern Applied Statistics with S, Springer New York, New York, NY.
https://doi.org/10.1007/978-0-387-21706-2
DOI: 10.4236/ajps.2017.813227 3397 American Journal of Plant Sciences [23] Sarkar, D. (2008) Lattice: Multivariate Data Visualization with R. Springer, New
York, NY. https://doi.org/10.1007/978-0-387-75969-2 [24] Wickham, H. (2009) ggplot2. Springer, New York, NY.
https://doi.org/10.1007/978-0-387-98141-3
[25] Hill, A. V. (1910) A New Mathematical Treatment of Changes of Ionic Concentra-tion in Muscle and Nerve under the AcConcentra-tion of Electric Currents, with a Theory as to Their Mode of Excitation. The Journal of Physiology, 40, 190-224.
https://doi.org/10.1113/jphysiol.1910.sp001366
[26] Riley, D. and Barber, S. a. (1971) Effect of Ammonium and Nitrate Fertilization on Phosphorus Uptake as Related to Root-Induced pH Changes at the Root-Soil Inter-face1. Soil Science Society of America Journal, 35, 301.
https://doi.org/10.2136/sssaj1971.03615995003500020035x
[27] Rachid-Edwards, M. (1956) Alguns Dispositivos para Proteção de Plantas Contra a Seca e o Fogo. Boletim da Faculdade de Filosofia, Ciências e Letras, Universidade de São Paulo. Botânica, 13, 35-69.
https://doi.org/10.11606/issn.2318-5988.v13i0p35-69
[28] Alves, R.J. V, Da Silva, N.G., Fernandes Júnior, A.J. and Guimarães, A.R. (2013) Longevity of the Brazilian Underground Tree Jacaranda decurrens Cham. Anais da Academia Brasileira de Ciencias, 85, 671-677.
https://doi.org/10.1590/S0001-37652013005000038
[29] Sangalli, A., Vieira, M.C., Heredia Zárate, N.A. and Scalon, S.P.Q. (2011) Desenvolvimento e Produção da Carobinha (Jacaranda decurrens Cham. Subsp.
symmetrifoliolata Farias e Proença) Cultivada sob Dois Arranjos de Plantas, com ou sem Cobertura de Cama-de-Frango no Solo. Revista Brasileira de Plantas Medici-nais, 13, 439-446. https://doi.org/10.1590/S1516-05722011000400009
[30] Barker, A. and Bryson, G. (2006) Nitrogen. In: Barker, A. V. and Pilbeam, D.J., Eds.,
Handbook of Plant Nutrition, CRC Press, 21-50.
https://doi.org/10.1201/9781420014877.sec2
[31] Gouvea, A.B., Vieira, M.C., Heredia Z., N.A. and Pinto, J.V.C. (2014) Influência da Densidade de Plantio e da Cama de Frango na Produção da Carobinha (Jacaranda decurrens Cham. ssp. symmetrifoliolata Farias & Proença). Revista Brasileira de Plantas Medicinais, 16, 481-489. https://doi.org/10.1590/1983-084X/09_167 [32] Moreira, D.G., Vieira, M.C., Heredia Zárate, N.A., Carnevali, T.O., Torales, E.P.,
Tabaldi, L.A., Lourente, E.R.P. and Mercante, F.M. (2016) Produtividade de Vinagreira, Pimenta Rosa e Carobinha Cultivadas em Sucessão a Mucuna Preta e Feijão de Porco. Revista Brasileira de Plantas Medicinais, 18, 326-335.
https://doi.org/10.1590/1983-084X/15_085
[33] Jarrell, W.M. and Beverly, R.B. (1981) The Dillution Effect in Plant Nutrition Stu-dies. Advances in Agronomy, 34, 197-224.
https://doi.org/10.1016/S0065-2113(08)60887-1
[34] Lynch, J. (1995) Root Architecture and Plant Productivity. Plant Physiology, 109, 7-13. https://doi.org/10.1104/pp.109.1.7
[35] Han, M., Okamoto, M., Beatty, P.H., Rothstein, S.J. and Good, A.G. (2015) The Ge-netics of Nitrogen Use Efficiency in Crop Plants. Annual Review of Genetics, 49, 269-289. https://doi.org/10.1146/annurev-genet-112414-055037
DOI: 10.4236/ajps.2017.813227 3398 American Journal of Plant Sciences
https://doi.org/10.1152/japplphysiol.00046.2010
[37] Hord, N.G. and Conley, M.N. (2017) Regulation of Dietary Nitrate and Nitrite: Ba-lancing Essential Physiological Roles with Potential Health Risks. In: Bryan, N.S. and Loscalzo, J., Eds., Nitrite and Nitrate in Human Health and Disease, Springer International Publishing, Cham, 153-162.