Munich Personal RePEc Archive
Differences in Wealth, Education, and
History
Curtis Jr, James E
The James Edward Curtis Jr Education Foundation, JECJEF
University
22 September 2017
Online at
https://mpra.ub.uni-muenchen.de/84818/
Differences in Wealth, Education, and History
1 2 3
James Edward Curtis, Jr.
4 5 6
September 22, 2017
7 8 9
ABSTRACT An understanding of the freedoms (or the lack of freedoms) and their economic consequences on early black
10
Americans provides an informative understanding to the freedoms (or the lack of freedoms), and their economic consequences on
11
other, modern ethnic groups. James Curtis Jr (2017) investigates the link between the social asymmetry and economic asymmetry
12
among early blacks and whites in the United States of America. For the empirical study, James Curtis Jr (2017) uses
cross-13
sectional variables from the Integrated Public Use Microdata Sample (IPUMS), developed informative conditional ratios, and
14
employed least squares statistical analyses.
15 16
FINDINGS This study finds that economic differences among ethnic groups, as measured by differences between early blacks and
17
whites, are intertwined with asymmetrical freedoms, leading to statistically insignificant returns to education, as measured by literacy.
18
One might conclude that the individual’s basic protection of life, liberty, and the pursuit of happiness must proceed any expectations
19
of measured returns to schooling, particularly among individuals in disenfranchised groups. Furthermore, one might propose
20
education policy such that modern higher education investment programs prioritize education entrepreneurs and/or
21
state/social planners with academic research familiarity of differences in wealth.
22 23
This research is a revision of November 2002, November 2010 and January 2012 working papers. Copyright 2017.
24 25
James Edward Curtis, Jr. is the President & Research Economist of The James Edward Curtis Jr Education Foundation,
26
Correspond with James Edward Curtis, Jr. at PO Box 3126, Washington, District of Columbia 20010, or
27
phone (202) 739-1962, email [email protected] Learn more at jecjef.net.
INTRODUCTION
31
32
Curtis Jr (2012) stated
33
The debate over market/individual regulation and freedom dates as far back as religious Holy documents, such as
34
The Holy Bible. The Old Testament of The Holy Bible tells of Moses detailing the Ten Commandments, in
35
Exodus 20:2-17. The Ten Commandments are God’s basic instruction to his people. The Ten Commandments are seen
36
as the paraphrasedcontrolsof individuals in markets and society, for those moved by Old Testament Biblical doctrine.
37
One might interpret the New Testament of The Holy Bible as expressing a morefreeform of living, for instance, in
38
passages such as Philippians 4:6-7, “Be careful for nothing; but in everything by prayer and supplication with thanksgiving
39
let your requests be made known unto God. And the peace of God, which passeth all understanding,
40
shall keep your hearts and minds through Christ Jesus” (KJV The Holy Bible, p. 263), and
41
Philippians 4:13, I can do “all things” through Christ Jesus who strengthens (KJV The Holy Bible, p. 263).
42 43
Similarly, the debate of more regulation or relative freedom of immigrants has moved backed into the spotlight of
44
America, at the start of 21stcentury, with large masses of Latino/Latina Americans migrating from Central America and
45
South America to North America. Joseph Ferrie (1999) thoroughly documented the mid-19thcentury wave of
46
immigrants to the United States of America from Europe. But before the Latino/Latina American immigration discussion
47
commenced and before the European American immigration wave of the mid 19thcentury, the regulation and freedom
48
of black Americans was central to the governance issue of the United States of America. In many ways, a clear
49
understanding of the freedoms (or the lack of freedoms) and their economic consequences on early black Americans
50
provides an understanding to the freedoms (or the lack of freedoms), and their economic consequences on other, modern
51
ethnic groups.
52 53
The experience of blacks in America can be divided into three separate discussions, the experience of: (i) free blacks
54
prior to the Civil War, (ii) slaves prior to emancipation and (iii) the experiences of all blacks after the Civil War. But the
55
socioeconomic experiences of the latter two are linked to that of the former:
56 57
…In other words, the day after a slave is emancipated from an intergenerational experience of enslavement, what does
58
that ex-slave do? What are his or her goals? Does the slave have a contemporaneous objective to supply labor and
59
consume necessary commodities in a manner that highly discounts the future in order to survive on a day to day basis at
60
the expense of future consumption, or does the slave have an intertemporal objective to store material possessions in a
61
manner that minimizes current consumption, possibly below subsistence, in order to provide a better experience for his or
62
her children? Prior to southern emancipation, some blacks were able to ponder on the same decisions.
63 64
Therefore, this paper focuses on the plight of the average antebellum free black American, which, in hindsight, illuminated
65
the path of the average black American, after emancipation, as well as Americans of other ethnicities over time.”
Outline
68
69
I presentthe methods of economic analysis, results, and conclusionsfrom comparing the economic experiences of white Americans
70
and ex-slaves to free black Americans 1850-1870. Through these analyses, I intend to uncover the portion of the ethnic
71
experience explained by institutional barriers and the portion of their experience explained by available socioeconomic choices,
72
particularly, as it relates to education or literacy. This paper will provide one of the first comprehensive, synthesized analyses of the
73
demographic, economic, education, and legal freedom experiences of free Black Americans, most who are ex-slaves, compared to
74
whites in the United States of America.
75
76
77
Economic Theory: The Economic Expectations before Investigating Evidence in the Data
78 79
The Study of Wealth. Wealth is the accumulation of material resources that have market value for current or future consumption.
80
Furthermore, savings, initial wealth and the compounded rate of return on the invested savings and initial wealth determine wealth.
81
The following section describes universal and group-based expectations, based on economic theory, in the areas of economic
82
growth (including wealth, property and savings), economic inequality, and comparative economic outcomes. Wealth, property, and
83
measures of classical economic choice characteristic will be employed to measure outcomes, compared to expectations.
84
85
Economic Growth and the Parabolic Property Ownership Expectations. To analyze the relationship between age and property, I
86
employ methods developed by Lee Soltow (1975). He expected the old to hold more property than the young : He found that
87
plots of individuals holding property across age groups shows a "very rapid rise in the probability of ownership in the first 10 years
88
of adulthood with a tapering affect appearing thereafter" (Soltow, p.28). He suggests that this concavity was affected by the
89
income and savings decisions and distribution of the population.
91
Soltow used estimates of non-property-holders to develop a parabolic model of property holding over different age rages. This
92
theoretical parabolic behavior is based on an assumption that proportion of non-property-holders is fixed across age groups.
93
Soltow expects that 79.3 percent of thirty year-olds who did not hold property in their twenties will not hold property for the
94
same reason as the 79.3 percent who did not hold property when they were in their twenties:
95
"The .793 is a quantification of the importance of all those characteristics inhibiting ownership, such as lack of
96
knowledge of available land or credit, inability to speak or write English or possibly read any other language, unwillingness
97
to accept the obligations of ownership, inability to save because of low income or high consumption, legarthy because of
98
sickness or poor health, and so on. If quantification of .79 were to operate for the group from age 30 to 39, one would
99
expect the .793 of the property-less at age 30 to remain property-less. Thus, 1-(.793)2would own property in the
100
30-39 group" (Soltow, 1972, p.30).
101 102
"The strength of America's system, as seen by nineteenth century writer, was that an individual had the opportunity to
103
improve his position over time. This opportunity meant that he was not placed in a fixed position in society. He might
104
have had to work hard, but he could expect betterment in his wealth status. We can capture this phenomenon by
105
studying the participation rate (proportion of men who held property) of peoples of different ages in a given year. Sure
106
this rate, as measured by (real estate holding) or (total estate holding) must be higher for the old than for the young....If
107
the majority of individuals in the economy are to experience betterment in economic position during their lifetimes, more
108
and more should rise above the level of being poor, above some minimum wealth amount" (p.27).
109 110
Economic Growth and the Linear Growth in Wealth Expectations. To analyze the relationship between age and wealth, I employ
111
additional methods that were first employed by Soltow (1975). He plotted age-wealth coordinates and expected a positive
112
relationship: "Material betterment dominated the economic thinking men. Those with wealth expected to have more each year as
113
they grew older; accumulation was a sign or index of recognition of an individual's past economic activities. Wealth mirrors the past
114
better than income since the pleasures of past consumption may be forgotten. It is only saving from past income that is now
115
reflected in one's wealth" (Soltow, 1975, p.69).
116
117
Soltow did, in fact, observe a linear relationship between estate values and age. The parabolic effect of age on property holding was
118
not present when observing average wealth at different ages. "The group average rises strongly from 20-29 to 30-39 and then
119
has its greatest thrust in going from 30-39 to the 40-49 group. The average tapers off but continues to rise rather surprisingly
into old age. There is certainly no strong parabolic effect, as can be seen in...the proportion of men with property" (p.70). He also
121
suggested that the stability of the 1850 pattern was "proof that the age patterns were established decades before the 1850 and
122
the concepts of economic betterment must have been pervasive" (Soltow, 1975, pp.74-75).
123
124
Economic Growth and the Savings Rate Expectations. Finally, I use the method proposed by Soltow (1975) to analyze savings
125
using wealth annualized at each age. Soltow used the differences in wealth at each age to observe the continuity of savings that
126
continued through old ages.Furthermore, Soltow found the average annual savings rate was about 5 percent. This was obtained by
127
[1] averaging the increase in wealth per age groups 20-69 or 90 percent of the adult male population
128
{(582+804+311+303)/4 =500}, [2] annualizing the average increase per age group or decade {500/10=50}, and [3]
129
dividing the average annual increase in wealth by the average wealth in 1850 {50/1001=.05}. Note that this finding of 5
130
percent is the average for individuals. Since households possess more wealth than individuals, this rate is expected to much be
131
smaller in the forthcoming empirical analysis. "The difference between in wealth levels from one year to the next gives an index of
132
saving for a year" (pp.71-72).
133
134
Classical Characteristic Premium Expectations.Schooling.Jacob Mincer (1974) described a direct relationship between schooling
135
and earnings:
136
“it is equally correct to say that the distribution of earnings is determined by the distribution of accumulated human capital
137
and of rates of return to human capital investment or that the distribution of earnings is determined by the distribution of
138
ability and opportunity. Or, putting it in a causal hierarchy, the distribution of accumulated human capital is a proximate
139
determinant of the distribution of earnings, and is treated that way in this study. In turn, ability and opportunity determine
140
the distribution of human capital. (Mincer 1974, p.138)”
141 142
Skill.Classical economic theory suggests workers are paid their additions to production. This produces an expectation of higher
143
wages for higher skilled workers and lower wages for lower skilled workers. Holding constant the intertemporal rate of return to
saved wages, holding constant differences in initial wealth, and holding constant the number of working hours (see James Curtis Jr,
145
December 2002), it is reasonable expect higher wealth among higher skilled employees.
146
Convergence to Equality Expectations. To measure economic inequality and compare differences in economic outcomes, I analyze
147
differences in differences in mean wealth between blacks and whites, and property ownership between blacks and whites. The
148
following ratios measure differences in wealth and differences in property ownership among two comparison groups to obtain
149
comparative returns to classical characteristic choices. Foremost, thecomparative wealth ratiois
150
151
Equation 1.1
[W
X J T/W
X J’ T] / [W
X’ J T/W
X’ J’ T]
≥
1
152
Equation 1.1’
[W
X J T/W
X J’ T] / [W
X’ J T/W
X’ J’ T]
≤
1
153
154
where WX J T is the mean wealth of the members of group J who made investment X at time T.
155
156
The comparative wealth ratio ignores differences in wealth levels and measures the return to classical characteristic choices among
157
groups. For instance, the ratio measures the schooling premium for blacks relative to the schooling premium for whites. If the ratio
158
is less than one, then blacks with many years of schooling may have lower levels of wealth relative to whites with proportional years
159
of schooling, and, thus, the returns to schooling among whites outpace the returns to schooling among blacks, in terms of wealth.
160
161
Similarly, thecomparative property ownership ratiois
162
163
Equation 1.2
[
ρXJT
/
ρXJ’T
] / [
ρX’JT
/
ρX’J’T
]
≥
1
164
Equation 1.2’
[
ρXJT
/
ρXJ’T
] / [
ρX’JT
/
ρX’J’T
]
≤
1
166
whereρXJT is the percentage of the members of group J who own property and made investment X at time T. 167
168
The comparative property ownership ratio can be interpreted the same as the comparative wealth ratio. The comparative property
169
ownership ratio measures the impact of classical characteristics on property ownership of group J to the impact of classical
170
characteristics of property ownership of group J’. For instance, the ratio measures the schooling premium of blacks relative to the
171
whites. If the ratio is less than one, then blacks with many years of schooling may own less property relative to whites with
172
proportional years of property, and, thus, the returns to schooling among whites with many years of schooling outpace the returns
173
to schooling among blacks with proportional years of schooling, in terms of property ownership.
174
175
Motivations for Multivariate Analysis. To observe of combined effect of laws, demography and economic geography of the
176
economic outcomes of whites and blacks, I employed standard minimization of the sum of squared errors and conducted non-linear
177
multivariate analysis on the logarithmic total wealth of whites and blacks in 1860 and 1870. Previous papers provide theoretical
178
motivation for econometric modeling choices, which are similar to this presentation. Logarithmic wealth is regressed against proxy
179
variables for earnings and savings, proxy variables for initial wealth, and household formation variables. Including slave state-free
180
state residency variables and regional residency variables could lead to multicolinearity, due to possible endogeneity. The directions
181
of the predictions of estimated coefficients, which are statistically significant at a 95 percent level of significance, were summarized
182
in the results section.
183
184
RESULTS
186
187
The Mid-19thCentury Age and Property Profiles of Whites and Free Blacks in the United States of America
188 189
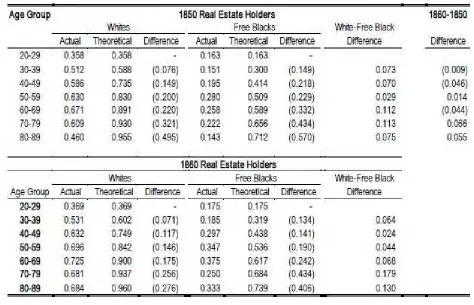
In 1850, Table 8ab-1 shows that between 35.8 – 67.1 percent of whites were real estate property holders across different
190
age groups while only 14.3 - 28.0 percent of free blacks were real estate property holders across age groups.
191
[image:10.612.94.568.292.597.2]192 193
Table 8ab-1. Real Estate Property-Holding Patterns by Age Group and Race, 1850-1860
194 195 196 197 198 199 200 201 202 203 204 205 206 207 208 209 210 211 212 213 214 215 216 217 218
Source:Information collected, calculated and compiled by James Curtis Jr (2002); IPUMS
219 220
The proportion grew to 36.9 - 72.5 percent for whites and 17.5-37.5 percent for free blacks in 1860. Furthermore, when
221
comparing actual to fixed proportions among free blacks and whites, the actual white proportion of property-holders across age
groups was closer to the white fixed or theoretical proportions in 1850 and 1860. This suggests that the events which prevent
223
holding property across age groups were relatively more fixed for whites than free blacks. Instead, enforcement of laws that reduced
224
the rights of free blacks, such as the Fugitive Slave Act, had a direct impact on the capacity of the average free black to hold
225
property, producing relatively more random patterns of holding property across all ages. When comparing white-free black
226
differences in 1850 and 1860, Table 7a shows that white-free black differences fell for younger members of the age distribution
227
but grew for the older members of the distribution.
228
229
The Mid-19thCentury Age and Wealth Profiles of Whites and Blacks in the United States of America
230 231
Figures 3.a.-3.f. are plots of the age-wealth profiles by race, year and cross section. Figure 3b plots total wealth and shows the
232
least amount of dissaving occurring among whites.
233
237 238
Figures 3.a.-3.f. Age-Wealth Profiles of Whites and Blacks, 1850 through 1870
239 240 241 242 243 244 245 246 247 248 249 250 251 252 253 254 255 256 257 258 259 260 261 262 263 264 265 266 267 268
269 270
Source:Information collected, calculated and compiled by James Curtis Jr (2002); IPUMS
However, when comparing to blacks and the real estate wealth of whites and blacks, dissaving is definite reality at older ages20.
273
20 Masson (1986), Mirer (1979) and Shorrocks (1975) found cross-sectional age-wealth profiles that were concave only
274
when they did not control for factors such as cohort and mortality differences.
275
276
Furthermore, the difference between black and white age-wealth profiles is quite dramatic: The distance between black and white
277
profiles tends to peak in the fifties. Finally, Figures 3c-f show that the dominant wealth possession of whites remained across time,
278
education and region.
279
280
These profiles are preliminary evidence that making choices to improve education and social surrounding did not provide a clear
281
wealth reward. The local definition of free black rights had diluted any attempts to make individual economic gains.
282
283
The Mid 19thCentury Savings of Whites and Free Blacks in the United States of America
284
285
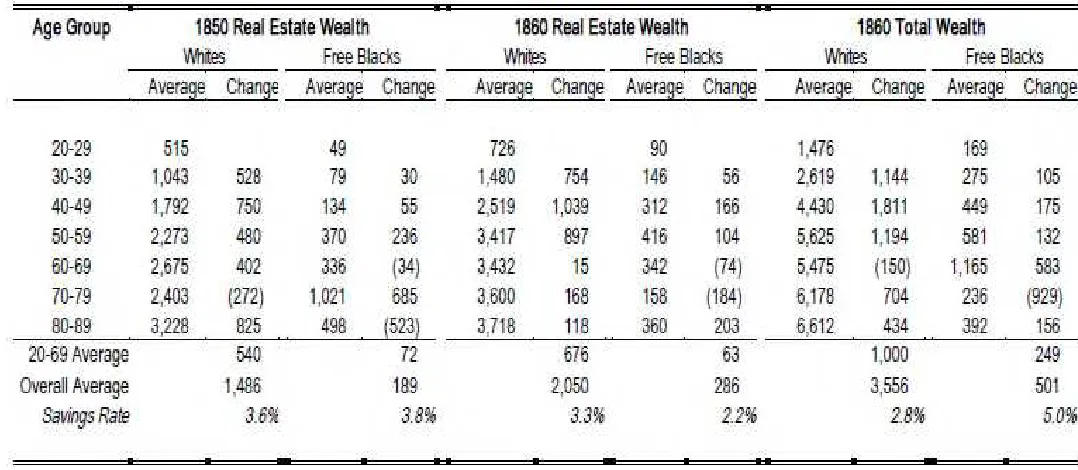
Table 8c shows that white households (3.6 percent) saved less real estate wealth, annually, than free black households (3.8
286
percent) in 1850.
287
288
Table 8c-1. Wealth Accumulation Patterns by Age Group and Race, 1850-1860
290 291 292 293 294 295 296 297 298 299 300 301 302 303 304 305 306 307
Source:Information collected, calculated and compiled by James Curtis Jr (2002); IPUMS
308 309
But by 1860, free black households (2.2 percent) saved less real estate wealth than white households (3.3 percent). This result is
310
picking up the economic push effects of enhanced enforcement of controversial fugitive slave laws. But, in terms of total wealth,
311
free black households (5.0 percent) were saving more than whites in 1860 (2.8). This is both attributed to the low level of
312
wealth in free blacks started from and possibly the desire for descendents to have an enriched economic experience.
313
314
The Mid 19thCentury Schooling and Wealth of Whites and Blacks in the United States of America
315 316
Jacob Mincer (1974) described a direct relationship between schooling and earnings. When comparing the real estate wealth of
317
literate and illiterate free blacks, literate free blacks outperformed illiterate free blacks. These results held when comparing
318
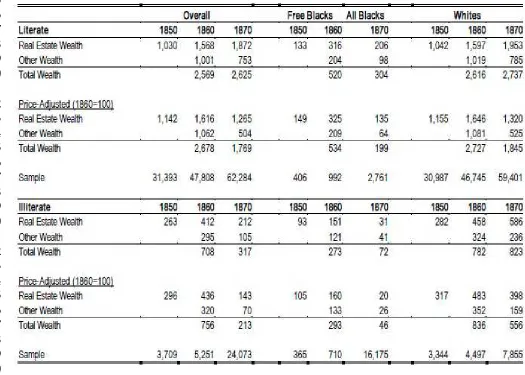
differences in other and total forms of wealth among literate and illiterate free blacks. Table 8a-2 shows that literate free blacks
319
possessed $520 in nominal total wealth in 1860 prior to emancipation.
320
321
Table 8a-2. Mid 19thCentury Schooling and Mean Wealth of Whites and Blacks
323 324 325 326 327 328 329 330 331 332 333 334 335 336 337 338 339 340 341 342 343 344 345 346 347 348 349 350
Source:Information collected, calculated and compiled by James Curtis Jr (2002); IPUMS
351 352
This was higher than the $273 possessed by illiterate free blacks. Note that literate free blacks were equally likely as illiterate free
353
blacks to hold real estate or other forms of property. However, literate blacks had 19.9 percent (520/2616) of literate white
354
total wealth while illiterate free blacks had 34.9 percent (273/782) of illiterate white wealth in 1860. These results may imply
355
that the penalty for illiteracy was so severe that the wealth of illiterate whites was relatively closer to wealth of illiterate free blacks
356
than wealth among literate free blacks and whites. This is accredited to a nineteenth century racial asymmetrical skill-bias in favor
357
literate whites: Free blacks and whites were proportionately penalized but not proportionately rewarded for education. Furthermore,
when we ignore differences in wealth levels among free blacks and whites, literacy did not provide free blacks an advantage relative
359
to whites.
360
361
Overall, investing time and resources in education does not guarantee economic equality if factors such as initial resources vastly
362
differ. These results also imply that illiteracy penalized free blacks in manner similar to whites more than literacy benefited free
363
blacks relative to whites. This analysis directly links the asymmetrical enforcement of federal statutes by states, which affect the
364
rights of free blacks, to asymmetrical wealth returns to the optimal wealth generating characteristics, such as literacy.
365
366
The Mid 19thCentury Schooling and Real Estate of Blacks: A Comparison of Black Americans over Time
367
368
Real estate wealth differences favored literate blacks before and after emancipation. Table 8a-2 shows that literate free blacks
369
possessed nominal real estate wealth amounts of $133 in 1850 and $316 in 1860. This was higher than the $93 possessed
370
by illiterate free blacks in 1850 and $151 possessed by illiterate free blacks in 1860. Table 8a also shows that the
literate-371
illiterate ratio of average real estate wealth among free blacks grew from 1.3 in 1850 and 2.0 in 1860. This may be preliminary
372
evidence of a growing penalty for illiteracy. Literate free blacks were also more likely to hold real estate property than illiterate free
373
blacks even then proportion of literate free black property holders remained constant. Table 8b-2 shows that 20 percent of
374
literate free blacks in 1850 and 25 percent of literate free blacks in 1860 owned positive amounts of real estate wealth.
375
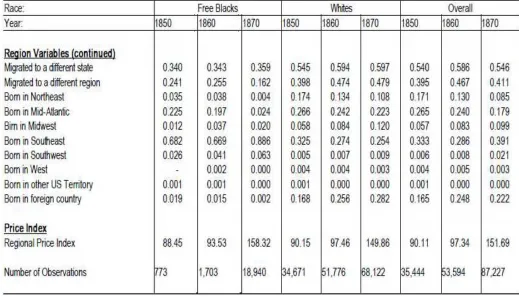
Table 8b-2. Mid 19thCentury Schooling and Mean Property Ownership of Whites and Blacks
377 378 379 380 381 382 383 384 385 386 387 388 389 390 391 392
Source:Information collected, calculated and compiled by James Curtis Jr (2002); IPUMS
393
394
This was greater than the 18 percent of illiterate free blacks in 1850 and 23 percent of illiterate free blacks in 1860 that
395
possessed positive amounts of real estate wealth. Table 8c shows that the ratio of literate free black real estate holders (per
396
hundred literate free blacks) to the number of illiterate free black real estate holders (per hundred illiterate free blacks) remained
397
constant at 1.1 in 1850 and 1860.
398
399
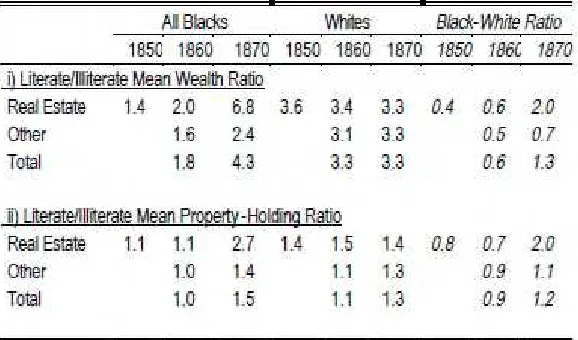
By 1870, the return to literacy among blacks grew dramatically. Table 8c-2 shows that the ratio of literate to illiterate average
400
real estate wealth for all blacks—which includes ex-slaves who held little or no real estate property—grew to 6.8.
401
Table 8c-2. Mid 19thCentury Comparative Wealth Ratios and Comparative Property Ownership Ratios of
404
Whites and Blacks, Based on Schooling
405 406 407 408 409 410 411 412 413 414 415 416 417 418
Source:Information collected, calculated and compiled by James Curtis Jr (2002); IPUMS
419
420
This implies that, on average, literate ex-slaves possessed seven dollars for every dollar of real estate wealth owned by an illiterate
421
ex-slave. Yet the relative sample sizes suggest that approximately one in seven (2761/18936) blacks were able to take
422
advantage of the large literacy premium in 1870. Slave owner discouragement of educating slaves caused illiterate ex-slaves to be
423
severely handicapped in the wealth accumulation process.
424
425
Similarly, Table 8c-2 shows that the ratio of literate black real estate holders (per hundred literate blacks) to illiterate blacks real
426
estate property holders (per hundred illiterate blacks) was 2.7—for every illiterate black real estate holder (per hundred illiterate
427
blacks), there were three literate black real estate holders (per hundred literate blacks).
428
429
The Mid 19thCentury Schooling and Real Estate: A Comparison of White and Black Americans over Time
431
432
When comparing average real estate wealth of free blacks to the average real estate wealth of whites by literacy before
433
emancipation, illiterate white wealth was closer to illiterate free black wealth than literate black wealth to literate white wealth. Using
434
wealth means in Table 8a-2, literate free blacks had 12.8 percent (133/1042) of the average real estate wealth among literate
435
whites in 1850 and grew to 19.8 percent (316/1597) of the average real estate wealth among literate whites in 1860. But
436
illiterate free blacks had 33.0 percent (93/282) of the average real estate wealth among illiterate whites in 1850 and 1860
437
(151/458). The penalty for illiteracy in the nineteenth century caused illiterate whites and blacks to have a relatively closer
438
economic experience than literates. This is quite similar to a skill-biased economy that rewards college education and penalizes high
439
school drop-outs discussed in the 1980’s by Juhn, Murphy and Pierce (1991) but with a caveat: the nineteenth century skill bias
440
was racially asymmetrical in favor of whites.
441
442
The relatively closer economic experience of free black and white illiterates was observed when analyzing the proportion of free
443
black real estate holders relative to white real estate holders. The ratio of literate free black real estate holders (per hundred literate
444
free blacks) to literate white real estate holders (per hundred literate whites) was approximately 1:3 (0.20 : 0.54) in 1850 and
445
2:5 (0.25 : 0.57) in 1860. Among illiterates, the ratio rose to approximately 1:2 (0.18 : 0.38) in 1850 and 6:10 (0.23 :
446
0.39) in 1860.
447
448
By 1870, the ratio of black to white average real estate wealth and property holders fell significantly with the inclusion of
ex-449
slaves in the sample but a distinct literacy advantage emerged. Using wealth means from Table 8a-2, 1870 literate blacks held
450
10.5 percent (206/1953) of the real estate wealth of literate whites while illiterate blacks held 5.3 percent (31/586) of the
451
real estate wealth of illiterate whites. Similarly, using the percentage of property holders in Table 8b-2, the ratio of literate black
approximately 1:4 (0.15 : 0.56). Among illiterates, the ratio was approximately 1:8 (0.05 : 0.41) in 1870. A relative racially
454
symmetrical literacy advantage was after emancipation even though literate blacks still possessed real estate wealth that was
455
significantly below literate whites.
456
457
Using thecomparative wealth ratiofor real estate wealth, we can ignore the absolute differences in black and white real estate
458
wealth and ascertain the literacy advantages in the presence of wealth constraints. Since the ratio in Table 8c was less than one in
459
1850 (0.4) and 1860 (0.6), whites obtained higher return to literacy than free blacks. In 1870, the ratio in Table 8c-2 grew
460
to 2.0 which implies that blacks receive a higher return literacy in the presence wealth constraints than whites. This may suggest
461
that (i) higher skilled occupations that pay higher wages and (ii) higher yield investment opportunities that are normally available to
462
more educated individuals were not made available to blacks until their rights were more fully enforced, such as those provided by
463
federal government after 1865.
464
465
Similar results were obtained using thecomparative property ownership ratiofor real estate property in Table 8c-2. Since the
466
statistic was below one in 1850 (0.8) and 1860 (0.7), whites obtained higher return to literacy than free blacks. The statistic
467
grew to 2.0 in 1870, again, suggesting a dramatic growth in the literacy premium for blacks once individual rights were protected
468
under the force of law.
469
470
The Mid 19thCentury Schooling and Other Wealth of Blacks: A Comparison of Black Americans over Time
472
473
Literate blacks also had nominal advantages but relative disadvantages in terms of other measures of wealth before and after
474
emancipation. Table 8a-2 shows that literate free blacks possessed $204 in nominal other wealth in 1860 prior to
475
emancipation. This was higher than the $121 possessed by illiterate free blacks. Thus, free blacks in free states possessed 160
476
percent of other forms of wealth owned by illiterate free blacks. However, literate free blacks were approximately equally as likely as
477
illiterate free blacks to hold other forms of property. Table 8b-2 shows that 54 percent of literate free blacks that possessed
478
positive amounts of other wealth in 1860. This was only slightly lower than the 56 percent of illiterate free blacks that possessed
479
positive amounts of other wealth in 1860.
480
481
The combinations of these results suggests illiterate free blacks per hundred are equally as likely to hold other forms property but
482
the literate free blacks use their enhanced knowledge to grow the value of their property larger than the value of illiterate property.
483
By 1870, the return to literacy grew dramatically. Table 8c-2 shows that the ratio of literate to illiterate other forms of wealth for
484
all blacks—which includes ex-slaves who held little or no real estate property—grew to 2.4. This implies that literate ex-slaves
485
possessed two dollars for every dollar of wealth owned by an illiterate ex-slave. Similarly, Table 8c shows that the ratio of literate
486
black property holders (per hundred literate blacks) to illiterate property holders (per hundred illiterate blacks) was 1.4.
487
488
The Mid 19thCentury Schooling and Real Estate: A Comparison of White and Black Americans over Time
489
490
The closer economic experiences of illiterate blacks and whites persisted when comparing other wealth of blacks to the other wealth
491
of whites before and after emancipation. Using wealth means in Table 8a-2, literate blacks had 20.0 percent (204/1019) of
492
literate white other wealth in 1860 and 12.5 percent (98/785) of literate white wealth in 1870. However, illiterate free blacks
had 37.3 percent (121/324) of illiterate white wealth in 1860 and 17.6 percent (41/236) of illiterate white wealth in
494
1870.
495
496
These results confirm a penalty for illiteracy was so severe that the other forms of wealth of illiterate whites was relatively closer to
497
wealth of illiterate blacks than blacks and whites who could read and write. This may also explain the closer experience of illiterate
498
property holders when analyzing the proportion of blacks holding other forms of property relative to whites holding other forms of
499
property. The ratio of literate blacks (per hundred literate blacks) to literate whites (per hundred literate whites) with other forms of
500
property was approximately 2:3 (0.54 : 0.81) in 1860 and 1:3 (0.28 : 0.72) and 1870. Among illiterates the ratio rose to
501
approximately 3:4 (0.56 : 0.75) in 1860 and 1:3 (0.20 : 0.55) in 1870.
502
503
Using thecomparative wealth ratiofor other forms of wealth, we can ignore the absolute differences in black and white wealth and
504
ascertain the literacy advantages in the presence of wealth constraints. Since the ratio in Table 8c-2 was less than one in 1860
505
(0.5) and 1870 (0.7), whites obtained higher returns to literacy than blacks. Similar results were obtained using thecomparative
506
property ownership ratiofor other forms of property. Since the ratio reported in Table 8c-2 was less than one in 1860 (0.9)
507
and approximately equal to one in 1870 (1.1), whites obtained higher or equal returns to literacy than blacks before and after
508
emancipation.
509
510
The Mid 19thCentury Schooling and Total Wealth of Blacks: A Comparison of Black Americans over Time
512
513
When summing up real estate and other forms of wealth, empirical results show that literate blacks were better off before and after
514
emancipation. Table 8a-2 shows that literate free blacks possessed $520 in nominal total wealth in 1860 prior to emancipation.
515
This was higher than the $273 possessed by illiterate free blacks. However, literate free blacks were equally likely as illiterate free
516
blacks to hold real estate or other forms of property. Table 8b-2 shows that 58 percent of literate free blacks that possessed
517
positive amounts of total wealth in 1860. This was only slightly lower than the 60 percent of illiterate free blacks that possessed
518
positive amounts of total wealth in 1860. The combination of these results suggests illiterate free blacks are about equally as likely
519
to hold property but the literate free blacks use their knowledge to grow the value of their property larger than illiterate property.
520
By 1870, the return to literacy grew dramatically. Table 8c-2 shows that the ratio of literate to illiterate real estate wealth for all
521
blacks—which includes ex-slaves who held little or no real estate property—grew to 4.3. This implies that literate ex-slaves
522
possessed four dollars for every dollar of total wealth owned by an illiterate ex-slave. Similarly, Table 8c-2 shows that the ratio of
523
literate black total property holders (per hundred literate blacks) to illiterate black total property holders (per hundred illiterate
524
blacks) was 1.5—for every literate free black real estate holder, there were two illiterate free black real estate holders.
525
526
The Mid 19thCentury Schooling and Total Wealth: A Comparison of White and Black Americans over Time
527
528
The closer economic experiences of illiterate blacks and whites persisted even when comparing total wealth of blacks to the total
529
wealth of whites before, but reversed after emancipation. Using wealth means in Table 8a-2, literate blacks had 19.9 percent
530
(520/2616) of literate white total wealth while illiterate free blacks had 34.9 percent (273/782) of illiterate white wealth in
531
1860. By 1870, things had reversed such that literate free blacks had 11.1 percent (304/2737) of literate white wealth while
532
illiterate free blacks had 8.7 percent (72/832) of illiterate white wealth. These results may imply that the penalty for illiteracy was
so severe that the wealth of illiterate whites was relatively closer to wealth of illiterate blacks than blacks and whites who could read
534
and write before emancipation, but legal enforcement of rights improved the returns to literacy after emancipation.
535
536
Similarly, this illiteracy penalty was observed when analyzing the proportion of blacks holding property relative to whites. The ratio
537
of literate blacks (per hundred literate blacks) to literate whites (per hundred literate whites) with property was approximately 2:3
538
(0.58 : 0.84) the ratio rose to approximately 3:4 (0.60 : 0.77) among illiterates in 1860. By 1870, the literate ratio of 2:5
539
(0.32 : 0.77) exceeded the illiterate ratio of 1:3 (0.22 : 0.62) in 1870.
540
541
Using thecomparative wealth ratiofor other forms of wealth, we can ignore the absolute differences in black and white wealth and
542
ascertain the literacy advantages in the presence of wealth constraints. Since the ratio in Table 8c-2 was less than one in 1860
543
(0.6) and 1870 (1.3), whites obtained higher returns to literacy than free blacks before emancipation and literate ex-slave
544
obtained a higher return to literacy than ex-slaves. Again, the penalty for illiteracy was so severe that the wealth of illiterate whites
545
was relatively closer to wealth of illiterate blacks than blacks and whites who could read and write before emancipation, but legal
546
enforcement rights improved the returns to literacy after emancipation. Similar results were obtained using thecomparative property
547
ownership ratiofor other forms of property. Since the ratio reported in Table 8c-2 was less than one in 1860 (0.9) and greater
548
than one in 1870 (1.2), whites obtained higher returns to literacy than blacks before emancipation and reversed after
549
emancipation.
550
551
Once the equal enforcement of laws began to converge more rapidly, with the mass emancipation of Southern slaves, some blacks,
552
with schooling advantages, observed returns to schooling, in the black community, that were greater than the returns to schooling of
553
whites, with schooling advantages in the white community. This schooling premium advantage observed after the emancipation of
554
slaves was, in part, due to combining blacks with longer histories of emancipation, and with maximum free market experiences, and
555
the plurality of blacks with shorter histories of emancipation, and with minimum free market experiences. This uncompensated
change in social standing may be preliminary evidence of the sources of greater inequality and skewed media documentations of
557
social unrest observed among disenfranchised groups throughout history.
558
559
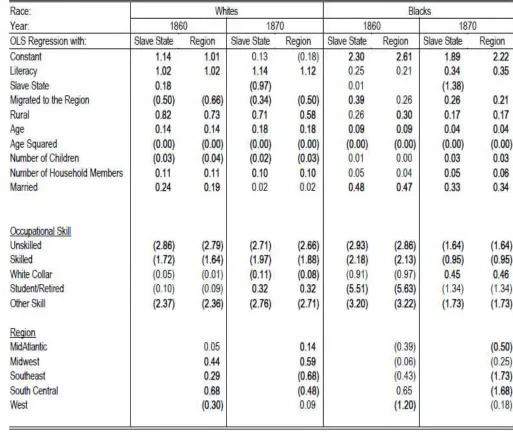
Non-Linear Least Squares Multivariate Analysis of Logarithmic Total Wealth of Whites and Blacks in 1860 and 1870
560
561
Table 13 shows logarithmic wealth is regressed against proxy variables for earnings and savings, proxy variables for initial wealth, and
562
household formation variables. Results, which had a 95 percent level of significance, are summarized below.
563
564
Savings and Schooling.Savings. Results show higher, statistically significant, diminishing increases in wealth savings with age among
565
whites, compared to blacks, in 1860 and 1870.Schooling. Similarly, results show higher returns to schooling, for whites relative
566
to blacks, in 1860 and 1870, holding all other variables constant; however, these results were not statistically significant for free
567
blacks in 1860.
568
569
571
Table 13. OLS Estimates Based on Log Real Total Wealth by Race, 1860-70
572
573 574 575 576 577 578 579 580 581 582 583 584 585 586 587 588 589 590 591 592 593 594 595 596 597 598 599 600 601 602 603
Source:Information collected, calculated and compiled by James Curtis Jr (2002); IPUMS; Dependent variable is natural log of
604
total wealth adjusted for regional prices; Estimated parameters in bold are statistically significant with a 95 percent level of
605
confidence. Farmers and Northeast are the excluded variables.
REFERENCES
608
Attack, Jeremy and Fred Bateman, "Egalitarianism, Inequality, and Age: The Rural North in 1860," Journal of Economic History,
609
Vol. 41, March 1981, pp.85-93.
610
Becker, Gary S. The Economics of Discrimination, Chicago: Chicago, 1957.
611
Berlin, Ira, Slaves Without Masters: The Free Negro in the Antebellum South, New York: Pantheon, 1974.
612
Birkes, David and Yadolah Dodge, Alternative Methods of Regression, New York: John Wiley, 1993.
613
Bodenhorn, Howard, "The Economic Consequences of Color Among Free Negroes in Rural Antebellum South," working paper,
614
Lafayette College, July 1999.
615
Bodenhorn, Howard, "The Mulatto Advantage: The Biological Consequences of Complexion in Rural Antebellum Virginia," working
616
paper, Lafayette College, June 1999.
617
Buchinsky, Moshe, “Recent Advances in Quantile Regression Models: A Practical Guide for Empirical Research,” Journal of Human
618
Resources, Vol. 33, No. 1, 1998.
619
Coelho, Philip R. and James F. Shepherd, "Differences in Regional Prices: The United States, 1851-1880," Journal of Economic
620
History, Vol. 34, Iss. 3, September 1974, pp.551-591.
621
Conley, Dalton, Being Black, Living in the Red: Race Wealth, and Social Policy in America, Berkeley: University of California, 1999.
622
Conley, Timothy and David Galenson, "Quantile Regression Analysis of Censored Wealth Data," Historical Methods, Vol. 27, No. 4, pp. 149-165.
623
Conley, Timothy G., David Galenson and Steven Herscovici, "Economic Opportunity in Urban America: Region, Nativity and Wealth in the
624
Mid-Nineteenth Century," working paper, November 1995.
625
Cramer, Clayton E. Black Demographic Data, 1790-1860: A Sourcebook, Westport: Greenwood, 1997.
626
Curry, Leonard, The Free Black in Urban America, 1800-1850: The Shadow of the Dream, Chicago: Chicago University Press, 1981.
627
Curtis Jr, James Edward, “A Theory of Wealth Accumulation Considering Modern Net Savings Gradualism
628
The Impact of Unresolved Long Run Differences in Wealth Accumulation on the Annualized Net Savings in the USA”
629
Working Paper Number 3018488, (Available at SSRN: http://ssrn.com/ abstract=3018488), February 26, 2017.
630
Curtis Jr, James Edward, “Designing JECJEF University”, Working Paper, July 31, 2017.
631
Curtis Jr, James Edward, “Economics, A Student Textbook and Professor Manual for University Instruction of
632
Microeconomics courses, 3rd Edition”, Working Paper, July 31, 2017.
633
Curtis Jr, James Edward, “Freedom Laws and Economics of Ethnicity” Working Paper Number 1701423
634
(Available at SSRN: http://ssrn.com/ abstract=1701423), January 23, 2012.
635
Curtis Jr, James Edward, “Long-Run Differences in Wealth: A Microdata Analysis of US White-Black Differences in Wealth
636
Directly after Mass Emancipation of Southern Slaves”, Working Paper Number 1701373
637
(Available at SSRN: http://ssrn.com/abstract=1701373), December 1, 2002.
638
Curtis Jr, James Edward, “The Enduring Faith Center, A Chronological Memior Of A Church Formed By James Edward Curtis Jr”
639
Working Paper, December 31, 2013.
640
Curtis Jr, James Edward, “Wealth and Faith, What Is Your Real Reason? Is It Jesus?” SSRN Working Paper Number 1793848
641
(Available at SSRN: http://ssrn.com/abstract=1793848), March 11, 2011.
642
Curtis Jr, James Edward, “Wealth Discrimination Theory”, Working Paper Number 1751670
Decanio, Stephen J., "Accumulation and Discrimination in the Post-Bellum South," Exploration in Economic History, Vol. 16, No. 2,
645
April 1979, pp. 182-206.
646
DuBois, W.E.B. The Philadelphia Negro: A Social Study, New York: Schocken, 1899.
647
Easterlin, Richard A. "Regional Income Trends, 1840-1950," American Economic History, New York: McGraw-Hill, 1961, pp.525-547.
648
Easterlin, Richard A. Population, Labor Force, and Long Swings in Economic Growth: The American Experience, New York: NBER, 1968.
649
Eblen, Jack E. "Growth of the Black Population in Ante Bellum America, 1820-1860," Population Studies, Vol. 26, No. 2, July 1972,
650
pp.273-289.
651
Eggert, Gerald, "Two-Steps Forward, a Step and a Half Back: Harrisburg's African American Community in the Nineteenth Century,"
652
in African Americans in Pennsylvania: Shifting Historical Perspectives edited by Joe Trooter Jr., Pennsylvania: Pennsylvania
653
State University, pp.220-253.
654
Ferrie, Joseph P. "The Wealth Accumulation of Antebellum European Immigrants to the U.S., 1840-60," Journal of Economic History,
655
Vol. 54, March 1994, No. 1, pp.1-33.
656
Ferrie, Joseph P. “A New Sample of Males Linked from the Public Use Microdata Sample of the 1850 U.S. Federal Census of Population to
657
the U.S. Federal Census Manuscript Schedules,” Historical Methods, Vol. 29, No. 4, Fall 1996, pp. 141- 156.
658
Ferrie, Joseph P. Yankeys Now: Immigrants in the Antebellum United States, 1840-1860, New York: Oxford, 1999.
659
Franklin, John H. The Free Negro in North Carolina, 1790-1860, New York: Russell, 1943.
660
Galenson, David W. "Economic Opportunity on the Urban Frontier: Nativity, Work and Wealth in Early Chicago,"
661
Journal of Economic History, Vol. 51, September 1991, pp.581-603.
662
Galenson, David W. and Clayne L. Pope, "Economic and Geographic Mobility on the Farming Frontier: Evidence from
663
Appanoose County, Iowa, 1850-1870," Journal of Economic History, Vol. 49, September 1989, pp. 635-655.
664
Greaves, Ida C. The Negro in Canada, Montreal: Packet-Times Press.
665
Greene, Lorenzo J. And Carter G. Woodson, The Negro Wage Earner, Washington: Association for the Study, 1930.
666
Greene, William, Econometric Analysis, New Jersey: Princeton Hall, 1997.
667
Hamburg, Morris, Statistical Analysis for Decision Making, San Diego: Harcourt Brace Jovanvich, 1989.
668
Herscovici, Steven, "Migration and Economic Mobility: Wealth Accumulation and Occupational Change Among
669
Antebellum Migrants and Non-Migrants," working paper, October 1995.
670
Higgs, Robert, "Accumulation of Property by Southern Blacks Before World War I," American Economic Review, Vol. 72, Iss. 2,
671
September 1982, pp.725-737.
672
Hornsby, Anne, "The Accumulation of Wealth by Black Georgians, 1890-1915," Journal of Negro History, Vol.74, Iss. 1,
673
Winter 1989, pp. 11-30.
674
Hurst, Erik, et. al, "The Wealth Dynamics of American Families, 1884-94," Brookings Papers on Economic Activity, Iss. 1, 1998,
675
pp. 267-337.
676
Jackson, Luther Porter, "The Virginia Free Negro Farmer and Property Owner," Journal of Negro History, Vol. 24, Iss. 4, October 1939,
677
pp. 390-439.
678
Juhn, Chinhoi, Kevin M. Murphy, and Brooks Pierce, “Accounting for the Slowdown in Black-White Wage Convergence,” in
679
Marvin H. Kosters (ed.), Workers and Their Wages, DC: American Enterprise Institute, 1991.
680
Koenker, Roger and Gilbert Basset, Jr. “Regression Quantiles,” Econometrica, Vol. 46, No. 1, January 1978, pp. 33-50.
Landon, Fred, "The Negro Migration to Canada after Passing the Fugitive Slave Act," Journal of Negro History, Vol. 5, Iss. 1,
682
January 1920, pp. 22-36.
683
Litwick, Leon F. "The Federal Government and the Free Negro, 1790-1860," Journal of Negro History, Vol. 43, Iss. 4,
684
October 1958, pp. 261-278.
685
Litwick, Leon F. North of Slavery: The Negor in the Free State, 1790-1860, Chicago: University of Chicago, 1961.
686
Magnuson, Diana L. “The Making of a Modern Census: The United States Census of Population, 1790-1940, ”
687
University of Minnesota (Doctoral Dissertation), 1995.
688
Magnuson, Diana L. “Who and What Determined the Content of the U.S. Population Schedule Over Time,” Historical Methods,
689
Vol. 28, No. 1, pp. 11-26.
690
Magnuson, Diana L. and Miriam L. King, “Comparability of the Public Use of Microdata Samples: Enumeration Procedures,”
691
Historical Methods, Vol. 28, No. 1, Winter 1995, pp. 27-32.
692
Margo, Robert, "Accumulation of Property by Southern Blacks Before World War I: Comment and Further Evidence," American
693
Economic Review," Vol. 74, Iss. 4, September 1984, pp. 768-774.
694
Margo, Robert, Race and Schooling in the South: 1880-1915, An Economic History, Chicago: University of Chicago Press, 1990.
695
McKee, Jay William, “The Conflict Between State Laws Prohibiting the Entrance of Free Negroes and the Privleges and Immunities
696
Clause of the Federal Constitution in the Period, 1789-1860,” The Ohio State University (Doctoral Dissertation),
697
1934.
698
McPherson, J.H.T. History of Liberia, Baltimore: John Hopkins University Press, 1891.
699
Mechlinger, Louis R. "The Attitude of the Free Negro Toward Colonization," Journal of Negro History, Vol. 1, Iss. 3, June 1916,
700
pp. 276-301.
701
Miller, Kelly, "Enumeration Errors in the Negro Population," Scientific Monthly, Vol. 14, January-June 1922, pp.168-177.
702
Mincer, Jacob, "Investments in Human Capital and Personal Income Distribution," Journal of Political Economy, Vol. 66, August
703
1958, pp.281-302.
704
Mincer, Jacob, Schooling, Experience, and Earnings. New York: Columbia University, 1974.
705
Pennsylvania Abolition Society, The Present State and Condition of the People of Color of the City of Philadelphia and Adjoining Districts,
706
Philadelphia, 1838.
707
Pope, Clayne L. "Households on the American Frontier: The Distribution of Income and Wealth in Utah, 1850-1900,"
708
Markets in History: Economic Studies of the Past, edited by David W. Galenson, Cambridge: Cambridge, 1989.
709
Provine, Dorothy, "The Economic Position of the Free Clacks in the District of Columbia, 1800-1860,"
710
Journal of Negro History, Vol. 58, Iss. 1, January 1973, pp.61-1972.
711
Ruggles Steven and Matthew Sobek , “Integrated Public Use Microdata Series: Version 2.0,” Minneapolis: Historical Census Projects,
712
University of Minnesota, 1997.
713
Ruggles, Steven and Russell R. Menard, “The Minnesota Historical Census Projects,” Historical Methods, Vol. 28, No. 1, Winter 1995,
714
pp. 6-10.
715
Ruggles, Steven, et. al., "General Design of the Integrated Public Use Microdata Series," Historical Methods, Vol. 28, No. 1, Winter 1995,
716
pp. 31-39.
717
Schaefer, Donald F. "A Model of Migration and Wealth Accumulation: Farmers at the Antebellum Southern Frontier,"
Shorrocks, A.F. “The Measurement of Mobility,” Econometrica, Vol. 46, No. 5, Sept. 1978, pp. 1013-24.
720
Snyder, Donald C. "A Database with Income and Assets of New Retirees by Race and Hispanic Origin," Review of Black Political Economy,
721
Vol. 71, No. 4, Spring 1989, pp.5-25.
722
Society of Friends, Statistical Inquiry into the Condition of the Free People of the City and Districts of Philadelphia, Philadelphia, 1849.
723
Soltow, Lee, "A Century of Personal Wealth Accumulation," in The Economics of Black America edited by Harold G. Vatter and
724
Thomas Palm, New York: Harcourt Brace Jovanovich, 1972, pp. 80-84.
725
Soltow, Lee. Men & Wealth in the United States. New Haven: Yale, 1975.
726
Spriggs, William Edward, “Afro-American Wealth Accumulation, Virginia, 1900-1914,” University of Wisconsin at Madison
727
(Ph.D. Dissertation), 1984.
728
Steckel, Richard H. “Census Matching and Migration: A Research Strategy,” Historical Methods, Vol. 21, No. 2, Spring 1988,
729
pp. 52-60.
730
Steckel, Richard H. “Poverty and Prosperity: A Longitudinal Study of Wealth Accumulation, 1850-1860,” The Review of
731
Economics and Statistics, 1990, pp. 275-285.
732
Steckel, Richard H. “Stature and Standards of Living,” Journal of Economic Literature, Vol. 33, 1995, pp.1903-1940.
733
Steckel, Richard H. “The Quality of Census Data for Historical Inquiry: A Research Agenda,” Social Science History, Winter 1991,
734
pp.579-599.
735
Steckel, Richard H. and Carolyn Moehling, “Wealth Inequality in Industrializing New England: New Evidence and Tests of
736
Competing Hypothesis,” submitted to the Journal of Economic History, January 2000.
737
Steckel, Richard, "Census Manuscript Schedules Matched with Property Tax Lists: A Source of Information on Long-term Trends
738
in Wealth Inequality," Historical Methods, Vol. 27, No. 2, Spring 1994, pp. 71-85.
739
Steckel, Richard, "Household Migration and Rural Settlement in the United States, 1850-1860,” Explorations in Economic History,
740
pp. 190-218.
741
Steckel, Richard, "The African American Population of the United States, 1790-1920" in A Population History of North America,
742
January 2000.
743
The Christian Life: New Testament, Master Outlines and Study Notes, New King James Version, Nashville: Thomas Nelson, 1982
744
The Holy Bible, Contemporary English Version, New York: American Bible Society, 1995
745
The Holy Bible, King James Version, Colorado Springs: International Society, 1988
746
The Holy Bible, King James Version, London, Cambridge University
747
The Holy Bible, King James Version, Philadelphia: AJ Holman, 1942
748
The Holy Bible, New International Version, Colorado Springs: International Bible Society, 1984 (Hard Cover)
749
The Holy Bible, New International Version, Colorado Springs: International Bible Society, 1984 (Soft Cover)
750
The Holy Bible, New King James Version, Thomas Nelson, 1982
751
The Holy Bible (The Everywhere Bible), New International Version, Grand Rapids: Zondervan, 2006
752
The NKJV Study Bible, New King James Version, Nashville: Thomas Nelson, 1997
753
The Student Bible, New International Version, Grand Rapids: Zondervan, 1986
Thünen, Johann Heinrich von, Isolated State; an English edition of Der isolierte Staat. Translated by Carla M. Wartenberg.
755
Edited with an introduction by Peter Hall, Oxford, New York, Pergamon Press, 1966.
756
US Bureau of the Census, Negro Population, 1790-1915, Washington: Government Printing Office, 1918.
757
US Census Office, The Eighth Census of the United States: 1860, Washington: Government Printing Office, 1864.
758
US Census Office, The Seventh Census of the United States: 1850, Washington: Robert Armstrong, 1853.
759
Weiss, Thomas, “U.S. Labor Force Estimates and Economic Growth, 1800-1860,” in American Economic Growth and
760
Standards of Living Before the Civil War edited by Robert E. Gallman and John Wallis, Chicago: University of Chicago, 1992,
761
pp. 19-78.
762
Wikimedia Foundation, Wikipedia: The Free Encyclopedia, Encyclopedia on-line, July 2004.
763
White, Betsey Buttrill, "Empirical Tests of the Life Cycle Hypothesis," American Economic Review, Vol. 68, Iss. 4, September
764
1978, pp. 547-560.
765
Wilkie, Jane R. "Distribution of the US Population by Race and Urban-Rural Residence, 1790-1860: Reference Tables,"
766
Demography, Vol. 13, No. 3, August 1976, pp.139-148.
767
Wilkie, Jane R. "Urbanization and De-urbanization of the Black Population Before the Civil War," Demography, Vol. 13, No. 3,
768
August, 1976, pp.311-328.
769
Wolff, Edward N. "Life-Cycle: A Microdata Analysis,” Income and Wealth, Vol. 27, No.1, March 1981, pp. 75-91.
770
Wolff, Edward, "Changing Inequality of Wealth," American Economic Review: Papers and Proceedings of the One Hundred and
771
Fourth Annual Meeting of the American Economic Association, Vol. 82, Iss. 2, May 1992, pp. 552-558.
772
Wolff, Edward, "Recent Trends in the Size Distribution of Household Wealth," Journal of Economic Perspectives, Vol. 12, No. 3,
773
Summer 1998, pp. 131-150.
774
Woodson, Carter G. Free Negro Heads of Families in the Unites in 1830, Washington: Association for the
775
Study of Negro Life and History, 1925.
776
Woodson, Carter G. Free Negro Owners of Slaves in the United States in 1830, New York: Negro Universities, 1924.
777
Woodson, Carter G. The Education of the Negro Prior to 1861, New York: Arno, 1968.
778
Woolfolk, George R. The Free Negro in Texas 1800-1860: A Study of Cultural Compromise, Michigan: University Microfilms
779
International, 1976.
780
Wright, Carroll D. The History and Growth of the United States Census, Washington: Government Printing Office, 1900.
781
Zelinsky, Wilbur, "The Historical Geography of the Negro Population of Latin America," Journal of Negro History, Vol. 34, Iss. 2,
782
April 1949, pp.153-221.
783
Zelinsky, Wilbur, "The Population Geography of the Free Negro in Antebellum America," Population Studies, Vol. 3, Iss. 4, March 1950,
784
pp.386-401.
THE APPENDIX
787
788
Several anecdotal studies on free blacks in the labor market show that the poor legal and social conditions made it difficult for free
789
blacks to be economically competitive. For instance, free blacks had to compete with slaves, whites and immigrants for employment.
790
“The preference of employers for white or slave labor forced free Negroes to underbid whites and work on the same
791
terms as slaves. By accepting lower wages and longer hours, many free Negroes found employment, but they aroused the
792
ire of white workingmen, who complained that free Negroes depressed their standard of living” (Berlin, p.229).
793
Immigration put free Negroes in the same position: “The influx of Irish and German workers…speeded the exclusion of
794
Negro freeman from many occupations. The competition free Negro workers faced from newly arrived immigrants in
795
Baltimore was a typical example of how white immigrants limited the free Negro’s opportunities” (p.231).
796 797
They tended to earn wages and income that were much less than whites. One local study shows that: “Racial prejudice relegated
798
many free Negro workers to the meanest drudgery at the lowest pay…Even at these low levels of employment, free Negroes were
799
often paid less than whites. The standard wage for day laborers in the Norfolk shipyards (for example) was one dollar, but free
800
Negro workers rarely earned more than seventy-five cents a day” (Berlin, p.227).
801
802
But studying racial differences in factor market supply decisions and prices, as reflected in the literature on labor supply, wages and
803
income, presents only a subset of the factors that determine the accumulation and storage of assets over the lifetime of black and
804
white households. Therefore, this study will focus on differences in wealth between blacks and whites in the middle of the 19th
805
Century.
806
807
Related Studies: A Review of the Literature on the Study of Free Blacks
809
810
The source of antebellum free black-white wealth differences has not studied. Researchers (e.g., Bodenhorn (1999), Eggert
811
(1997), Hershberg (1997), Berlin (1974), Litwick (1961), Jackson (1939), and DuBois (1899)) and Philadelphia
812
abolitionist society studies in 1849 and 1838 attempted to address free black-white wealth differences often using a piece-mill
813
approach. Foremost, Leon Litwick (1961) and Ira Berlin (1979) provided a historical account for experience of northern and
814
southern free blacks, respectively. After surveying past research efforts, compiling county records and compiling census manuscripts,
815
Berlin found that free blacks in several states possessed more property over time. But these results are obscured by the aggregate
816
measures of wealth. For instance, he found that the aggregate wealth of free blacks living in fifteen counties in Georgia nearly
817
doubled between 1850 and 1860. But we do not know why their wealth increased because correlations with explanatory
818
variables were not calculated.
819
820
Luther Jackson (1939) also analyzed the property and real estate wealth of free blacks in the South. He used tax books, deeds,
821
orders, legislative petitions, agricultural manuscripts and census manuscripts from Virginia to show that the amount of property held
822
by free blacks in 1830 tripled by 1860. Even though Jackson provided a brief statistical analysis, the inference of his study is
823
limited to Virginia and he did not employ methods to explain what drove his observations.
824
825
Bodenhorn (1999a) used 1860 US census data to analyze southern wealth differences among darker and lighter free blacks.
826
Based on censored quantile regression results using data from Maryland, Virginia, North Carolina, Kentucky and Louisiana, mulattos
827
had wealth advantage to darker free blacks. Similarly, Bodenhorn (1999b) employs data stature of darker and lighter free blacks.
828
He also found that mulattos had an advantage to darker free blacks when analyzing stature data from Virginia. While Bodenhorn did
829
employed modern statistical analyses, inference from this study is limited to several states.
Some research has also been conducted on free black wealth in localities within Pennsylvania. Gerald Eggert (1997) linked US Census
832
records of blacks in Harrisburg, Pennsylvania from 1850-60 to estimate property values of free blacks. He found stagnant wealth
833
among a large percentage of the population but growth among those who did not migrate. However, his study did not compare results
834
to migrants and was limited to one locality. Theodore Hershberg (1997) employed abolition society data on the socioeconomic
835
conditions of free blacks in Philadelphia to show that real and personal wealth fell ten percent between 1838 and 1847.
836
837
Similarly, W. E. B. Dubois (1899) used these records and tax receipts to show that free blacks in Philadelphia often held less
838
property than whites. However, Hershberg and Dubois do not use the analytical tools needed to fully explain their results. Their
839
studies lack a full description of the data collection procedures in their research. To analyze the link between these social conditions
840
and economic outcomes of free blacks, I employ wealth and cross-sectional variables from the 1850, 1860 and 1870
841
Integrated Public Use Microdata Samples (IPUMS).