http://www.scirp.org/journal/cn ISSN Online: 1947-3826
ISSN Print: 1949-2421
DOI: 10.4236/cn.2017.94017 Nov. 15, 2017 235 Communications and Network
Design and Simulation of a Topology
Aggregation Algorithm in Multi-Domain Optical
Networks
Lei Wang, Li Lin, Li Du
*Computer Science and Engineering, Northeastern University, Shenyang, China
Abstract
The aggregate conversion from the complex physical network topology to the simple virtual topology reduces not only load overhead, but also the parame-ter distortion of links and nodes during the aggregation process, thereby in-creasing the accuracy of routing. To this end, focusing on topology aggrega-tion of multi-domain optical networks, a new topology aggregaaggrega-tion algorithm (ML-S) was proposed. ML-S upgrades linear segment fitting algorithms to multiline fitting algorithms on stair generation. It finds mutation points of stair to increase the number of fitting line segments and makes use of less re-dundancy, thus obtaining a significant improvement in the description of to-pology information. In addition, ML-S integrates stair fitting algorithm and effectively alleviates the contradiction between the complexity and accuracy of topology information. It dynamically chooses an algorithm that is more accu-rate and less redundant according to the specific topology information of each domain. The simulation results show that, under different topological condi-tions, ML-S maintains a low level of underestimation distortion, overestima-tion distoroverestima-tion, and redundancy, achieving an improved balance between ag-gregation degree and accuracy.
Keywords
Topology Aggregation, Multiline Fitting, Stair Fitting, Mutation Point, Distortion
1. Introduction
The scale of optical networks is rapidly expanding with the development of in-ternet technology. It will be difficult to manage the increasing burden and over-How to cite this paper: Wang, L., Lin, L.
and Du, L. (2017) Design and Simulation of a Topology Aggregation Algorithm in Multi-Domain Optical Networks. Commu-nications and Network, 9, 235-248.
https://doi.org/10.4236/cn.2017.94017
Received: September 11, 2017 Accepted: November 12, 2017 Published: November 15, 2017
Copyright © 2017 by authors and Scientific Research Publishing Inc. This work is licensed under the Creative Commons Attribution International License (CC BY 4.0).
http://creativecommons.org/licenses/by/4.0/
DOI: 10.4236/cn.2017.94017 236 Communications and Network
head of networks if all the nodes are located at one domain [1]. Large-scale works are generally made up of different operators’ networks. Considering net-work management and security, the internal topology information of netnet-works is usually invisible [2]. A network system is often divided into different domains, providing a tendency of multi-domain optical network for optical transmission
[3].
An important motivation of this study is to provide a better scalability for the rapid expansion of current internet users. Topology aggregation is one of the impetuses to solve the problems in scalability and security of large-scale mul-ti-domain optical networks [4]. The basic principle is to aggregate topology in-formation of single domain and to inform other domains, effectively hiding con-fidential information while reducing the information exchanged among domains
[5]. The aggregated virtual topology is a concise description of nodes and links of the physical topology. At present, typical aggregation models include: virtual node aggregation, total topology aggregation, full mesh aggregation, star aggre-gation, spanning tree aggreaggre-gation, hybrid aggreaggre-gation, etc. [6]. The existing to-pology aggregation algorithms mainly include: single point substitution algo-rithm (SP), stretching factor algoalgo-rithm, linear segment fitting algoalgo-rithm(LS), polynomial fitting algorithm, cubic spline curve fitting algorithm, aggregation algorithm based on polymerization coefficient, aggregation algorithm based on weighted dominating set and so on [7]. While the above algorithms target at a better balance between the aggregation and accuracy, the error in accuracy is still considerable and greatly affects the accuracy of routing selection. Therefore, it’s necessary to improve the balance between the aggregation and accuracy. The novelty of the new proposed algorithm is to measure the aggregation accuracy with the distortion area, which makes the measurement of topology aggregation more accurate. It’s different from using the success rate of routing algorithm to measure the performance of topology aggregation algorithm, because the routing algorithm can influence the aggregation accuracy of topology aggrega-tion algorithm to some extent.
2. ML-S Algorithm
2.1. Stair Generation Algorithm
This algorithm is capable to provide detailed description of topology informa-tion. To describe a link l u v
(
,)
of a domain, a pair of QoS values(
d wl, l)
are used, in which dl and wl represent the delay and bandwidth of the link,re-spectively. The demand of delay and bandwidth for an arbitrary service request is represented by r r r
(
d, w)
. When rd ≥dl, rw≤wl, the link can provideser-vices for the request.
DOI: 10.4236/cn.2017.94017 237 Communications and Network
( ) ( )
( ) ( )
, ,
, ,
min
pi u v pi u v
pi u v pi u v
w w
d d
∈
∈
= =
[image:3.595.268.472.355.499.2]
∑
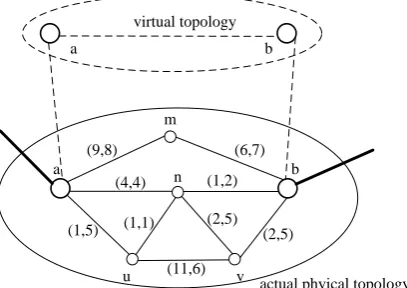
(1)Figure 1 shows a simple network physical topology. In the basic process of stair generation algorithm, nodes a and b are selected to maintain, and all links and nodes between them are aggregated into virtual topology.
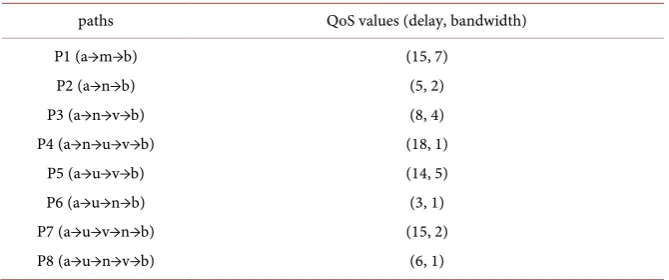
To analyze, the first step is to find all the physical paths between a and b as shown in Table 1, and then abstract them into a logical path with weights. The first physical path is optimal if the bandwidth is the only factor under considera-tion. While the sixth physical path is the best if the delay is concerned. By the same token, the QoS values of any physical paths cannot fully represent the routing information between node a and b, when bandwidth and delay are both counted. In other words, it’s impossible to find the optimal path under both conditions.
In Figure 2, the bandwidth is plotted over the delay, and the topology infor-mation is represented by a set of inflection points forming a stair shape.
What determine the shape of the stair are not all the paths, but the path {p6, p2, p3, p5, p1}. Thus they are defined as the stair representation points. In the
[image:3.595.266.492.540.707.2]Figure 1.Sketch of physical and virtual topologies.
Figure 2.Original stair figure[8].
m
u v
a b
(9,8)
(1,5)
(11,6)
(2,5) (6,7) virtual topology
b a
actual phyical topology n
(4,4) (1,2)
(2,5) (1,1)
bandwidth
delay
2 4 6 8 10 12 14 16 18
2 4 6 8
p1
p2 p3
p4 p5
p6 1
3 5 7
p7
p8
DOI: 10.4236/cn.2017.94017 238 Communications and Network Table 1.All paths between nodes a and b.
paths QoS values (delay, bandwidth) P1 (a→m→b)
P2 (a→n→b) P3 (a→n→v→b) P4 (a→n→u→v→b)
P5 (a→u→v→b) P6 (a→u→n→b) P7 (a→u→v→n→b) P8 (a→u→n→v→b)
(15, 7) (5, 2) (8, 4) (18, 1) (14, 5) (3, 1) (15, 2)
(6, 1)
coordinate plane, the lower right of the stair is defined as an acceptable service request area (ASA) and the upper left is defined as an unaccepted service request area (UASA).
The original stair can accurately reflect the real information of network to-pology, but the redundancy is not acceptable. Further fitting on its basis is re-quired [9]. Inevitably, the compression of topology information will impair the descriptive accuracy of network resource, i.e. topology distortion. There are two kinds of topology distortion, one is the rejection of connection requests when service is available (Error Rejected Area, ERA), also known as underestimation distortion; another is blind acceptance of connection requests when service is not accessible (Crank Back Area, CBA), namely overestimation distortion [10]. The underestimation distortion often results in a waste of the available resources of the network, and overestimation distortion misleads the service requests into an area without the physical path meeting its QoS requirements.
As the two important indexes of the aggregation algorithm used to describe the accuracy of original network topology information, Error Rejected Ratio (ERR) and Crank Back Ratio (CBR) can reflect the influence of underestimation and overestimation distortions on network performance better. The calculation formulas are:
Number of feasible requests rejected ERR
Number of overall feasible requests
= (2)
Number of unfeasible requests accepted CBR
Number of requests accepted
= (3)
The two indicators, ERR and CBR, constituting the description accuracy of the network, combine the aggregation degree, and the balance between the ag-gregation degree and description accuracy. They are the focus of this study [11].
2.2. Stair Fitting Algorithm
DOI: 10.4236/cn.2017.94017 239 Communications and Network
showed in Figure 3. Stair fitting algorithm generates a new even stair to ap-proximate original stair. pdown
(
Dmin,Wmin)
and pup(
Dmax,Wmax)
represent thehighest and lowest points of the original stair, and fL denotes the equation of
the fitting segment L. 1
L
f− is its inversion function. The basic procedures of stair fitting algorithm are:
Step 1: Use least square method to generate a line segment L, and use the two endpoints
(
min, min)
L L L
down
p D W and pupL
(
DmaxL ,WmaxL)
to represent it.(
)
min min
L L
W
=
f
D
; minL minD =D ; max 1
(
max)
L L
D
=
f
−W
; maxL maxW =W . Step 2: Define a new parameter
(
max min)
(
1)
L L
L D D n
δ
= − − to represent the length of each step of the new stair, n is the number of representation points on the original stair.Step 3: The delay of the new fitted stair is as follows:
1 min
L L D =D
(
)
2 min
2 1
L L L
D
=
D
+ −
δ
(
)
min
1
maxL L L L
n
D
=
D
+ −
n
δ
=
D
Step 4: The corresponding bandwidth value of each delay is calculated by
( )
L L
i L i
W = f D .
A new fitted stair is calculated accordingly and its redundancy is fixed. It can be represented by the five parameters (Dmin, Dmax, Wmin, Wmax,
n
).2.3. Multiline Fitting Algorithm
[image:5.595.262.484.528.701.2]Multiline fitting algorithm is an improvement of the least squares fitting algo-rithm. Due to the fixed redundancy of the least squares fitting algorithm, there is only one line segment. However, the algorithm can induce a considerable topol-ogy distortion for complex network topoltopol-ogy structures. The main reason of the distortion is the inhomogeneity and mutability of the stair. To this end, multi-line fitting algorithm is proposed in Figure 4.
Figure 3. Schematic diagram of stair fitting algorithm [12].
bandwidth
delay
2 4 6 8 10 12 14 16 18 2
4 6 8
p1
p2
p3
p4 p5
p6 1
3 5 7
p7
p8
DOI: 10.4236/cn.2017.94017 240 Communications and Network Figure4.Schematic diagram of multiline fitting algorithm [13].
Compared with the least square fitting algorithm, the number of fitting line segment is greater than or equal to 1. The change in quantity is determined by the inflection points, which regulate the shape of the stair greatly and are defined as the mutation points. Because the determination of mutation points decides the fitting accuracy, the key of this fitting algorithm lies in the selection of muta-tion points (Equamuta-tion (4)):
(
)
2(
)
1
the set value 2 n
v j
j
w w i n
=
− ≤ ≤ ≤
∑
(4)For each inflection point, the true bandwidth of delay dj is wj. wv is the
fitted bandwidth for delay dj. The fitted bandwidth based on mutation point i
is decided by the least squares fitting algorithm at both ends of the point. Equa-tion (4) shows the variance of the real stair and the fitting curve. The variance is inversely proportional to the fitting. If the variance is less than the set value, the fitting effect is preferable and satisfies the conditions, with i becoming a muta-tion point. Otherwise, i is an ordinary inflecmuta-tion point. Equamuta-tion (5) is the fitting line segment of both ends of the mutation point.
{
}
(
)
{
}
(
)
1 1 1 1 2 1
2 2 2 1
, , ,
, , ,
i j j i
i j j i i n
w k d b d d d d
w k d b d d d d
−
+
= + ∀ ∈
= + ∀ ∈
(5)
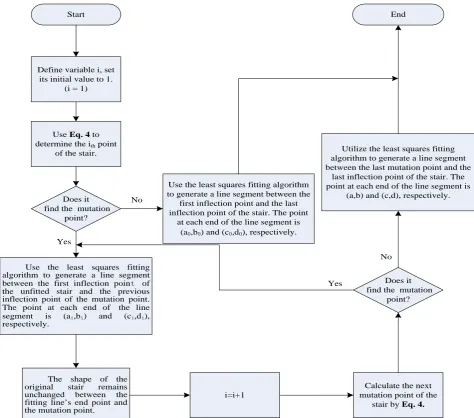
The basic procedure of multiline fitting algorithm:
Step 1: Define variable i, set its initial value to 1, which is the number of muta-tion points.
Step 2: Use Equation (4) to determine the ith point of the stair. If no mutation point is found, go to Step 7.
Step 3: Use the least squares fitting algorithm to generate a line segment be-tween the first inflection point of the unfitted stair and the previous inflection point of the mutation point. The point at each end of the line segment is (ai, bi) and (ci, di), respectively.
bandwidth
delay
2 4 6 8 10 12 14 16 18
2 4 6 8
p1
p2
p3
p4 p5
p6 1
3 5 7
p7
DOI: 10.4236/cn.2017.94017 241 Communications and Network
Step 4: The shape of the original stair remains unchanged between the fitting line’s end point and the mutation point.
Step 5: Plus the value of i by 1, i= +i 1.
Step 6: Calculate the next mutation point of the stair by Equation (4). If the mutation point could not be found, utilize the least squares fitting algorithm to generate a line segment between the last mutation point and the last inflection point of the stair. The point at each end of the line segment is (a, b) and (c, d), respectively. Algorithm ends. Otherwise, go to Step 3.
Step 7: Use the least squares fitting algorithm to generate a line segment be-tween the first inflection point and the last inflection point of the stair. The point at each end of the line segment is (a0, b0) and (c0, d0), respectively. Algorithm ends.
[image:7.595.61.536.277.695.2]Flow chart of multiline fitting algorithm is shown in Figure 5.
Figure 5.Flow chart of multiline fitting algorithm. Start
Define variable i, set its initial value to 1.
(i = 1)
Use Eq. 4 to determine the ith point
of the stair.
Does it find the mutation
point?
Use the least squares fitting algorithm to generate a line segment between the first inflection point of the unfitted stair and the previous inflection point of the mutation point.
The point at each end of the line
segment is (ai,bi) and (ci,di),
respectively. Yes
The shape of the original stair remains unchanged between the fitting line’s end point and the mutation point.
i=i+1
Calculate the next mutation point of the
stair by Eq. 4.
Does it find the mutation
point?
Utilize the least squares fitting algorithm to generate a line segment between the last mutation point and the
last inflection point of the stair. The point at each end of the line segment is
(a,b) and (c,d), respectively.
No
Yes
End
Use the least squares fitting algorithm to generate a line segment between the
first inflection point and the last inflection point of the stair. The point
at each end of the line segment is (a0,b0) and (c0,d0), respectively.
DOI: 10.4236/cn.2017.94017 242 Communications and Network
The initial redundancy of multiline fitting algorithm is two points, which in-crease with the number of mutation points. Adding a mutation point will lead to one more fitting line and subsequently increase the redundancy by two points.
2.4. ML-S Algorithm
The redundancy of the stair fitting algorithm is fixed and its complexity is low, thereby suitable for the network with simple topology structure. However, the redundancy of multiline fitting algorithm is positively correlated with the num-ber of mutation points, making it applicable to the network with complex to-pology structure. Combining the characteristics of both algorithms, we design an algorithm—ML-S—aiming at the elegant balance of aggregation degree and ac-curacy. The entire network topology is composed of several parts, with appro-priate aggregation algorithm for each part. For parts with fewer mutation points, the multiline fitting algorithm with high accuracy is adopted. Because of the small number of mutation points, the redundancy is low. On the contrary, stair fitting algorithm can provide a better balance of aggregation degree and accura-cy.
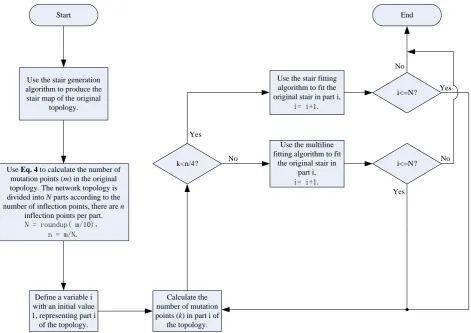
The basic procedure of ML-S algorithm:
Step 1: Use the stair generation algorithm to produce the stair map of the original topology.
Step 2: Use Equation (4) to calculate the number of mutation points (m) in the original topology. The network topology is divided into N parts according to the number of inflection points, N = roundup (m/10). And there are n inflection points per part, n = m/N.
Step 3: Define a variable i with an initial value 1, representing part i of the to-pology.
Step 4: Calculate the number of mutation points (k) in part i of the topology. If k < n/4, go to Step 5; Otherwise, go to Step 6.
Step 5: Use the stair fitting algorithm to fit the original stair in part i and add 1 to i, i i= +1. When i≤N , go to Step 4; otherwise, end algorithm.
Step 6: Use the multiline fitting algorithm to fit the original stair in part i and add 1 to i, i i= +1. When i≤N, go to Step 4; otherwise, end algorithm.
Flow chart of ML-S algorithm is shown in Figure 6.
2.5. Complexity Analysis
Complexity includes time complexity and space complexity, space complexity refers to redundancy on performance indicators, so here's an analysis of the time complexity. In order to make quantitative analysis and easier to understand, it is necessary to redescribe the network model used in this paper.
The entire network is composed of many domains, N G L
(
, d)
represents the entire network. G is the set of all domains, G={
g gi i =(
V E Bi, i, i)
,1≤ ≤i G}
shows that the network is divided into G domains. Vi, Ei and Bi
DOI: 10.4236/cn.2017.94017 243 Communications and Network Figure 6.Flow chart of ML-S algorithm.
i
g . Vi , Ei and Bi represent the number of nodes, links and boundary nodes respectively in domain gi. The number of mutation points is Mi in domain gi. The number of mutation points is mj in part j of domain gi.
The time complexity of the four aggregation algorithms depends mainly on the calculation times of least squares algorithm. least squares algorithm’s time complexity is O E
( )
; Because stair fitting algorithm only calculate least squaresalgorithm once, stair fitting algorithm’s time complexity is also O E
( )
;Analo-gously, multiline fitting algorithm’s time complexity is O M E
(
)
; ML-Salgo-rithm’s time complexity is O a m E
(
+b E)
, a and b represent calculationtimes of multiline fitting algorithm and stair fitting algorithm respectively.
3. Simulation
3.1. Experimental Scheme 1
The simulation of the experimental Scheme 1 is carried out in the fixed network topology. The selected topologies are five nodes network topology (5 nodes, 8 links), NFSNET network topology (14 nodes, 21 links), and EON network to-pology (19 nodes, 38 links).
The simulation parameters of network model are set as follows: the bandwidth of each physical link is randomly generated between [1, 20] units, each unit can
Start End
Use the stair generation algorithm to produce the stair map of the original
topology.
Use Eq. 4 to calculate the number of mutation points (m) in the original topology. The network topology is divided into N parts according to the number of inflection points, there are n
inflection points per part.
N = roundup( m/10),
n = m/N.
Define a variable i with an initial value 1, representing part i
of the topology.
Calculate the number of mutation points (k) in part i of
the topology. k<n/4?
Use the multiline fitting algorithm to fit
the original stair in part i,
i= i+1.
i<=N? Use the stair fitting
algorithm to fit the original stair in part i,
i= i+1.
i<=N?
No Yes
No
Yes
No
DOI: 10.4236/cn.2017.94017 244 Communications and Network
represent a certain number of Mbps; the delay of each physical link is randomly generated between [5, 20] units, each unit can represent a certain number of ms; randomly select 10% - 20% nodes of each domain to be boundary nodes and generate random links to connect all the boundary nodes; 500 random requests were randomly generated between the designated boundary nodes of the net-work topology. In order to guarantee that the distortion area is fully measured, random requests need to satisfy Equation (6):
(
)
{
D,
W min D max min W max}
R
=
R R
d
≤
R
≤
d
w
≤
R
≤
w
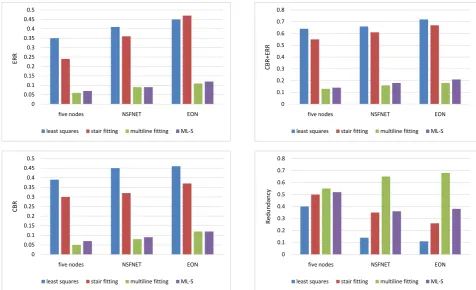
(6)Under the same conditions of network resource allocation, the algorithm per-formance indexes of the least squares algorithm, stair fitting algorithm, multiline fitting algorithm, and ML-S algorithm are compared (ERR, CBR, ERR + CBR, Redundancy).
[image:10.595.58.535.401.691.2]The following conclusions can be drawn from the data in Figure 7: In the fixed topology, ML-S algorithm on the three performance indicators (CBR, ERR, and CBR + ERR) is superior to least squares algorithm and stair fitting algorithm, mainly because it takes into account the inhomogeneity and mutability of the stair, and selects some significant mutation points to achieve more accurate de-scription of the topology. ML-S is close to the multiline fitting algorithm with optimal distortion performance, the main reason is multiline fitting algorithm is a vital part of ML-S algorithm and ML-S algorithm takes full advantage of great
Figure 7.Performance comparison of the least squares algorithm, stair fitting algorithm, multiline fitting algorithm, and ML-S algorithm.
0 0.05 0.1 0.15 0.2 0.25 0.3 0.35 0.4 0.45 0.5
five nodes NSFNET EON
ERR
least squares stair fitting multiline fitting ML-S
0 0.05 0.1 0.15 0.2 0.25 0.3 0.35 0.4 0.45 0.5
five nodes NSFNET EON
CB
R
least squares stair fitting multiline fitting ML-S
0 0.1 0.2 0.3 0.4 0.5 0.6 0.7 0.8
five nodes NSFNET EON
CB
R+
ERR
least squares stair fitting multiline fitting ML-S
0 0.1 0.2 0.3 0.4 0.5 0.6 0.7 0.8
five nodes NSFNET EON
Re
dunda
nc
y
DOI: 10.4236/cn.2017.94017 245 Communications and Network
distortion performance of multiline fitting algorithm; Because of stair fitting al-gorithm helps to suppress the redundancy of ML-S alal-gorithm, ML-S alal-gorithm is far better than multiline fitting algorithm in redundancy. Compared with the least squares algorithm and stair fitting method, ML-S algorithm obtains a sig-nificant improvement on the description of topology information with less re-dundancy, though redundancy rate is relatively increased. In terms of the bal-ance between aggregation degree and accuracy, ML-S algorithm is significantly better than other algorithms, making a good balance between two aspects.
3.2. Experimental Scheme 2
The simulation of the experiment Scheme 2 is carried out in the random net-work topology. Using Waxman model to generate netnet-work topology randomly, the model is close to the real network and is widely used in simulation of various network routing algorithms. The generation rules of network model are as fol-lows: All nodes of each domain are randomly distributed within a specified area, and each node is determined by randomly generated coordinates. The probabil-ity p u v
(
,)
of direct link between two nodes is:( )
, exp d u v( )
, p u vL
β
α
−= (7)
( )
,d u v represents the distance between node u and v; L represents the max-imum distance between the two nodes in the model;
α
andβ
are parame-ters within the range (0, 1).α
represents the ratio of the number of longer links to shorter links, Increasingα
will increase the number of long links, while the number of shorter links will decrease correspondingly.β
represents the link density in the topology,β
guarantees the uniformity of link distribu-tion.To simulate the experiment, 50 Waxman topologies were randomly generated each time. The number of nodes in the domain were selected as {10, 20, 30, 40, 50, 60, 70, 80, 90, 100} in turn. Firstly, measure 50 ERR and CBR values of 50 Waxman topologies have 10 nodes in the domain and calculate the average value of the 50 ERR and CBR values as final experimental data. In the same way, to get other ERR and CBR values of Waxman topologies have different nodes in the domain from 20 nodes to 100 nodes. Between the designated boundary nodes of the network topology, 500 random requests were randomly generated. In order to ensure distortion area is fully measured, the random requests need to satisfy Equation (6).
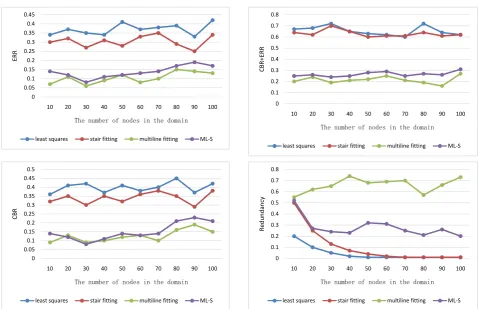
Under the same network resource allocation conditions, the algorithm per-formance indexes of the least squares algorithm, stair fitting algorithm, multiline fitting algorithm and ML-S algorithm are compared (ERR, CBR, ERR+CBR, Redundancy).
DOI: 10.4236/cn.2017.94017 246 Communications and Network Figure 8. Performance comparison of the least squares algorithm, stair fitting algorithm,multiline fitting algorithm, and ML-S algorithm.
(CBR, ERR, and CBR + ERR) is superior to least squares algorithm and stair fit-ting algorithm, mainly because the redundancy of ML-S algorithm is not fixed but the redundancy of least squares algorithm and stair fitting algorithm is fixed, ML-S improves the accuracy of network topology description by adding redun-dancy properly. ML-S is close to the multiline fitting algorithm with optimal distortion performance and the index tends to be stable with the number of nodes in the domain increases, the main reason is ML-S algorithm dynamically chooses algorithm that is more accurate and less redundant. For parts with fewer mutation points, the multiline fitting algorithm with high accuracy is adopted. On the contrary, stair fitting algorithm is adopted; Because of the smaller num-ber of mutation points, ML-S algorithm is far better than the multiline fitting algorithm in redundancy and the index tends to be stable with the increase of the node number in the domain. The ML-S algorithm has reduced CBR and ERR approximately to half compared with the least squares algorithm and the stair fitting algorithm, greatly improving access success rate for feasible requests. ML-S algorithm not only reduces the waste of network resources, but also im-proves the overall performance of the network.
4. Conclusion
The proposed ML-S algorithm has better balance of aggregation degree and ac-0
0.05 0.1 0.15 0.2 0.25 0.3 0.35 0.4 0.45
10 20 30 40 50 60 70 80 90 100
ERR
The number of nodes in the domain
least squares stair fitting multiline fitting ML-S
0 0.1 0.2 0.3 0.4 0.5 0.6 0.7 0.8
10 20 30 40 50 60 70 80 90 100
CB
R+
ERR
The number of nodes in the domain
least squares stair fitting multiline fitting ML-S
0 0.05 0.1 0.15 0.2 0.25 0.3 0.35 0.4 0.45 0.5
10 20 30 40 50 60 70 80 90 100
CB
R
The number of nodes in the domain
least squares stair fitting multiline fitting ML-S
0 0.1 0.2 0.3 0.4 0.5 0.6 0.7 0.8
10 20 30 40 50 60 70 80 90 100
Re
dunda
nc
y
The number of nodes in the domain
DOI: 10.4236/cn.2017.94017 247 Communications and Network
curacy. Based on the stair generation algorithm, stair fitting algorithm, and mul-tiline fitting algorithm, the ML-S algorithm improves the accuracy of network topology description by adding redundancy properly according to the specific topology information of each domain. The ML-S algorithm also dynamically chooses algorithm that is more accurate and less redundant. Compared with other algorithms in both fixed topology and random topology, the simulation results show that the ML-S algorithm has a stable and decent aggregation per-formance and achieves a better balance between the aggregation degree and ac-curacy. On overall distortion performance indicators, ML-S algorithm can re-duce nearly 60% compared with least squares algorithm and stair fitting algo-rithm. On redundancy, ML-S algorithm can reduce nearly 50% compared with multiline fitting algorithm. Moreover, the proposed algorithm should be further studied in the following aspects. Firstly, dynamic updating mechanism of topol-ogy might be considered in the process of topoltopol-ogy aggregation. Secondly, the topology aggregation algorithm with multi-parameter combination should be designed in addition to delay and bandwidth.
References
[1] Zhao, J.P. and Wang, C.J. (2017) Topology Optimization for Minimizing the Max-imum Dynamic Response in the Time Domain Using Aggregation Functional Me-thod. Computers and Structures, 190, 41-60.
https://doi.org/10.1016/j.compstruc.2017.05.002
[2] Quan, B.S., Li, H. and Le, Z.C. (2014) A Topology Aggregation Scheme in Mul-ti-Domain WDM-TDM Networks. Advanced Materials Research, 926-930, 2919-2923.https://doi.org/10.4028/www.scientific.net/AMR.926-930.2919
[3] Nakata, Y., Shin’ichi, A. and Masayuki, M. (2015) Analyzing the Evolution and the Future of the Internet Topology Focusing on Flow Hierarchy. Journal of Computer Networks and Communications, 2015, Article ID: 736870, 18 p.
[4] Das, S. and Sahni, S. (2017) Two-Aggregator Topology Optimization Using Mul-tiple Paths in Data Center Networks. IEEE Transactions on Cloud Computing, 99, 1.
[5] Krätschmer, V., Schied, A. and Zähle, H. (2017) Domains of Weak Continuity of Statistical Functionals with a View toward Robust Statistics. Journal of Multivariate Analysis, 158, 1-19.https://doi.org/10.1016/j.jmva.2017.02.005
[6] Gao, C.Y., Cankaya, H.C. and Jue, J.P. (2014) Survivable Inter-Domain Routing Based on Topology Aggregation With Intra-Domain Disjointness Information in Multi-Domain Optical Networks. Journal of Optical Communications and Net-working, 6,619-628.https://doi.org/10.1364/JOCN.6.000619
[7] Costa, L.R., Ramos, G.N. and Drummond, A.C. (2016) Leveraging Adaptive Mod-ulation with Multi-Hop Routing in Elastic Optical Networks. Computer Networks, 105, 124-137.https://doi.org/10.1016/j.comnet.2016.05.025
[8] Tang, Y., Chen, S.G. (2004) QoS Information Approximation for Aggregated Net-works. IEEE International Conference on Communications, Paris, 20-24 June 2004, Vol. 4, 2107-2111.https://doi.org/10.1109/ICC.2004.1312890
Bi-DOI: 10.4236/cn.2017.94017 248 Communications and Network
ochimica et Biophysica Acta, 1861, 1303-1311.
https://doi.org/10.1016/j.bbagen.2016.11.034
[10] Feng, J., Ma, S.-Q., Fan, M.-H. and Wang, K.-N. Research on MPLS Network To-pology Aggregation Algorithm With the Effective Connected Dominating Sets. Ap-plied Mechanics and Materials, 155-156, 1025-1029.
https://doi.org/10.4028/www.scientific.net/AMM.155-156.1025
[11] Hong, S.J. and Jue, J.P. Effective Virtual Optical Network Embedding Based on To-pology Aggregation in Multi-Domain Optical Networks. Optical Fiber Communi-cation Conference, San Francisco, California, 9-13 March 2014.
https://doi.org/10.1364/OFC.2014.M3H.3
[12] Zhang, J.J., Han, Y.B. and Wang, L.G. Topology Aggregation Methods Based on Fit-ting Staircase. International Conference on Computer and Electrical Engineering, Phuket, 20-22 December 2008, 344-348.https://doi.org/10.1109/ICCEE.2008.105
![Figure 3. Schematic diagram of stair fitting algorithm [12].](https://thumb-us.123doks.com/thumbv2/123dok_us/56991.506072/5.595.262.484.528.701/figure-schematic-diagram-stair-fitting-algorithm.webp)