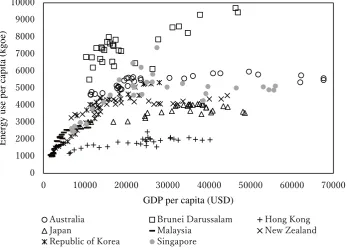
Does the energy environmental Kuznets curve hypothesis sustain in the Asia Pacific region?
Full text
Figure


Related documents
Trevor Cowie is a Senior Curator in the Early Prehistory section of the Department of Scottish History & Archaeology, National Museums Scotland, with special responsibility
“ Start the timer, pick up the object between the two markers as demonstrated, and move it as quickly as possible, to the front slot, and then stop the timer.”. Lateral: place the
The horizontal diffusion DAG characterized by a high number of stencils reading the same input locations (28 accesses of 10 unique fields), allowing for the communication volume
Dataset Description Sample size Classes ICV NAO Face Image Data gathered by ICV research group 310 31 ICV NAO Face Video Data gathered by ICV research group 17 video files 17
Consider preventive treatment (given on an ongoing basis whether or not an attack is present) for those patients whose migraine has a substantial impact on their lives and have
An interesting question is whether the velocity structures that we have associated with the tall attached clusters are features of the whole outer region, or whether they just appear
In our system, clients requesting different consistency guarantees experience different performance and availability for the read operations that they perform, even when
In spite of a comparable performance in the base-line results with other types of semantic similarities for certain evaluation measures as shown in Figure 5.15, the base- line


