ORIGINAL RESEARCH
Metabolic Assessment of Gliomas Using
11
C-Methionine, [
18
F] Fluorodeoxyglucose, and
11
C-Choline Positron-Emission Tomography
T. Kato J. Shinoda N. Nakayama K. Miwa A. Okumura H. Yano S. Yoshimura T. Maruyama Y. Muragaki T. Iwama
BACKGROUND AND PURPOSE: Positron-emission tomography (PET) is a useful tool in oncology. The aim of this study was to assess the metabolic activity of gliomas using 11C-methionine (MET), [18F] fluorodeoxyglucose (FDG), and11C-choline (CHO) PET and to explore the correlation between the metabolic activity and histopathologic features.
MATERIALS AND METHODS: PET examinations were performed for 95 primary gliomas (37 grade II, 37 grade III, and 21 grade IV). We measured the tumor/normal brain uptake ratio (T/N ratio) on each PET and investigated the correlations among the tracer uptake, tumor grade, tumor type, and tumor proliferation activity. In addition, we compared the ease of visual evaluation for tumor detection.
RESULTS: All 3 of the tracers showed positive correlations with astrocytic tumor (AT) grades (II/IV and III/IV). The MET T/N ratio of oligodendroglial tumors (OTs) was significantly higher than that of ATs of the same grade. The CHO T/N ratio showed a significant positive correlation with histopathologic grade in OTs. Tumor grade and type influenced MET uptake only. MET T/N ratios of more than 2.0 were seen in 87% of all of the gliomas. All of the tracers showed significantly positive correlations with Mib-1 labeling index in ATs but not in OTs and oligoastrocytic tumors.
CONCLUSION:MET PET appears to be useful in evaluating grade, type, and proliferative activity of ATs. CHO PET may be useful in evaluating the potential malignancy of OTs. In terms of visual evaluation of tumor localization, MET PET is superior to FDG and CHO PET in all of the gliomas, due to its straightforward detection of “hot lesions”.
P
ositron-emission tomography (PET) can provide valuable metabolic information and is used for grading and char-acterizing brain tumors, evaluating treatment response, and predicting prognosis. In brain tumors, the 2 most widely used tracers are [18F] fluorodeoxyglucose (FDG) and11 C-methio-nine (MET). In previous reports, a relationship was found between FDG uptake and glioma grade and between MET uptake and glioma grade.1-8FDG allows detection of the in-creased glucose uptake characteristic of malignant cells, so FDG PET has previously been used successfully in oncology. Recent studies of other organ systems have demonstrated a close correlation with FDG uptake and the proliferative activ-ity of tumors.9-12Due to the high-glucose metabolism in nor-mal brain tissue, however, FDG may not be the ideal tracer for detection of gliomas. MET is more appropriate to image the size and spread of gliomas, even without enhancement on contrast-enhanced MR imaging, because MET PET has the advantage of showing selective uptake in the brain tumor compared with normal brain tissue. More recently,11 C-cho-line (CHO) was introduced as another novel agent to evaluate different aspects of tumors.13-16In both low-grade and high-grade oligodendrogliomas (ODs) increased vascular attenuation was seen, in contrast to astrocytic tumors (ATs), for which microvascular
prolifera-tion was seen in only high-grade tumors.17,18Using conven-tional modalities, there are no specific neuroradiologic fea-tures that can differentiate between ATs and oligodendroglial tumors (OTs); however, clinical management of OTs differs from other gliomas due to the specific chemotherapeutic sen-sitivities of OTs.19,20We hypothesized that a multitracer inves-tigation that examined pretreatment tumor uptake compared with normal brain would provide valuable information about glioma grade and type; therefore, we studied metabolic activity by using MET, FDG, and CHO PET and compared them with tumor pathology. In addition, we compared the ease with which tumors could be visually evaluated in each system and investigated each tumor’s proliferation index, comparing this with the metabolic activity as measured with PET.
Materials and Methods
Patients
From January 1, 2002, through June 30, 2006, we examined the met-abolic activity of primary gliomas in 95 patients at the Chubu Medical Center for Prolonged Traumatic Brain Dysfunction, Kizawa Memo-rial Hospital, in this retrospective study. All of the patients gave writ-ten informed consent, and the protocol was approved by the research committee of Kizawa Memorial Hospital Foundation.
PET examinations performed in patients with brain stem gliomas and World Health Organization (WHO) grade I tumors were ex-cluded. We also excluded stereotactic biopsy cases, because histology was occasionally insufficient for definitive tumor grading. All of the patients underwent open surgical procedures within 4 weeks after PET scanning. Presurgical radiologic evaluation was performed with MET PET, FDG PET, CHO PET, and contrast-enhanced MR imaging in all of the patients. We included cases of “the hottest lesion” dem-onstrated preoperatively on each PET that were resectable. Tumors
Received November 21, 2007; accepted after revision December 26.
From the Chubu Medical Center for Prolonged Traumatic Brain Dysfunction (T.K., J.S., K.M., A.O.), Kizawa Memorial Hospital, Minokamo City, Gifu, Japan; Department of Neurosurgery (T.K., N.N., H.Y., S.Y., T.I.), Gifu University Graduate School of Medicine, Gifu, Japan; and Department of Neurosurgery (T.M., Y.M.), Neurological Institute, Tokyo Women’s Medical University, Tokyo, Japan.
Please address correspondence to Takayuki Kato, Chubu Medical Center for Prolonged Traumatic Brain Dysfunction, Kizawa Memorial Hospital, 630 Shimokobi, Kobi-machi, and Minokamo City, Gifu, Japan 505-0034; e-mail: ttaka1010@gmail.com
were classified according to their histologic diagnosis by using the WHO classification. Fifty-four tumors were ATs, 22 were OTs, and 19 were mixed oligoastrocytic tumors (OATs), and all of the tumors were located supratentorially. A summary of these data is shown in Table 1.
PET Scan Procedure
The PET study was carried out according to the standardized proce-dure used in our institution. The PET scanner was an ADVANCE NXi Imaging System (General Electric Yokokawa Medical System, Hino-shi, Tokyo, Japan), which provides 35 transaxial images at 4.25-mm intervals. The in-plane spatial resolution (full width at half maxi-mum) was 4.8 mm, and the scan mode was the standard 2D mode. Before the emission scan was performed, a 3-minute transmission scan was performed to correct photon attenuation with a ring source containing68Ge. Patients fasted for at least 4 hours before PET stud-ies. A venous cannula was inserted in the forearm for injection of the radiopharmaceuticals. From this cannula, a blood sample was also drawn to measure the serum glucose level, and blood glucose levels were corrected if necessary. A dose of 7.0 MBq/kg of MET, 5.0 MBq/kg of FDG, or 7.0 MBq/kg of CHO was injected intravenously, depending on the examination. The emission scan was acquired as follows: 1) for 30 minutes, beginning 5 minutes after MET injection; 2) for 7 minutes, beginning 35 minutes after FDG injection; and 3) for 7 minutes, beginning 2 minutes after CHO injection. During PET data acquisition, head motion was continuously monitored by using laser beams projected onto ink markers drawn over the forehead skin and corrected manually, as necessary. The images were reconstructed by using the ordered-subsets expectation maximization algorithm.
MR Imaging Procedure
MR imaging was performed on a 1.5T system (Signa; GE Medical Systems, Milwaukee, Wis). T1-weighted images, T2-weighted images, and fluid-attenuated inversion recovery (FLAIR) images were ac-quired using our standard protocol. For coregistration of metabolic and anatomic data, 3D spoiled gradient-echo images were also ac-quired after administration of 0.2 mL/kg of gadopentetate dimeglu-mine (Gd-DTPA, Magnevist; Nihon Shering, Osaka, Japan) by using following parameters: no gap; 1.0-mm thickness; TR/TE⫽20.0/1.6 ms; flip angle⫽15°; NEX⫽1; and axial views.
Tumor volume was measured using the Gd-DTPA enhanced area. When enhancement was absent, we referred to the FLAIR image.
Gd-DTPA enhancement was classified as follows: none, no enhance-ment; weak, partial or slight enhanceenhance-ment; or strong, obvious en-hancement throughout the tumor.
Data Analysis
Tracer accumulation in the regions of interest (ROIs) was analyzed as the standardized uptake value (SUV), which is the activity concentra-tion in the ROI at a fixed time point divided by the injected dose normalized to the patient’s measured weight. The MET, FDG, and CHO SUV tumor/normal brain uptake ratios (T/N ratios) were cal-culated by dividing the maximum SUV for the tumor by the mean SUV of contralateral normal frontal cortex. The tumor SUVs were selected as the highest accumulation, and the reference ROIs were drawn in 3 circular ROIs with a diameter of 10 mm on each of the 3 axial planes. Coregistration of PET and MR imaging was undertaken in all of the cases with the Dr View, an image analysis software package (AJS, Tokyo, Japan), by using a method described by Kapouleas et al.21If increased accumulation was absent or not clear, an ROI was selected in consultation with the fusion image. We used the T/N ratio instead of absolute SUV because of the high, unexplained intersubject variability of SUV. We used tumor maximum SUV instead of tumor mean SUV to minimize the effect of tumor heterogeneity. In each tracer we defined the T/N ratios more than 2.0 as hot lesions and carried out analysis of what percentage took in all of the cases to evaluate visual ease for tumor detection.
Proliferation Activity
The tumors were graded according to the WHO classification of brain tumors from representative hematoxylin-eosin-stained slides of each tumor. An avidin-biotin immunoperoxidase or simple stain MAX peroxidase (Nichirei, Tokyo, Japan) technique was used to perform a Mib-1 monoclonal antibody (DAKO, Glostrup, Denmark) assay in selected sections of each case. The Mib-1 labeling index (LI) was quantified visually by counting the number of mitoses in areas of the tumor showing the highest number of immunopositive nuclei. All of the tissue sections were examined at high-power magnification (⫻400) along horizontal and vertical axes perpendicular to each other until 1000 cells were counted. Only neoplastic cells were included in the quantification of the Mib-1-positive cells. Necrotic and hemor-rhagic areas and the borders of each section were omitted from quan-tification. The results were expressed as the percentage of Mib-1-positive cells per 1000 tumor cells.
Table 1: Histopathologic results according to WHO classification and MRI findings
WHO Classification No. of Patients Age, Mean⫾SD, y Tumor Size, Mean⫾SD, cm3
MRI Enhancement*
None Weak Strong Grade II
Diffuse astrocytoma 14 37.9⫾13.4 51.1⫾44.4 11 1 2 Oligodendroglioma 9 36.8⫾12.4 65.7⫾56.7 6 3 0 Oligoastrocytoma 14 38.6⫾14.1 48.3⫾41.0 12 1 1 Grade III
Anaplastic astrocytoma 19 43.2⫾13.6 48.7⫾23.3 5 8 6 Anaplastic oligodendroglioma 13 50.2⫾14.8 40.4⫾27.6 4 2 7 Anaplastic oligoastrocytoma 5 44.2⫾18.8 35.2⫾10.2 3 2 0 Grade IV
Glioblastoma multiforme 21 60.0⫾10.9 43.7⫾32.7 0 3 18
Total 95 45.9⫾15.6 47.6⫾35.6 41 20 34
Note:—MRI indicates MR imaging; WHO, World Health Organization.
* None indicates no enhancement; weak, partial or slight enhancement; strong, obvious enhancement.
BRAIN
ORIGINAL
Statistical Analysis
Data are presented as means⫾SDs. To compare the T/N ratios be-tween histologic grade and type, statistical analyses were performed using analysis of variance and a Tukey post hoc test. Analyses of co-variance (ANCOVAs) were used to determine whether tumor-related factors (grade, type, Gd-DTPA enhancement, and tumor size) influ-enced each tracer uptake. To compare the percentage of the hot le-sions among 3 tracers, statistical analyses were performed using2 test with Bonferroni correction. To determine whether tracer accu-mulations were related to each other and/or to proliferation activity, Spearman correlation coefficients were calculated.Pvalues less than .05 were considered statistically significant.
Results
Semiquantitative Analysis of PET Studies
The mean SUVs of the contralateral normal frontal cortex of MET, FDG, and CHO were 1.25⫾0.39, 6.48 ⫾1.51, and
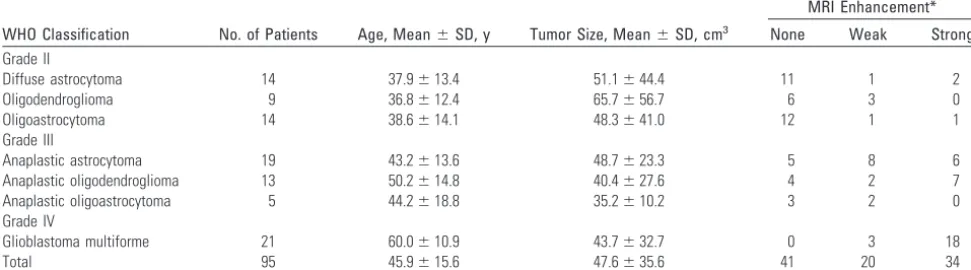
0.29⫾0.07, respectively. In ATs, MET T/N ratios of diffuse astrocytoma (DA), anaplastic astrocytoma (AA), and glioblas-toma multiforme (GBM) were 2.24⫾0.90, 3.03⫾1.02, and 5.03⫾1.65, respectively. There was a significant difference between these ratios among the different grades of ATs (DA/ GBM:P⬍.001; AA/GBM:P⬍.001). In OTs and OAs, MET T/N ratios of OD, anaplastic oligodendroglioma (AOD), oli-goastrocytoma (OA), and anaplastic olioli-goastrocytoma (AOA) were 3.95⫾1.60, 4.46⫾1.55, 2.60⫾0.91, and 2.83⫾0.99, respectively. There were no significant differences between the ratios of OD and AOD or between those of OA and AOA (Fig 1).
In ATs, FDG T/N ratios of DA, AA, and GBM were 0.79⫾ 0.08, 1.27⫾0.46, and 1.88⫾0.78, respectively. Significant differences were present between the different grades of ATs (DA/GBM:P⬍.001; AA/GBM:P⬍.05). However, no signif-icant differences were seen between FDG T/N ratio of OTs and that of OATs (OD: 1.03⫾0.40; AOD: 1.71⫾1.09; OA: 1.00⫾ 0.45; AOA: 0.85⫾0.15; Fig 1).
In ATs, CHO T/N ratios of DA, AA, and GBM were 2.69⫾ 2.04, 4.76⫾3.04, and 18.35⫾6.73, respectively. Significant differences were present between the different grades of ATs (DA/GBM:P⬍.001; AA/GBM: P⬍.001). In OTs, signifi-cantly different CHO T/N ratios were observed between OD and AOD (3.46⫾2.52 and 12.71⫾12.21, respectively;P⬍
.05). In OAs, CHO T/N ratios of OA and AOA were not sig-nificantly different (3.78⫾3.36 and 3.02⫾1.74, respectively; Fig 1).
In grade II gliomas, the MET T/N ratio of OD was the highest, and there was a significant difference between the DA and OD (P⬍.05); however, no significant differences were seen on FDG or CHO PET between these 2 tumors. In grade III gliomas, MET and CHO T/N ratios of AOD were the highest, and significant differences were shown between AA and AOD (MET:P⬍.05; CHO:P⬍.01) and between AOA and AOD (CHO:P⬍.05). However, a significant difference was not observed on FDG PET (Table 2 and Fig 1). Representative cases are shown in Fig 2.
Tumor size did not reach statistical significance in each glioma. Tumor size did not appear to affect each tracer uptake by ANCOVAs. Grade influenced all of the tracers, and tumor type influenced MET uptake only. The degree of Gd-DTPA enhancement influenced MET and CHO uptake (Table 3). Fig 1.Graph showing the correlation between tracer uptake and tumor grade. *P⬍.05,
†P⬍.01, ‡P⬍.001.
Table 2: T/N ratio in gliomas
Tumor
Grade II, Mean⫾SD
Grade III, Mean⫾SD
Grade IV, Mean⫾SD Astrocytic tumor,n 14 19 21
MET 2.24⫾0.90 3.03⫾1.02 5.03⫾1.65 FDG 0.79⫾0.08 1.27⫾0.46 1.88⫾0.78 CHO 2.69⫾2.04 4.76⫾3.04 18.35⫾6.73 Oligodendroglial tumor 9 13
MET 3.95⫾1.60 4.46⫾1.55 FDG 1.03⫾0.40 1.71⫾1.09 CHO 3.46⫾2.52 12.71⫾12.21 Oligoastrocytic tumor 14 5
MET 2.60⫾0.91 2.83⫾0.99 FDG 1.00⫾0.45 0.85⫾0.15 CHO 3.78⫾3.36 3.02⫾1.74
Note:—T/N ratio indicates tumor/normal brain uptake ratio; MET,11
[image:3.594.55.287.44.485.2] [image:3.594.301.533.58.202.2]Visual Evaluation for Tumor Localization
The T/N ratio of MET was more than 2.0 in 75.7% of grade II, 91.9% of grade III, 100% of grade IV, and 87.4% of all of the gliomas. The T/N ratio of CHO was more than 2.0 in 48.6% of grade II, 78.4% of grade III, 100% of grade IV, and 71.6% of all of the gliomas. The T/N ratio of FDG was more than 2.0 in 2.7% of grade II, 16.2% of grade III, 28.6% of grade IV, and 13.7% of all gliomas (Table 4). In all of the gliomas, the per-centage of hot lesions was the highest on MET PET, and there were significant differences in the percentage of hot lesions among 3 tracers (MET/FDG and CHO/FDG:P⬍.001; MET/ CHO:P⬍.01).
Correlation Among 3 Tracer Accumulations
In all of the gliomas, significant correlations among the T/N ratios of MET, FDG, and CHO were shown (Fig 3). Signif-icant correlations were also shown between ATs and OTs (ATs: MET/FDG:r ⫽0.68, MET/CHO: r ⫽ 0.83, FDG/ CHO:r⫽0.67; OTs: MET/FDG:r⫽0.66, MET/CHO:r⫽
0.81, FDG/CHO:r⫽0.81;P⬍.001 for each). In OATs, significant correlations were observed between FDG and CHO (r⫽0.67;P⬍.005) and between MET and FDG (r⫽
0.58;P⬍.01) but not between MET and CHO (r⫽0.40;
P⫽.09).
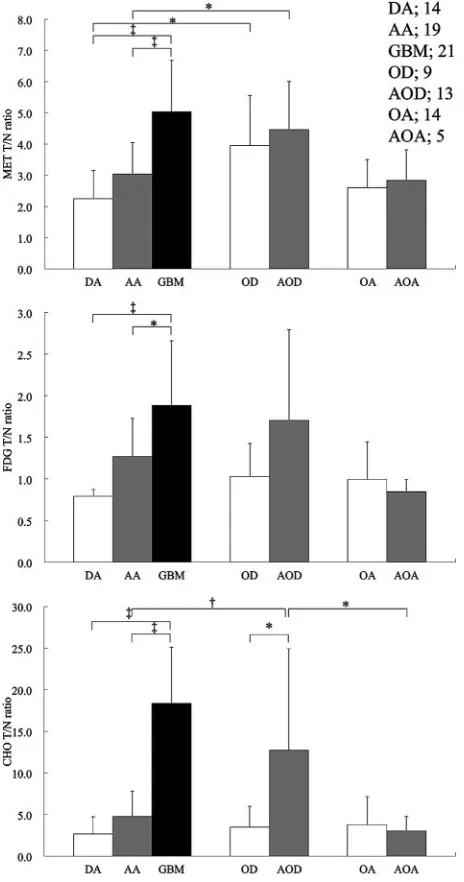
[image:4.594.56.535.43.402.2]Fig 2.Left top, Contrast-enhanced, T1-weighted image.Right top, MET PET is superimposed on MR imaging.Left bottom, CHO PET is superimposed on MR imaging.Right bottom, FDG PET is superimposed on MR imaging.A,A 32-year-old woman presented with diffuse astrocytoma. MET T/N ratio⫽1.72, CHO T/N ratio⫽1.38, and FDG T/N ratio⫽0.66.B, A 23-year-old woman presented with oligoastrocytoma. MET T/N ratio⫽2.76, CHO T/N ratio⫽1.82, and FDG T/N ratio⫽0.92.C, A 44-year-old man presented with oligodendroglioma. MET T/N ratio⫽3.71, CHO T/N ratio⫽2.74, and FDG T/N ratio⫽1.07.D, A 62-year-old woman presented with anaplastic astrocytoma. MET T/N ratio⫽4.26, CHO T/N ratio⫽10.17, and FDG T/N ratio⫽1.24.E, A 68-year-old man presented with glioblastoma multiforme. MET T/N ratio⫽6.85, CHO T/N ratio⫽33.38, and FDG T/N ratio⫽2.55.
Table 3: Summary statistics of ANCOVAs
Variable
MET, P
FDG, P
CHO, P
Size .07 .39 .19
Grade ⬍.005 ⬍.005 ⬍.001
Type ⬍.05 .33 .12
Gd-DTPA enhancement ⬍.05 .30 ⬍.01
Note:—MET indicates11C-methionine; FDG, [18F] fluorodeoxyglucose; CHO,11C-choline;
Gd-DTPA, gadopentetate dimeglumine.
Table 4: Percentage of T/N ratio more than 2.0 in gliomas
Variable
Grade II (37),n(%)
Grade III (37),n(%)
Grade IV (21),n(%)
Overall (95),n(%)* MET 28 (75.7) 34 (91.9) 21 (100.0) 83 (87.4) FDG 1 (2.7) 6 (16.2) 6 (28.6) 13 (13.7) CHO 18 (48.6) 29 (78.4) 21 (100.0) 68 (71.6)
Note:—T/N ratio indicates tumor/normal brain uptake ratio; MET,11C-methionine; FDG,
[18
F] fluorodeoxyglucose; CHO,11
C-choline.
* There were significant differences in the percentage of T/N ratio more than 2.0 among 3 tracers by usingX2
[image:4.594.52.286.484.554.2] [image:4.594.300.533.489.545.2]Correlation between Tracer Accumulation and Proliferation Activity
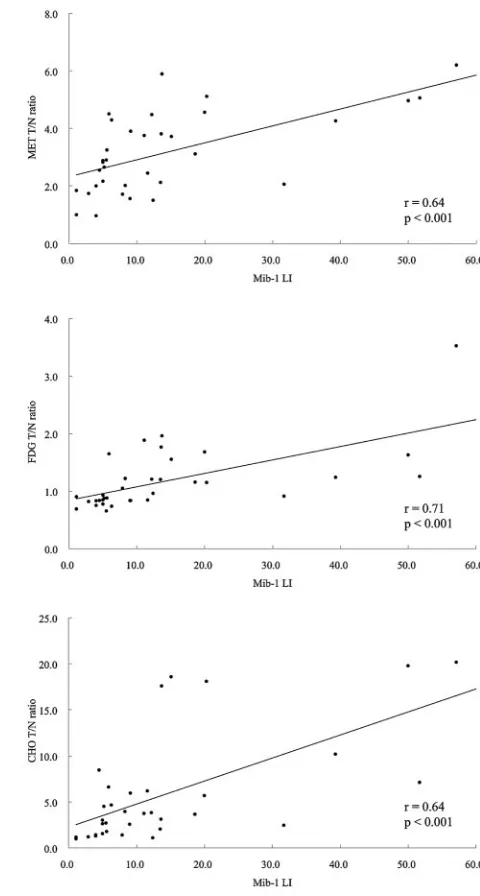
We evaluated the proliferation activity measured by Mib-1 LI from 70 gliomas. The relationship between tracer uptake and proliferation activity is shown in Table 5. The mean Mib-1 LIs of 13 DAs, 14 AAs, 7 GBMs, 8 ODs, 9 AODs, 14 OAs, and 5 AOAs were 4.6%⫾2.1%, 14.8%⫾9.9%, 31.6%⫾20.2%, 5.5%⫾4.5%, 17.5%⫾16.6%, 7.9%⫾5.7%, and 16.1%⫾ 11.1%, respectively. In ATs, there were significant correlations between the T/N ratios of each tracer and the Mib-1 LI (P⬍
.001 for each; Fig 4). However, for OTs and OATs, a significant correlation was not shown in all of the tracers.
Discussion
[image:5.594.290.530.40.488.2]To our knowledge, this is the first clinical study to evaluate the grade, type, and proliferation index of a series of gliomas while simultaneously assessing tumor presence by using 3 PET trac-ers. Previously, Kim et al6reported that significant differences Table 5: Correlation between tracer uptake and proliferation index
Variable Tumor
Mib-1 LI
P r
MET Astrocytic tumor ⬍.001 0.64 Oligodendroglial tumor .63 ⫺0.13 Oligoastrocytic tumor .84 0.05 All tumor ⬍.01 0.31 FDG Astrocytic tumor ⬍.001 0.71 Oligodendroglial tumor .27 0.29 Oligoastrocytic tumor .78 ⫺0.07 All tumor ⬍.001 0.42 CHO Astrocytic tumor ⬍.001 0.64 Oligodendroglial tumor .67 0.11 Oligoastrocytic tumor .44 0.19 All tumor ⬍.001 0.42
Note:—Proliferation index was measured by Mib-1 labeling index; MET indicates11
C-methionine; FDG, [18F] fluorodeoxyglucose; CHO,11C-choline; LI, labeling index.Pandr
values were calculated by using Spearman correlation coefficients.
Fig 3.Graph showing the correlation between MET T/N ratio and FDG T/N ratio (r⫽0.67;
P⬍.001), CHO T/N ratio and FDG T/N ratio (r⫽0.73;P⬍.001), and MET T/N ratio and CHO T/N ratio (r⫽0.75;P⬍.001) in all of the gliomas.
Fig 4.Graph showing the correlation between Mib-1 LI and MET T/N ratio (r⫽0.64;P⬍
[image:5.594.54.285.49.491.2] [image:5.594.52.285.558.705.2]in glioma grades could be shown on MET PET, not on FDG PET, and that Mib-1 LI was significantly correlated with only MET uptake. Other reports have shown significant correlation between glioma grade and FDG uptake.1,4,7,8In our series, in the case of ATs, all of the tracers demonstrated significant positive correlations between their uptake on PET imaging and tumor grade. In addition, all 3 of the tracers demonstrated significantly positive correlations between their uptake and biologic proliferation activity as determined by Mib-1 LI. However, in neither OTs nor OATs did the uptake on PET imaging show any significant relation to grade and prolifera-tion activity, excluding the correlaprolifera-tion between CHO uptake and tumor grade in OTs. The T/N ratios of MET, FDG, and CHO were significantly correlated to each other in all of the gliomas except for MET and CHO in OATs. On MET PET, there was a significant difference between ATs and OTs, both in grade II and III tumors. Additionally, by ANCOVA, MET influenced both grade and type. These results show that MET has the potential to evaluate tumor grade and type and, for ATs, biologic proliferation activity.
MET and CHO are tracers that are relatively easy to use for evaluating the presence or absence of tumor on PET images compared with FDG.22A T/N ratio more than 2.0 means that the tumor SUV is clearly higher than that of the normal frontal cortex; therefore, the tumor is more easily visualized when the T/N ratio increases beyond 2.0. The T/N ratio of FDG was more than 2.0 in 13.7% of all gliomas. Conversely, the percent-ages of MET and CHO T/N ratios greater than 2.0 were 87.4% and 71.6%, respectively, in all of the gliomas, and the percent-age of MET hot lesions was significantly higher than that of CHO hot lesions. These results demonstrate the significant difficulty in evaluating tumor presence on FDG PET com-pared with MET and CHO PET. The mean SUVs of MET and CHO in the normal frontal cortex were 1.25⫾0.39 and 0.29⫾ 0.07, respectively, in this study. Thus, the accumulation of CHO in normal brain was much lower than that of MET. However, CHO demonstrates extremely high uptake in cho-roid plexus, venous sinuses, and the pituitary gland, and it is difficult to recognize the existence and/or the border of brain tumor around these structures. Conversely, except for the pi-tuitary gland, MET demonstrates slight uptake in normal brain tissue. Given these results, MET appears to be superior to CHO for evaluating tumor presence on PET.
Utriainen et al16investigated the association between cho-line accumulation and content by using 2 modalities. The as-sociation between CHO uptake measured with PET, and con-centration of choline containing component measured with 1H-MR spectroscopy was not statistically significant. They
de-scribed that it is uncertain whether the association should be expected, because the choline-containing component mea-sured with1H-MR spectroscopy represents intracellular me-tabolite pools of phosphocholine and glycerophosphocholine, whereas the rate of CHO uptake is thought to be controlled by amino acid transporter expression and attenuation in tumor endothelial cells. It is possible that there was a lack of signifi-cance in this study due to small sample size; thus, large studies using1H-MR spectroscopy and CHO PET will be necessary in the future.
Generally, OTs are reported to show significantly higher uptake of MET on PET compared with ATs. This study
dem-onstrated results similar to previous reports.4,23It should be noted that the OT component can increase MET uptake of gliomas at the time of PET examination. The mean Mib-1 LI of OTs and OATs showed a general trend toward a higher pro-liferation index than that of ATs, even for tumors of the same grade. This finding, however, is not necessarily the only reason why the OT component leads to increased MET uptake on PET. There was no significant difference between the mean T/N ratios of tumors on MET PET between grade II and III OTs and OATs, unlike ATs, yet there was a significant differ-ence of the mean Mib-1 LI between grades II and III OTs and OATs, similar to results seen in ATs.
Regarding the difference of MET uptake between ATs and OTs/OATs, vascular proliferation and angiogenesis of the tu-mor should be taken into consideration. The main mechanism of MET uptake is due to an increase of MET transport into the tumor. In gliomas, MET uptake may be attributed to the acti-vation of the carrier-mediated transport system at the normal blood-brain barrier. This uptake does not directly reflect pro-tein synthesis, but it represents cell avidity for amino acids.2,24 This system may correlate with tissue proliferation, which also includes tumor angiogenesis. Plate et al25reported that tu-mors can influence the growth of their vasculature and, there-fore, can regulate their increased nutrient supply, including amino acids. It has been demonstrated that expression of an-giogenesis signals is an early event in glioma progression, as demonstrated by the expression of vascular endothelial growth factor (VEGF) and VEGF type 1 receptors in low-grade gliomas.25-27 The angiogenic process initiated by the VEGF system induces an increase in carrier-mediated large amino acid transport, and the VEGF system represents the link be-tween increased MET uptake and low-grade tumor progres-sion.5In this study, the MET uptake ratio of OTs was signifi-cantly higher than the ratio of ATs of the same grade. This finding may be correlated with the microvessel attenuation of the tumor. As measured by immunostaining with factor VIII, OTs demonstrate high microvessel counts and high MET up-take comparable with malignant astrocytomas.28This may be one of the reasons why MET uptake of OTs is higher than that of ATs, regardless of grade.
Other authors have reported MET T/N ratio of GBMs as ranging from 2.2 to 2.5, whereas a mean SUV of normal cortex was 1.05⫾0.46.4-6,29,30Hara et al31reported that the CHO T/N ratio of 7 cases of GBM was 11.2⫾2.28, and mean SUV of normal posterior temporal cortex was 0.10⫾0.02. In this article, both T/N ratios of the tumors and mean SUVs of nor-mal cortex were higher than those of previous reports, most probably due to protocol differences.
post-surgical adjuvant chemoradiotherapy in therapeutic strategies for glioma.
Conclusions
MET PET appears to be useful in evaluating grade, type, and proliferative activity of ATs. CHO PET may be useful in eval-uating the potential malignancy of OTs. In terms of visual evaluation of tumor localization, MET PET is superior to FDG and CHO PET in all of the gliomas due to its straightforward detection of hot lesions. These PET studies can potentially estimate tumor viability and may be able to predict tumors with the potential for malignancy. Future studies ought to investigate the metabolic change in long-term follow-up.
Acknowledgments
We thank Prof T. Hori and Prof O. Kubo (Department of Neurosurgery, Neurologic Institute, Tokyo Women’s Medical University, Tokyo, Japan) for academic support. We thank S. Fukuyama, Y Kasuya, R. Okumura, and Y. Tanaka (Kizawa Memorial Hospital, Minokamo City, Gifu, Japan) for techni-cal support. We thank A. Mori for PET tracer production (methyl iodide synthesis and methionine module, Sumitomo Heavy Industries, Ltd, Tokyo, Japan).
References
1. Delbeke D, Meyerowitz C, Lapidus RL, et al.Optimal cutoff levels of F-18 fluorodeoxyglucose uptake in the differentiation of low-grade from high-grade brain tumors with PET.Radiology1995;195:47–52
2. Derlon JM, Bourdet C, Bustany P, et al.[11c]l-Methionine uptake in gliomas.
Neurosurgery1989;25:720 –28
3. Herholz K, Holzer T, Bauer B, et al.11c-Methionine pet for differential diag-nosis of low-grade gliomas.Neurology1998;50:1316 –22
4. Kaschten B, Stevenaert A, Sadzot B, et al.Preoperative evaluation of 54 gliomas by PET with fluorine-18-fluorodeoxyglucose and/or carbon-11-methionine.
J Nucl Med1998;39:778 – 85
5. De Witte O, Goldberg I, Wikler D, et al.Positron emission tomography with injection of methionine as a prognostic factor in glioma.J Neurosurg
2001;95:746 –50
6. Kim S, Chung JK, Im SH, et al.11c-Methionine pet as a prognostic marker in patients with glioma: Comparison with 18f-FDG PET.Eur J Nucl Med Mol Imaging2005;32:52–59
7. Di Chiro G, DeLaPaz RL, Brooks RA, et al.Glucose utilization of cerebral gliomas measured by [18f] fluorodeoxyglucose and positron emission tomog-raphy.Neurology1982;32:1323–29
8. Ogawa T, Inugami A, Hatazawa J, et al.Clinical positron emission tomography for brain tumors: comparison of fludeoxyglucose f 18 and l-methyl-11c-me-thionine.AJNR Am J Neuroradiol1996;17:345–53
9. Tateishi U, Yamaguchi U, Seki K, et al.Glut-1 expression and enhanced glucose metabolism are associated with tumour grade in bone and soft tissue sarcomas: a prospective evaluation by [(18)f]fluorodeoxyglucose positron emission tomography.Eur J Nucl Med Mol Imaging2006;33:683–91 10. Buck A, Schirrmeister H, Kuhn T, et al.FDG uptake in breast cancer:
Correla-tion with biological and clinical prognostic parameters.Eur J Nucl Med Mol Imaging2002;29:1317–23
11. Avril N, Menzel M, Dose J, et al.Glucose metabolism of breast cancer assessed
by 18f-FDG PET: histologic and immunohistochemical tissue analysis.J Nucl Med2001;42:9 –16
12. Vesselle H, Schmidt RA, Pugsley JM, et al.Lung cancer proliferation correlates with [f-18]fluorodeoxyglucose uptake by positron emission tomography.
Clin Cancer Res2000;6:3837– 44
13. Tian M, Zhang H, Oriuchi N, et al.Comparison of 11c-choline PET and FDG PET for the differential diagnosis of malignant tumors.Eur J Nucl Med Mol Imaging2004;31:1064 –72
14. Ohtani T, Kurihara H, Ishiuchi S, et al.Brain tumour imaging with carbon-11 choline: comparison with FDG PET and gadolinium-enhanced MR imaging.
Eur J Nucl Med2001;28:1664 –70
15. Hara T, Kosaka N, Shinoura N, et al.PET imaging of brain tumor with [methyl-11c]choline.J Nucl Med1997;38:842– 47
16. Utriainen M, Komu M, Vuorinen V, et al.Evaluation of brain tumor metabo-lism with [11c]choline PET and 1H-MRS.J Neurooncol2003;62:329 –38 17. Schiffer D, Bosone I, Dutto A, et al.The prognostic role of vessel productive
changes and vessel density in oligodendroglioma. J Neurooncol
1999;44:99 –107
18. Schiffer D, Dutto A, Cavalla P, et al.Prognostic factors in oligodendroglioma.
Can J Neurol Sci1997;24:313–19
19. Cairncross JG, Ueki K, Zlatescu MC, et al.Specific genetic predictors of che-motherapeutic response and survival in patients with anaplastic oligodendro-gliomas.J Natl Cancer Inst1998;90:1473–79
20. Cairncross JG, Macdonald DR, Ramsay DA.Aggressive oligodendroglioma: a chemosensitive tumor.Neurosurgery1992;31:78 – 82
21. Kapouleas I, Alavi A, Alves WM, et al.Registration of three-dimensional MR and PET images of the human brain without markers. Radiology
1991;181:731–39
22. Narayanan TK, Said S, Mukherjee J, et al.A comparative study on the uptake and incorporation of radiolabeled methionine, choline and fluorodeoxyglu-cose in human astrocytoma.Mol Imaging Biol2002;4:147–56
23. Derlon JM, Petit-Taboue MC, Chapon F, et al.The in vivo metabolic pattern of low-grade brain gliomas: a positron emission tomographic study using 18f-fluorodeoxyglucose and 11c-l-methylmethionine.Neurosurgery1997;40:276 – 87; discussion 287–78
24. Bustany P, Chatel M, Derlon JM, et al.Brain tumor protein synthesis and histological grades: a study by positron emission tomography (PET) with c11-l-methionine.J Neurooncol1986;3:397– 404
25. Plate KH, Breier G, Risau W.Molecular mechanisms of developmental and tumor angiogenesis.Brain Pathol1994;4:207–18
26. Plate KH, Risau W.Angiogenesis in malignant gliomas.Glia1995;15:339 – 47 27. Theurillat JP, Hainfellner J, Maddalena A, et al.Early induction of angiogenetic signals in gliomas of gfap-v-src transgenic mice.Am J Pathol1999;154:581–90 28. Kracht LW, Friese M, Herholz K, et al.Methyl-[11c]- l-methionine uptake as measured by positron emission tomography correlates to microvessel density in patients with glioma.Eur J Nucl Med Mol Imaging2003;30:868 –73 29. Giammarile F, Cinotti LE, Jouvet A, et al.High and low grade
oligodendrogli-omas (ODG): correlation of amino-acid and glucose uptakes using PET and histological classifications.J Neurooncol2004;68:263–74
30. Nariai T, Tanaka Y, Wakimoto H, et al.Usefulness of l-[methyl-11c] methio-nine-positron emission tomography as a biological monitoring tool in the treatment of glioma.J Neurosurg2005;103:498 –507
31. Hara T, Kondo T, Hara T, et al.Use of 18f-choline and 11c-choline as contrast agents in positron emission tomography imaging-guided stereotactic biopsy sampling of gliomas.J Neurosurg2003;99:474 –79
32. Miwa K, Shinoda J, Yano H, et al.Discrepancy between lesion distributions on methionine PET and MR images in patients with glioblastoma multiforme: Insight from a PET and MR fusion image study.J Neurol Neurosurg Psychiatry
2004;75:1457– 62
33. Levivier M, Massager N, Wikler D, et al.Use of stereotactic PET images in dosimetry planning of radiosurgery for brain tumors: clinical experience and proposed classification.J Nucl Med2004;45:1146 –54