ORIGINAL RESEARCH
In Vivo Demonstration of Neuroinflammatory
Molecule Expression in Brain Abscess with
Diffusion Tensor Imaging
R.K. Gupta K. Nath A. Prasad K.N. Prasad M. Husain R.K.S. Rathore N. Husain C. Srivastava P. Khetan R. Trivedi P.A. Narayana
BACKGROUND AND PURPOSE: Neuroinflammatory molecules, including tumor necrosis factor-␣, inter-leukin1-, lymphocyte function associated molecule-1, and intercellular cell adhesion molecule-1 contribute to the development of brain abscess. We hypothesized that the high fractional anisotropy (FA) in the brain abscess cavity reflects the upregulation of these neuroinflammatory molecules.
MATERIALS AND METHODS:Diffusion tensor imaging (DTI) was performed in 24 patients with brain abscess andStaphylococcus aureus–treated as well as nontreated Jurket cell lines (at 4 time points: 1, 24, 48, and 72 hours). Neuroinflammatory molecules were quantified from the brain abscess cavity aspirate of the patients as well as from the heat-killedS aureus–treated and nontreated cell lines and correlated with DTI measures.
RESULTS: The DTI-derived FA strongly correlated with the presence of neuroinflammatory molecules in the pus as well as inS aureus–treated cell lines; no such correlation was observed in nontreated cell lines.
CONCLUSIONS:These data indicate that neuroinflammatory molecules confer high diffusion anisot-ropy inside the brain abscess cavity. We propose that increased FA reflects upregulated inflammatory response in brain abscess.
D
espite significant advances in the diagnosis and treatment, brain abscess remains a potentially fatal central nervous system infection. Brain abscess develops in response to a pa-renchymal infection by bacteria, beginning as a localized area of cerebritis and evolving into a suppurative lesion sur-rounded by a well-vascularized fibrotic capsule. The leading etiologic agents of brain abscess are theStreptococcusspecies andStaphylococcus aureus, though a myriad of other organ-isms have also been implicated.1,2Animal models also impli-cate proinflammatory molecules such as tumor necrosis fac-tor-alpha (TNF-␣) and interleukin1-beta (IL1-) in the development of brain abscess.3These proinflammatory mol-ecules, in turn, induce various cell adhesion molecules (CAMs), including selectins, intercellular cell adhesion mole-cules (ICAM-1), vascular cell adhesion molecules, and plate-let-endothelial cell adhesion molecules. These CAMs facilitate the extravasation of peripheral immune cells, perpetuating the antibacterial immune response that is thought to contribute,at least in part, to the development of brain abscess.4,5 Consis-tent with this mechanistic model, analysis of various neuroin-flammatory molecules (NMs) shows an initial marked en-hancement, persistence, and subsequent depletion with time in animal models of brain abscess.5-8Some of these findings have been reproduced in human brain cells, for example, TNF-␣andIL1-induceICAM-1expression in human brain endothelial cells.6-8
Diffusion tensor imaging (DTI) is a relatively new MR im-aging technique that has been shown to provide tissue micro-structural information.9 The commonly used DTI-derived metrics are fractional anisotropy (FA) and mean diffusivity (MD). Organized structures such as white matter tracts are characterized by high FA values. However, recently high FA in the brain abscess cavity has been reported.10We hypothesized that the high FA in the brain abscess cavity reflects the upregu-lation of various adhesion molecules on inflammatory cells, which confers the structured orientation of these cells in the abscess cavity. In the current study, for the first time, we dem-onstrate a correlation between FA, as measured by in vivo DTI, and various NMs in the brain abscess cavity aspirate from 24 patients. We have also confirmed these observations through ex vivo assays, in which we have induced NMs in Jurket cell lines by exposing them to heat-killedS aureus. The results of these studies may have significant clinical implications and could provide a noninvasive way of detecting active inflamma-tion in vivo.
Methods
Study Design
Twenty-four patients with brain abscess (16 males and 8 females; median age, 28 years; range, 1–50 years) were consecutively studied. MR imaging, including DTI, was performed on all these patients. Institutional ethics approval and informed consent from all the pa-tients or their nearest kin were obtained. Papa-tients with an initial diag-Received May 4, 2007; accepted after revision August 9.
From the Departments of Radiodiagnosis (R.K.G., K.N., R.T.) and Microbiology (A.P., K.N.P.), Sanjay Gandhi Post Graduate Institute of Medical Sciences, Lucknow, UP, India; Depart-ments of Neurosurgery (M.H., C.S., P.K.) and Pathology (N.H.), King George’s Medical University, Lucknow, UP, India; Department of Mathematics and Statistics (R.K.S.R.), Indian Institute of Technology, Kanpur, UP, India; and Department of Diagnostic and Interventional Imaging (P.A.N.), University of Texas Medical School at Houston, Houston, Tex.
This work was supported by the Indian Council of Medical Research (Grant No. 5/4 –5/ 12/Neuro/2005-NCD-I) and Life Sciences Research Board-Defence Research and Develop-ment Organization (DLS/81/48222/LSRB-129/ID/2007), New Delhi, India. Kavindra Nath, Amit Prasad, and Richa Trivedi acknowledge the financial assistance from the Indian Council of Medical Research, University Grants Commission, and Council of Scientific and Industrial Research, New Delhi, India, respectively.
Paper previously presented in part at: Fourteenth Scientific Meeting of International Society for Magnetic Resonance in Medicine, May 6 –12, 2006; Seattle, Wash.
Please address correspondence to Rakesh K. Gupta, MD, MR Section, Department of Radiodiagnosis, Sanjay Gandhi Post Graduate Institute of Medical Sciences, Lucknow, UP, India-226014; e-mail: [email protected]
Indicates article with supplemental on-line tables
nosis of brain abscess, based on conventional MR imaging, including diffusion imaging as well as in vivo proton MR spectroscopy, were selected. The diagnosis of brain abscess was finally confirmed at sur-gery and by the results of the culture of the aspirated pus.
The following predisposing factors were recognized in 13 patients: otitis media (n⫽8), dental caries (n⫽2), congenital heart disease (n⫽1), postmeningitis (n⫽1), and postoperative infection (n⫽1). In the remaining 11 patients, the cause of infection could not be ascertained. Sonography-guided aspiration of the pus was performed in all the patients. Following aspiration, part of the pus was inoculated in BACTEC Plus Aerobic and Anaerobic media (Becton, Dickinson and Company, Sparks, Md), and the remainder was preserved at ⫺70°C for the quantitation of various NMs.
Culture of Pus
Immediately after aspiration from the abscess cavity, pus was inocu-lated into BACTEC aerobic and anaerobic culture bottles and incu-bated at 37°C, and growth was monitored every day for 5 days. Media with positive growth were subcultured on appropriate solid media. Aerobic incubation was carried out at 37°C for 24 hours, and anaer-obic incubation was carried out in jars filled with the gas mixture of nitrogen (80%–90%), carbon dioxide (CO2) (5%–10%), and hydro-gen (5%–10%) through an anoxomat system (Mart BV Microbiol-ogy, Lichtenvoorde, Holland). All the isolates were identified by stan-dard biochemical tests as described previously.11 The causative microorganisms confirmed after culture were aerobicStreptococcisp. (n⫽6),S aureus(n⫽5),Streptococcus uberis(n⫽3),Bacteroidessp.
(n⫽2),Nocardiaspecies (n⫽2),Pseudomonas aeruginosa(n⫽1), and sterile (n⫽2) and mixed microbes (aerobic and anaerobic) (n⫽
3).
Cell Line
The Jurket cell line (clone E6 –1), a T-cell line (lymphocytic origin) having a nonadherent property (floating in nature), was subjected to ex vivo studies to validate our in vivo results. It was cultured in Ros-well Park Memorial Institute-1640 medium supplemented with 10% fetal calf serum, 2.0-mmol/L L-glutamine, 1.5-g/L sodium bicarbon-ate, 4.5-g/L glucose, 10-mmol/L HEPES (Sigma-Aldrich, St. Louis, Mo), and 1.0-mmol/L sodium pyruvate. The cells were grown in 24 (T-75) different flasks (12 experimental and 12 controls). Twelve flasks were treated with heat-killed (94.5°C for 10 minutes)S aureus
(ATCC 25923) and further incubated in a CO2incubator. The cell count ratio of heat-killedS aureusand Jurket cell lines was 1:100. MR imaging of heat-killedS aureus–treated as well as nontreated cell lines was performed at 4 time points: 1, 24, 48, and 72 hours. The photomi-crographs (⫻10) of heat-killedS aureus–treated as well as nontreated cell lines at each time point (1, 24, 48, and 72 hours) were taken using Eclipse (TE 2000-S, Nikon, Melville, NY).
MR Imaging Protocol in Patients
Conventional MR images and DTI images were acquired on a 1.5T MR imaging scanner (GE Healthcare, Milwaukee, Wis) by using a standard quadrature birdcage receive and transmit radio-frequency head coil. The conventional MR imaging protocol included T2-weighted fast spin-echo (SE) images with TR/TE/echo-train length/ NEX ⫽ 6000/85/16/4 and SE T1-weighted images with TR/TE/ NEX⫽1000/14/2. Both T1-weighted and T2-weighted images were acquired from contiguous (interleaved) 3-mm-thick axial sections with 240⫻240 mm FOV and an image matrix of 256⫻256. Post-contrast T1-weighted images were acquired after intravenous
injec-tion of gadopentate dimeglumine (Gd-DTPA-BMA, Omniscan; Am-ersham Health, Oslo, Norway) at a dose of 0.1 mmol/kg of body weight.
DTI data were acquired by using a single-shot echo-planar dual SE sequence with ramp sampling.12 A balanced13 rotationally invari-ant14,15dodecahedral diffusion-gradient encoding scheme with 10 uniformly distributed directions over the unit hemisphere was used. The b factor was 1000 s/mm2. The acquisition parameters were the following: section thickness of 3 mm with no gap, number of sec-tions⫽34 –38, FOV⫽240⫻240 mm, TR⫽8 sec, TE⫽100 ms, and NEX⫽8. The acquisition matrix was 128⫻80, and the homodyne algorithm was used to construct thek-space data to 128⫻128 and zero-filled to generate an image matrix of 256⫻256.
MR Imaging Protocol in Cell Lines
The DTI acquisition parameters were the following: b factor⫽1000 s/mm2, section thickness of 3 mm with no gap, number of sections⫽ 10, FOV⫽100⫻100 mm, TR⫽8 sec, TE⫽100 ms, and NEX⫽14. The acquisition matrix of 128⫻128 followed by zero-filling to gen-erate an image matrix of 256⫻256 was used. For DTI at each time point (1, 24, 48, and 72 hours), the cells were pooled from 3 flasks and harvested by centrifugation. A total of 4⫻107cells were taken at each time point for experimentation. To provide better signal intensity-to-noise ratio, we added 0.5% gadodiamide (Gd-DTPA-BMA; Omni-scan, Amersham Health, Oslo, Norway) in phosphate buffer saline (PBS) to the cell line.16We imaged 0.5 mL of sample (including the cell line and Gd-DTPA-BMA in PBS) in a 0.5-mL microcentifuge tube at each time point. The microcentifuge tube was embedded in a big plastic container filled with 2% agarose gel and taken for DTI imag-ing. The total imaging time for the DTI experiment was 19.36 min-utes. From the same pool of cells, 1⫻106cells were snap frozen for molecular quantification, the same as the pus sample.
DTI Data Processing and Quantitation
The DTI data were processed as described elsewhere.13Briefly, follow-ing image croppfollow-ing and distortion corrections, the data were interpo-lated to attain isotropic voxels and decoded to obtain the tensor field for each voxel. The eigenvalues (1,2, and3) and the 3 orthonormal eigenvectors were determined. The eigenvalues were used to compute the FA for each voxel.
To calculate the FA in the brain abscess cavity, we performed an automated segmentation by using the in-house developed JAVA-based software. The facilitated region-of-interest encircling the whole lesion was drawn, and the lesion was automatically segmented into the 2 subregions with FA⬍0.20 and FAⱖ0.20. FA values obtained from the abscess cavity having FA⬎0.20 were used for the statistical correlation with NMs. This threshold was chosen because major white matter tracts are seen at the 0.2-FA cutoff in normal brain parenchyma.10For the region-of-interest placement for quantitative analysis, the DTI-derived maps were displayed and overlaid on im-ages with different contrasts in the 3 orthogonal planes for a visual inspection. FA values were calculated by placing the region of interest in the brain abscess cavity of all the sections showing the lesion.
The DTI data of nontreated as well as heat-killedS aureus–treated cell lines were processed and analyzed at each time point by using the same procedure as in patients except for the size of the regions of interest. The size of the region of interest was typically 2⫻2 pixels, with shape varying from elliptical to freehand drawing. For the FA quantitation at each time point, 4 – 6 sections in which the cell line was
BRAIN
ORIGINAL
best visualized were selected. In all the cases with brain abscess, FA values were calculated by selecting the cutoff value of 0.20.10
Ribonucleic Acid Isolation and Reverse Transcriptase-Polymerase Chain Reaction
The NMs quantified through reverse transcriptase-polymerase chain reaction (RT-PCR) from the pus of the brain abscess cavity of patients and cell lines were IL1-, lymphocyte function associ-ated molecule-1 (LFA-1), and TNF-␣and will be referred to as NMs in the remainder of the article. Total ribonucleic acid (RNA) was extracted from the pus collected during surgery as well as from the cell line at different time points (1, 24, 48, 72 hours) by using RNeasy Kit (Qiagen, Valencia, Calif) according to the manufactur-er’s instructions. Complementary deoxyribonucleic acid (cDNA) was synthesized by RevertAid H Minus First Strand cDNA Synthe-sis Kit (Fermantas LIFE SCIENCES, Glen Burnie, Md) taking 100 ng of RNA for each sample. After reverse transcription, primer specific amplification of LFA-1 (CD11a),IL1-, TNF-␣, and
glycer-aldehyde-3-phosphate dehydrogenase (GAPDH) (housekeeping gene) was performed for the following specific primers: LFA-1 sense (5⬘-GAGCTCTTTGAGAACACCTC-3⬘), LFA-1 antisense (5⬘ -TCA-CACTTCACTGTCACCTC-3⬘), TNF-␣ sense (5⬘ CAGAGGGAA-GAGTTCCCCAG-3⬘), TNF-␣antisense (5⬘ -CCTTGGTCTGGTAG-GAGACG-3⬘),IL1-sense (5⬘-AGATGAAGTGCTCCTTCCAG-3⬘),
IL1- antisense (5⬘-CAACACGCAGGACAGGTACAG⫺3⬘), and GAPDH sense (5⬘-GGTCGGAGTCAACGGATTTGGT-3⬘) and GAPDH antisense (5⬘-TGTGGGCC ATGAGGTCCACCAC-3⬘).
The size of products amplified by LFA-1, TNF-␣,IL1-, human solubleICAM-1(sICam-1), and GAPDH primer pairs were 367, 427, 325, and 924 base pairs, respectively, in an MJ Research Cycler, PTC 100 (Perkin Elmer, Waltham, Mass). Following were the PCR cycles for amplification–primary denaturation at 95°C for 3⬘, followed by 94°C for 1⬘, annealing (52–58°C for 1⬘) and extension at 72°C for 1⬘ for 35 cycles, followed by final extension at 72°C for 5⬘. Amplified PCR products from pus as well as cell lines were detected by 2% agarose gel electrophoresis with 0.5-g/mL ethidium bromide and photographed under ultraviolet illumination. Band intensities were quantified by densitometric scanning software, Image Ready Elite (Amersham Pharmacia Biotech, Uppsala, Sweden). To normalize messenger RNA levels, we scanned attenuation of LFA-1, TNF-␣,
IL1-, and GAPDH bands from the same samples, and data were
calculated as the ratios of band-intensity values of LFA-1, TNF-␣, and
IL1-relative to the band intensity of GAPDH.
Quantitation of sICAM-1
Human sICAM-1 in pus was quantitatively measured by human sI-CAM-1 enzyme-linked immunosorbent assay (ELISA) (Cat. No. BBE1B, R&D Systems, Minneapolis, Minn). ELISA was performed as per the guidelines of the manufacturer. In brief, standard series/pus/ cell culture supernatants were diluted 20 times in diluent buffer, and 100L of conjugate and sample was applied on each ELISA well. Incubated for 90 minutes, rigorously washed 6 times, 100L of sub-strate was added and again incubated for 30 minutes. Reaction was stopped by adding 100L of stop solution, and a reading was taken at 450 nm with wavelength correction at 620 nm (Sunrise ELISA Reader; Tecan, Salzburg, Austria). The amount of sICAM-1 in samples was determined by standard plot.
Statistical Analysis
Bivariate analysis of correlation was performed to study the relation-ship between the FA values in the brain abscess cavity and NMs ex-tracted from pus, with the assumption that there was no correlation between DTI measures and NMs (Ho [null hypothesis]⫽0). Alter-natively, if a correlation⬎0.00 was observed at␣⫽0.05% and 90% power of test, the null hypothesis was rejected. The relationship be-tween FA values in cell lines (heat-killedS aureus–treated and non-treated) and the NMs was also analyzed by using the same approach. The Pearson correlation coefficient was computed for each variable under study, with mean FA, MD, and NMs in both in vivo and ex vivo studies. Sample size estimation was performed by using Power and Sample Size (PASS 6.0; Dynalab Test Systems, Reynoldsburg, Ohio), and other statistical computations were performed by using the Sta-tistical Package for Social Sciences, Version 12.0 (SPSS, Chicago, Ill) statistical software.
Results
Brain abscesses were located in the frontal lobe (n⫽1), pari-etal lobe (n⫽6), temporal lobe (n⫽2), occipital lobe (n⫽2), frontoparietal region (n⫽3), temporoparietal region (n⫽1), temporo-occipital region (n ⫽ 2), parieto-occipital region (n⫽2), and cerebellum (n⫽5). The brain abscess appeared hyperintense on T2-weighted images with a peripheral
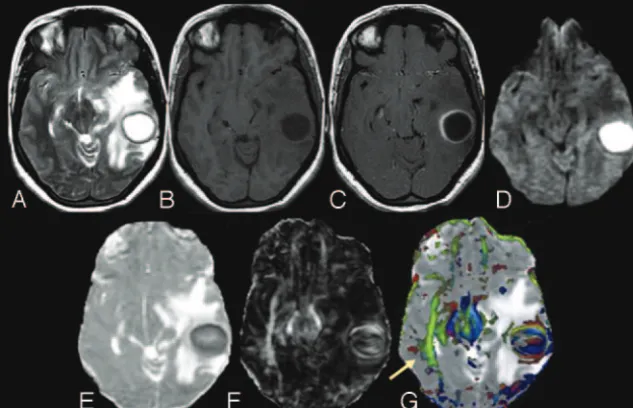
[image:3.594.54.371.44.248.2]pointense rim (Fig 1A) and iso- to hypointense on T1-weighted images (Fig 1B). On postcontrast T1-weighted im-ages, brain abscess showed rim enhancement (Fig 1C). On diffusion-weighted images (DWI), we observed 2 types of sig-nal-intensity distribution: 1) homogeneously hyperintense, when the signal intensity of the lesion was homogeneously high in the abscess cavity (Fig 1); and 2) heterogeneously hy-perintense, when the lesion contained both high and low sig-nal intensities intermixed in variable proportions in the ab-scess cavity (Fig 2). Among the 24 patients with brain abab-scess, 10 brain abscesses appeared homogeneously hyperintense and the remaining 14 were heterogeneously hyperintense on DWI images.
The mean FA and MD values in the subregion of the brain abscess cavity having FA⬎0.20 were 0.25⫾0.07 and (0.74⫾ 0.23) ⫻ 10⫺3 mm2/s, respectively. In subregions having
FA⬍0.20, mean FA and MD values were 0.12⫾0.04 and (0.64
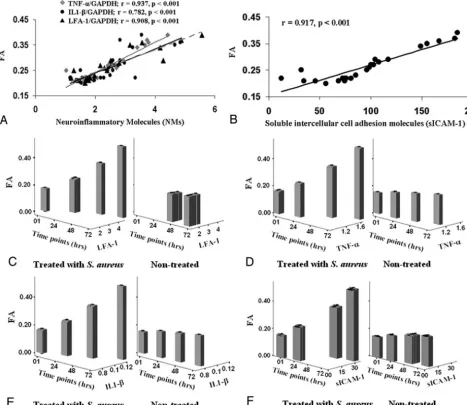
⫾0.18)⫻10⫺3mm2/s, respectively. The mean band-intensity ratios of NMs quantified through RT-PCR from the pus of brain abscess cavities of patients were the following:IL1-/ GAPDH, LFA-1/GAPDH, and TNF-␣/GAPDH ⫽ 2.52 ⫾ 0.96, 2.48⫾1.19, and 2.37⫾0.92, respectively. The sICAM-1 quantified through ELISA was 94.97⫾46.38. Significant pos-itive correlations between FA and NMs (Fig 3A, -B) and among NMs were found.
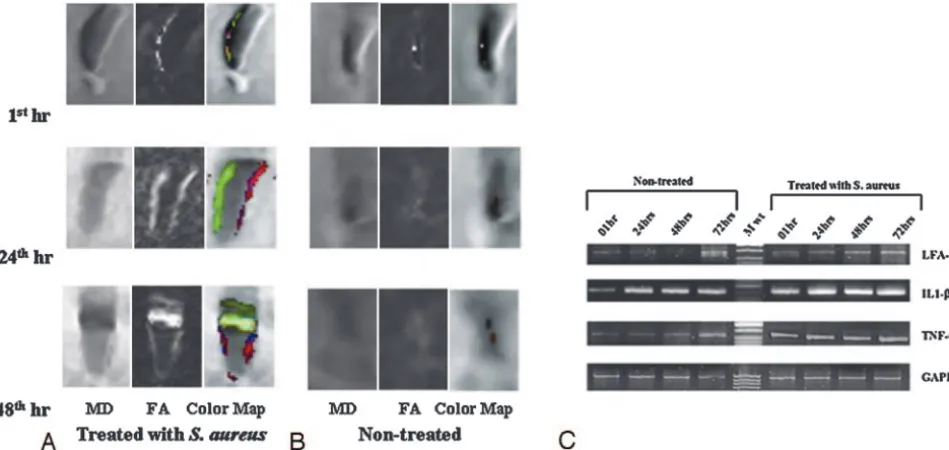
FA values of nontreated as well as heat-killedS aureus– treated cell lines at different time points (1, 24, 48, 72 hours) are summarized in supplemental on-line Table 1. The FA value was significantly higher in the heat-killed S aureus– treated cell line at 24, 48 and 72 hours (Fig 4A), compared with the nontreated cell line of same group (Fig 4B). The band-intensity ratios of IL1-/GAPDH, LFA-1/GAPDH, TNF-␣/ GAPDH, and sICAM-1 in heat-killedS aureus–treated as well as nontreated cell lines are summarized in supplemental on-line Table 1. LFA-1 did not show quantifiable expression in nontreated cell lines at 1 and 24 hours (Fig 4C).
Significant positive correlations between FA and NMs and among NMs were found at each time point in the heat-killedS aureus–treated cell lines except in case of sICAM-1 at 1 hour (supplemental on-line Table 2) (Fig 3C–F). In nontreated cell
lines, significant positive correlation was found between FA, IL1-/GAPDH,and TNF-␣/GAPDH at 1 hour only. Among NMs, significant positive correlation was found between IL1-/GAPDH and TNF-␣/GAPDH at 0, 48, and 72 hours.
On photomicrographs (Fig 5), an increased degree of cell aggregation in the heat-killedS aureus–treated cell line was observed subsequently with time compared with the non-treated cell line.
Discussion
Various cell adhesion molecules in the aggregation of inflam-matory cells have been postulated to be responsible for the high FA in the brain abscess cavity.10In this study, we have shown the possible mechanism of high FA in the brain abscess cavity through the in vivo and ex vivo studies. Significant pos-itive correlation between FA and various NMs quantified from aspirated brain abscess pus suggests the role of these NMs for increased FA inside the cavity. The in vivo observations were further confirmed by the ex vivo DTI of both nontreated andS aureus–treated Jurket cell lines incubated with heat-killedS aureus(ATCC 25923). The heat-killed S aureus–treated cell lines showed a pattern of results similar to those obtained in vivo in the brain abscess cavity and showed similar correlation with NMs. We preferred to use heat-killed rather than live bacteria to avoid the cytolytic effect.17It has been shown that the intact bacteria generate the same inflammatory response as the cell wall components (peptidoglycan and lipopolysaccha-ride) of the bacteria and independently activate the chemo-kines in human monocytes.18
There is growing evidence of increase in NM expression at the site of inflammation with in vivo as well as ex vivo stud-ies.19,20On blocking experiments with anti-ICAM-1 and anti-LFA-1 antibodies, authors have demonstrated leukocytic ag-gregation of inflammatory cells mediated via ICAM-1 and LFA-1 interaction.20We did not find any correlation between FA and NMs in the nontreated cell lines(Fig 2C–F),except for significant positive correlation at 1 hour between FA,IL1-/ GAPDH, and TNF-␣/GAPDH; however significant positive correlation between FA and NMs in the heat-killedS aureus– treated cell lines at each time point was observed. Our
[image:4.594.54.371.43.256.2]vation of NMs expression in the nontreated cell lines at 1 hour is consistent with a previous study demonstrating baseline ex-pression of NMs in controls at 40 minutes.18FA values and NM expression at 1 hour can be considered as baseline values because no significant change in FA values and expression of NMs was observed in the nontreated cell lines subsequently with time. Significant positive correlation between FA and NMs at each time point in the heat-killedS aureus–treated cell lines suggests that these NMs are upregulated in response to the infection and further confirms the mechanism behind in-creased FA in brain abscess cavity.
In both ex vivo and in vivo studies, no correlation between MD values and NMs was observed. Brain abscess is usually associated with high signal intensity on DWI with reduced MD values.21The viable inflammatory cells and bacteria have been thought to be responsible for restricted diffusion in brain abscess.22MD values reflect change in cell attenuation and extracellular space.23In nontreated cell lines, no significant changes in MD values were observed with time because of the insignificant change in the number of cells taken for imaging at each time point. However, the heat-killedS aureus–treated
cell lines showed an increasing pattern of MD values with time with significant decrease in cells at each time point. This may be due to the increased proportion of dead cells relative to the viable cells with time, resulting in an increased extracellular space with a concomitant increase in MD. An association be-tween treatment response and increased MD values in the brain abscess cavity has been reported previously.24However, the current ex vivo studies suggest that increased FA with min-imal increase in MD with time are associated with increased NMs and may be a more specific and robust marker of inflam-matory response. In both ex vivo and in vivo studies, no cor-relation between FA and MD value was observed at any time point. Our observations are in line with the previous DTI study in patients with brain abscess, which showed a large variation in FA values with no significant changes in MD values.10
We observed high FA in the brain abscess cavity in 2 pa-tients who had no bacterial growth on pus culture (sterile). It suggests that remnants of bacterial cell walls are responsible for the continued release of NMs, even when the pus from the abscess cavity may not yield any bacterial growth on culture. It
[image:5.594.58.525.46.450.2]has been shown in a brain abscess animal model that the num-ber of inflammatory cells does not decrease significantly even if the abscesses show a marked decrease in bacterial colony count in culture with time.19This has been shown to be due to continuous release of proinflammatory cytokines and chemo-kines even after a decreased bacterial load. Continued release of NMs by activated glia and infiltrating peripheral immune cells may cause damage to surrounding brain parenchyma, which is responsible for long-term neurologic consequences, including seizures and cognitive deficits in patients with brain abscess.1The demonstration of the continued increase in FA in patients who are on therapy may suggest continued activity of the disease process and may require specific anti-inflamma-tory intervention to control this activity. This may reduce the posttreatment sequelae, like seizures and cognitive decline, in the future.
In other inflammatory pathologies such as multiple scle-rosis (MS) and meningitis, the role of various NMs has also been reported. The role ofICAM-1, -2, and LFA-1 in the
transendothelial migration of leukocytes into MS brain and the role ofICAM-3/LFA-1 interaction in the activation of lymphocytes, monocytes, and microglia in MS lesions have already been reported.25 Although the mechanism is un-known, it has been suggested that the NMs play a major role in the leukocyte aggregation in meningitis.26Significantly increased leukocyte aggregation score and expression of sI-CAM-1 and L-selectins have been reported in the CSF of pediatric patients with bacterial meningitis compared with patients with viral meningitis.27Serum procalcitonin and C-reactive proteins have been used as diagnostic markers of inflammation in sepsis.28These markers may also be raised in a variety of nonspecific inflammations. Detection of in-flammatory markers from CSF and serum in bacterial men-ingitis and MS is an indirect approach to seeing an inflam-matory response that may be responsible for contradictory conclusions.29-33In vivo detection of activity of NMs at the lesion site may help in more precise assessment of the
ac-Fig 4.A, Coronal images of MD, FA, and color-coded FA maps fused with MD of Jurket cell lines treated with heat-killedS aureusat 1, 24, and 48 hours (hr), respectively, show an increase in FA and MD.B, The corresponding maps for nontreated Jurket cells show very few changes in FA and MD.C, Expression of LFA-1,IL1-, TNF-␣, and GAPDH (housekeeping) genes in nontreated and heat-killedS aureus–treated Jurket cell lines at 1, 24, 48, and 72 hours.
[image:6.594.59.534.43.268.2] [image:6.594.135.454.314.474.2]tivity of the disease and thus may be helpful in clinical management of these patients.
Conclusion
Because FA shows a strong correlation with all NMs at the site of infection, we propose that increased FA in brain abscess reflects upregulation of various adhesion molecules on in-flammatory cells at the site of the local infective process.
Acknowledgment
We thank Dr. C. M. Pandey, Department of Biostatistics, San-jay Gandhi Post Graduate Institute of Medical Sciences, Luck-now, India, for his support in statistical analysis.
References
1. Mathisen GE, Johnson JP.Brain abscess.Clin Infect Dis1997;25:763–92 2. Townsend GC, Scheld WM.Infections of the central nervous system.Adv
In-ternal Med1998;43:403– 47
3. Kielian T. Immunopathogenesis of brain abscess. J Neuroinflammation 2004;17:1–16
4. Kielian T.Microglia and chemokines in infectious diseases of the nervous system: views and reviews.Front Biosci2004;9:732–50
5. Kielian T, Bearden ED, Baldwin AC.IL-1 and TNF-alpha play a pivotal role in the host immune response in a mouse model of Staphylococcus aureus-in-duced experimental brain abscess.J Neuropathol Exp Neurol2004;63:381–96 6. Wong D, Dorovini-Zis K.Upregulation of intercellular adhesion molecule-1
(ICAM-1) expression in primary cultures of human brain microvessel endo-thelial cells by cytokines and lipopolysaccharide. J Neuroimmunol 1992;39:11–21
7. Vassalli P.The pathophysiology of tumor necrosis factors.Annu Rev Immunol 1992;10:411–528
8. Bevilacqua MP.Endothelial-leukocyte adhesion molecules.Annu Rev Immu-nol1993;11:767– 804
9. Mori S, Zhang J.Principles of diffusion tensor imaging and its application to basic neuroscience research.Neuron2006;51:527–39
10. Gupta RK, Hasan KM, Mishra AM, et al.High fractional anisotropy in brain abscesses versus other cystic intracranial lesions.AJNR Am J Neuroradiol 2005;26:1107–14
11. Prasad KN, Mishra AM, Gupta D, et al.Analysis of microbial etiology and mortality in patients with brain abscess.J Infect2006;53:221–27
12. Basser PJ.Inferring microstructural features and the physiological state of tissues from diffusion-weighted images.NMR Biomed1995;8:333– 44 13. Hasan KM, Parker DL, Alexander AL.Comparison of gradient encoding
schemes for diffusion-tensor MRI.J Magn Reson Imaging2001;13:769 – 80 14. Batchelor PG, Atkinson D, Hill DL, et al.Anisotropic noise propagation in
diffusion tensor MRI sampling schemes.Magn Reson Med2003;49:1143–51 15. Hasan KM, Narayana PA.Computation of the fractional anisotropy and mean
diffusivity maps without tensor decoding and diagonalization: theoretical analysis and validation.Magn Reson Med2003;50:589 –98
16. Zhang Z, van den Bos EJ, Wielopolski PA, et al.High-resolution magnetic resonance imaging of iron-labeled myoblasts using a standard 1.5-T clinical scanner.MAGMA2004;17:201– 09
17. Segura M, Stankova J, Gottschalk M.Heat-killed Streptococcus suis capsular type 2 strains stimulate tumor necrosis factor alpha and interleukin-6 pro-duction by murine macrophages.Infect Immun1999;67:4646 –54
18. Wang ZM, Liu C, Dziarski R.Chemokines are the main proinflammatory me-diators in human monocytes activated by Staphylococcus aureus, peptidogly-can, and endotoxin.J Biol Chem2000;275:20260 – 67
19. Baldwin AC, Kielian T.Persistent immune activation associated with a mouse model of Staphylococcus aureus-induced experimental brain abscess.J Neu-roimmunol2004;151:24 –32
20. Moese S, Selbach M, Meyer TF, et al.CagⴙHelicobacter pylori induces homo-typic aggregation of macrophage-like cells by up-regulation and recruitment of intracellular adhesion molecule 1 to the cell surface. Infect Immun 2002;70:4687–91
21. Mishra AM, Gupta RK, Jaggi RS, et al.Role of diffusion-weighted imaging and
in vivoproton magnetic resonance spectroscopy in the differential diagnosis of ring-enhancing intracranial cystic mass lesions.J Comput Assist Tomogr 2004;28:540 – 47
22. Mishra AM, Gupta RK, Saksena S, et al.Biological correlates of diffusivity in brain abscess.Magn Reson Med2005;54:878 – 85
23. Le Bihan D.Looking into the functional architecture of the brain with diffu-sion MRI.Nat Rev Neurosci2003;4:469 – 80
24. Cartes-Zumelzu FW, Stavrou I, Castillo M, et al.Diffusion-weighted imaging in the assessment of brain abscesses therapy.AJNR Am J Neuroradiol 2004;25:1310 –17
25. Bo L, Peterson JW, Mork S, et al.Distribution of immunoglobulin superfamily members ICAM-1, -2, -3, and the beta 2 integrin LFA-1 in multiple sclerosis lesions.J Neuropathol Exp Neurol1996;55:1060 –72
26. Garty BZ, Berliner S, Liberman E, et al.Cerebrospinal fluid leukocyte aggrega-tion in meningitis.Pediatr Infect Dis J1997;16:647–51
27. Uysal G, Tulek N, Ozhan B.Leukocyte aggregation score in meningitis and its relationship with cerebrospinal fluid soluble selectin and soluble ICAM-1 lev-els.J Trop Pediatr2000;46:381– 82
28. Castelli GP, Pognani C, Cita M, et al.Procalcitonin, C-reactive protein, white blood cells and SOFA score in ICU: diagnosis and monitoring of sepsis. Min-erva Anestesiol2006;72:69 – 80
29. Meisner M, Tschaikowsky K, Palmaers T, et al.Comparison of procalcitonin (PCT) and C-reactive protein (CRP) plasma concentrations at different SOFA scores during the course of sepsis and MODS.Crit Care1999;3:45–55 30. Ugarte H, Silva E, Mercan D, et al.Procalcitonin used as a marker of infection
in the intensive care unit.Crit Care Med1999;27:498 –504
31. Muller B, Becker KL, Schachinger H, et al.Calcitonin precursors are reliable markers of sepsis in a medical intensive care unit. Crit Care Med 2000;28:977– 83
32. Luzzani A, Polati E, Dorizzi R, et al.Comparison of procalcitonin and C-reac-tive protein as markers of sepsis.Crit care Med2003;31:1737– 41