Insulin resistance causes inflammation in
adipose tissue
Mitsugu Shimobayashi, … , Ralph Peterli, Michael N. Hall
J Clin Invest.
2018;128(4):1538-1550. https://doi.org/10.1172/JCI96139.
Obesity is a major risk factor for insulin resistance and type 2 diabetes. In adipose tissue,
obesity-mediated insulin resistance correlates with the accumulation of proinflammatory
macrophages and inflammation. However, the causal relationship of these events is
unclear. Here, we report that obesity-induced insulin resistance in mice precedes
macrophage accumulation and inflammation in adipose tissue. Using a mouse model that
combines genetically induced, adipose-specific insulin resistance (mTORC2-knockout) and
diet-induced obesity, we found that insulin resistance causes local accumulation of
proinflammatory macrophages. Mechanistically, insulin resistance in adipocytes results in
production of the chemokine monocyte chemoattractant protein 1 (MCP1), which recruits
monocytes and activates proinflammatory macrophages. Finally, insulin resistance (high
homeostatic model assessment of insulin resistance [HOMA-IR]) correlated with reduced
insulin/mTORC2 signaling and elevated MCP1 production in visceral adipose tissue from
obese human subjects. Our findings suggest that insulin resistance in adipose tissue leads
to inflammation rather than vice versa.
Research Article
Inflammation
Metabolism
Find the latest version:
Introduction
Obesity-induced insulin resistance is a major risk factor for type 2 diabetes, hyperlipidemia, cardiovascular disease, and some types of cancer (1–3). Although the mechanism by which obesity causes insulin resistance is unclear, inflammation has been linked to the development of local and systemic insulin resistance, especially when the inflammation occurs in white adipose tissue (WAT) (4, 5).
WAT consists of adipocytes and stromal vascular cells (SVCs) including endothelial cells, preadipocytes, and immune cells (6). Among the immune cells, macrophages play a particularly important role in obesity-induced adipose tissue inflammation. Macrophages are classified into 2 types: proinflammatory M1 and antiinflammatory M2 macrophages. M1 macrophages express the surface marker CD11c (7, 8) and produce proinflammatory cyto-kines such as TNF-α (9, 10). M2 macrophages express the surface marker CD301 and produce antiinflammatory cytokines such as IL-10 (7). The relative and absolute number of M1 macrophages increases in WAT upon obesity, thereby promoting adipose tissue inflammation (7–11). Studies in rodents have suggested that adi-pose tissue inflammation causes local and systemic insulin resis-tance (9, 11–13). However, it has been demonstrated that immu-nocompromised mice are not protected from systemic insulin resistance induced by a short-term high-fat diet (HFD) (14). Fur-thermore, Tian et al. have shown that adipose tissue inflammation is dispensable for local and systemic insulin resistance (15). Anoth-er study has shown that inhibition of adipose tissue inflamma-tion results in glucose intolerance, suggesting that inflammainflamma-tion
may even be a mechanism to counter insulin resistance (16). In humans, expression of the macrophage markers CD68 and TNF-α in WAT correlates with BMI, suggesting that obesity may induce the accumulation of adipose tissue macrophages and inflamma-tion in humans (9, 17). However, clinical trials targeting TNF-α have shown little or no beneficial effect on systemic insulin sensi-tivity (18–21). Thus, the causal relationship between adipose tissue inflammation and insulin resistance is unclear.
Two models have been proposed to explain the increase in the number of M1 macrophages in WAT upon obesity. The first is that circulating monocytes are recruited to WAT, where they dif-ferentiate into M1 macrophages (7, 22). The second is that obesity induces the proliferation of resident macrophages in WAT (23). The monocyte chemoattractant protein 1/C-C chemokine ligand 2 (MCP1/CCL2), presumably produced by adipocytes, is required to increase the number of macrophages in WAT (12, 23, 24). Howev-er, the mechanism(s) controlling MCP1 expression in adipocytes upon obesity are poorly understood.
The target of rapamycin complex 2 (TORC2) is an evolution-arily conserved serine/threonine protein kinase complex that con-trols growth and metabolism (reviewed in ref. 25). In mammals, mTORC2 consists of mTOR, rapamycin-insensitive companion of mTOR (RICTOR), mammalian stress-activated protein kinase– interacting protein 1 (mSIN1), and mammalian lethal with SEC thirteen 8 (mLST8) (26–31). Insulin stimulates mTORC2 to pro-mote glucose uptake in adipose tissue (32–34), liver (35–37), and skeletal muscle (38, 39). Previously, we and others have shown that adipose-specific Rictor knockout (AdRiKO) exacerbates obe-sity-related complications in mice, such as systemic insulin resis-tance and hepatic steatosis (32–34).
Here, we used mTORC2-deficient and therefore insulin-resis-tant AdRiKO mice to investigate the causal relationship between Obesity is a major risk factor for insulin resistance and type 2 diabetes. In adipose tissue, obesity-mediated insulin resistance
correlates with the accumulation of proinflammatory macrophages and inflammation. However, the causal relationship of these events is unclear. Here, we report that obesity-induced insulin resistance in mice precedes macrophage accumulation and inflammation in adipose tissue. Using a mouse model that combines genetically induced, adipose-specific insulin resistance (mTORC2-knockout) and diet-induced obesity, we found that insulin resistance causes local accumulation of proinflammatory macrophages. Mechanistically, insulin resistance in adipocytes results in production of the chemokine monocyte chemoattractant protein 1 (MCP1), which recruits monocytes and activates proinflammatory macrophages. Finally, insulin resistance (high homeostatic model assessment of insulin resistance [HOMA-IR]) correlated with reduced insulin/ mTORC2 signaling and elevated MCP1 production in visceral adipose tissue from obese human subjects. Our findings suggest that insulin resistance in adipose tissue leads to inflammation rather than vice versa.
Insulin resistance causes inflammation
in adipose tissue
Mitsugu Shimobayashi,1 Verena Albert,1 Bettina Woelnerhanssen,2 Irina C. Frei,1 Diana Weissenberger,1
Anne Christin Meyer-Gerspach,2 Nicolas Clement,3 Suzette Moes,1 Marco Colombi,1 Jerome A. Meier,1
Marta M. Swierczynska,1 Paul Jenö,1 Christoph Beglinger,2 Ralph Peterli,3 and Michael N. Hall1
1Biozentrum, University of Basel, Basel, Switzerland. 2Department of Research and 3Department of Surgery, St. Claraspital, Basel, Switzerland.
Conflict of interest: The authors have declared that no conflict of interest exists.
Submitted: July 7, 2017; Accepted: January 30, 2018.
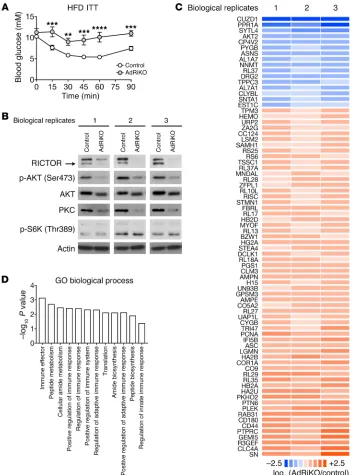
whether insulin resistance due to impaired insulin/mTORC2 sig-naling in WAT affects adipose inflammation, we performed quan-titative proteomics on epididymal WAT (eWAT) from HFD-fed (for 10 weeks) AdRiKO (aP2-Cre, Rictorfl/fl) and control (Rictorfl/fl)
mice. As previously reported (32–34), HFD-fed AdRiKO mice had an increased body size with no change in adiposity (Supplemen-tal Figure 1, A–C; supplemen(Supplemen-tal material available online with this article; https://doi.org/10.1172/JCI96139DS1). Furthermore, we confirmed that RICTOR expression, AKT (Ser473) phosphor-ylation, and PKC expression, readouts for mTORC2 signaling, were decreased, while S6K (Thr389) phosphorylation, a readout for mTORC1 signaling, was not affected in eWAT (Figure 1B; see complete unedited blots in the supplemental material). Among approximately 3,000 proteins identified in the proteome, 61 and 16 were up- and downregulated, respectively, in AdRiKO mice insulin resistance and inflammation. We found that inhibition of
the insulin/mTORC2 pathway resulted in enhanced Mcp1 tran-scription in mouse and human adipocytes and thereby promoted inflammation in visceral WAT. Furthermore, obesity-induced insu-lin resistance developed before the accumulation of proinflamma-tory M1 macrophages in visceral WAT of WT mice. Thus, insulin resistance precedes and causes inflammation in adipose tissue.
Results
[image:3.585.41.400.55.530.2]Insulin/mTORC2 signaling in WAT negatively controls inflammation. AdRiKO exacerbates systemic insulin resistance upon obesity, as evidenced by impaired glucose clearance in response to insulin treatment (Figure 1A and refs. 32–34). Thus, the AdRiKO mouse is a good model to investigate the causal relationship between insulin resistance and inflammation upon obesity. To determine
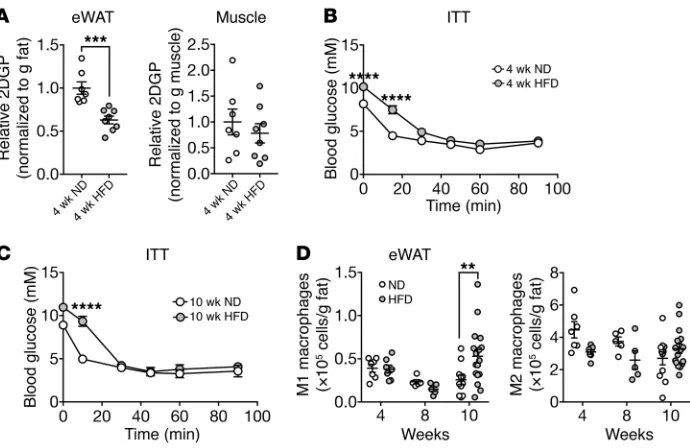
of HFD feeding, as measured by insulin-stimulated glucose uptake and an insulin tolerance test (ITT) (Figure 3, A and B, and Sup-plemental Figure 5B), respectively. Mice fed a HFD for 10 weeks remained insulin resistant compared with mice on a ND (Figure 3C and Supplemental Figure 5C). The M1 macrophage population in eWAT mildly increased in mice by week 10 of a HFD, but not by 4 or 8 weeks (Figure 3D). Tnfa expression did not increase in mice at 4 or 10 weeks of a HFD (Supplemental Figure 5D). These find-ings are consistent with previous reports showing that mice devel-op adipose and systemic insulin resistance within several days to 4 weeks of a HFD (44, 45), whereas the number of M1 macrophages in WAT increases only within 8 to 10 weeks of a HFD (10, 15, 45, 46). The finding that HFD-induced insulin resistance precedes the accumulation of M1 macrophages is consistent with our above conclusion that insulin resistance leads to inflammation.
Insulin resistance–induced inflammation is specific to visceral WAT. Adipose-specific loss of mTORC2 signaling directly causes insulin resistance in all WAT depots and indirectly leads to sys-temic insulin resistance (32–34). To test whether AdRiKO caus-es inflammation in liver or in fat depots other than eWAT (see above), we examined macrophage numbers in peri-renal WAT (prWAT), subcutaneous WAT (sWAT), and liver of HFD-fed AdRiKO and control mice. AdRiKO prWAT, but not sWAT or liver, had increased numbers of M1 macrophages, (Supplemental Fig-ure 6, A–C). Thus, AdRiKO promotes inflammation specifically in visceral WAT (eWAT and prWAT).
To test whether local insulin resistance causes inflammation in the liver, we examined hepatic macrophages in liver-specific Rictor-knockout mice (LiRiKO: Alb-Cre, Rictorfl/fl), which have
hepatic insulin resistance due to loss of insulin/mTORC2 signal-ing in liver (35–37). HFD-fed LiRiKO mice had a moderate but nonsignificant increase in the number of hepatic macrophages compared with HFD-fed control mice (Supplemental Figure 6D). Furthermore, the numbers of M1 and M2 macrophages in eWAT were identical in LiRiKO and control mice (Supplemental Figure 6E). Thus, the ability of local insulin resistance to promote inflam-mation is specific to visceral WAT.
Rictor knockout in adipocytes increases expression of the chemo-kine MCP1. How does insulin resistance in visceral WAT cause local accumulation of M1 macrophages and inflammation? Ama-no et al. have suggested that a HFD induces local proliferation of macrophages (23). Alternatively, others have proposed that WAT recruits circulating monocytes, which then differentiate into M1 macrophages (7, 22). To distinguish between these 2 models, we used flow cytometry to measure the proliferation marker Ki-67 in macrophages in eWAT of HFD-fed mice. The percentage of Ki-67+
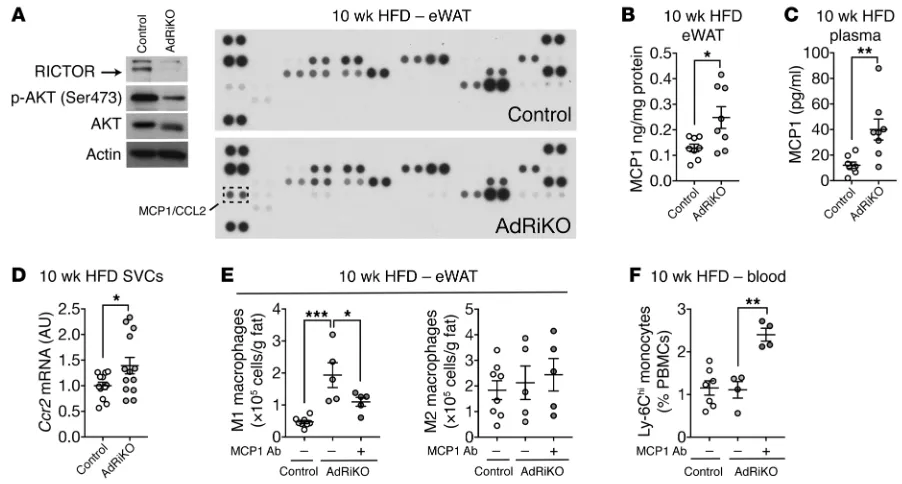
M1 macrophages in AdRiKO mice was similar to that in control mice (Supplemental Figure 7A), suggesting that the increase in M1 macrophages in AdRiKO eWAT is not due to local proliferation. To investigate the possibility that WAT recruits monocytes, we examined the expression of WAT-derived chemokines in eWAT from HFD-fed AdRiKO and control mice. A chemokine array and ELISA revealed increased expression of monocyte chemoattrac-tant protein 1 (MCP1, also known as C-C motif ligand 2 [CCL2]) in AdRiKO eWAT (Figure 4, A and B). Increased levels of MCP1 were also detected in the plasma of HFD-fed AdRiKO mice (Figure 4C). Furthermore, in SVCs isolated from AdRiKO eWAT, we observed compared with controls (Figure 1C and Supplemental Table 1).
Gene Ontology (GO) analysis of the regulated proteins revealed enrichment of immune response–related biological process-es (Figure 1D), suggprocess-esting that insulin rprocess-esistance due to loss of mTORC2 signaling may cause inflammation upon obesity.
To examine further whether mTORC2 in WAT controls inflammation, we quantified immune cells in eWAT of HFD-fed AdRiKO and control mice by flow cytometry. While the num-bers of B and T cells did not differ (Supplemental Figure 1D), the number of macrophages (F4/80+CD11b+) increased in AdRiKO
eWAT at 10 weeks of HFD feeding (Figure 2, A and B, and Supple-mental Figure 2A). The increase in macrophages correlated with increased macrophage gene expression (Cd68 and F4/80) and F4/80 staining (Figure 2, C and D). Next, we determined whether the increase in the number of macrophages in AdRiKO eWAT was due to an increase in proinflammatory M1 (F4/80+CD11b+CD11c+)
and/or antiinflammatory M2 (F4/80+CD11b+CD301+)
macro-phages. The numbers of both M1 and M2 macrophages increased in both AdRiKO and control mice during the HFD time course (Figure 2, E–G). AdRiKO eWAT showed a disproportionately large increase in M1 macrophages, starting at 6 weeks of HFD feeding (Figure 2, E and F). Quantification of proinflammatory cytokine
TNF-α mRNA in SVCs and macrophages isolated from
HFD-fed AdRiKO and control mice confirmed the disproportionate increase in M1 macrophages in AdRiKO eWAT (Figure 2, H and I, and Supplemental Figure 2, B and C). These observations indicate that AdRiKO leads to the accumulation of M1 macrophages, con-firming that genetically induced insulin resistance due to loss of mTORC2 signaling in WAT promotes inflammation. We note that there was no difference in macrophage numbers between AdRiKO and control mice on a normal diet (ND) (Supplemental Figure 3, A–E), indicating that AdRiKO potentiates inflammation only in response to obesity.
Our AdRiKO model relies on the adipose-specific promoter aP2 to drive Cre expression and thereby knock out Rictor. How-ever, aP2-Cre can be expressed in cell types other than adipo-cytes including macrophages (40, 41). Three lines of evidence suggest that our findings are not due to confounding effects of ectopic knockout of Rictor in macrophages. First, Rictor expres-sion was unchanged in macrophages isolated from the HFD-fed AdRiKO mice compared with those from control mice (Supple-mental Figure 4, A and B). Second, adipose-specific deletion of Rictor via expression of Cre from the Adipoq promoter (i-AdRiKO: Adipoq-CreERT2, Rictorfl/fl) (40, 42) also showed an increase in
M1 macrophages in eWAT upon obesity, as observed in aP2-Cre AdRiKO mice (Figure 2, J–M, and Supplemental Figure 4, C and D). Third, macrophage-specific knockout of Rictor, due to expres-sion of Cre from the LysM promoter (LysM-Cre Rictorfl/fl), had no
effect on macrophages in WAT of mice fed a HFD (43).
Figure 2. AdRiKO eWAT accumulates M1 macrophages. (A and B) Numbers of macrophages (CD45+F4/80+CD11b+) in
SVCs isolated from eWAT of HFD-fed AdRiKO and control mice. Representative FACS profiles are shown in A, and quan-tification is shown in B. **P < 0.01, by multiple Student’s t test. n = 6–15. (C) Gene expression of macrophage markers in eWAT from HFD-fed AdRiKO and control mice. **P < 0.01, by multiple Student’s t test. n = 7–8. (D) Representative F4/80 staining of eWAT from HFD-fed AdRiKO and control mice. n = 4. Scale bar: 100 μm. (E–G) Numbers of M1 mac-rophages (CD45+F4/80+CD11b+CD11c+) and M2 macrophages (CD45+F4/80+CD11b+CD301+) in SVCs from eWAT of HFD-fed
AdRiKO and control mice. Representative FACS profiles are shown in E, and quantification is shown in F and G. ****P < 0.0001 and P = 0.053, by multiple Student’s t test. n = 6–15. (H and I) Tnfa gene expression in SVCs (H) (n = 9) and isolated macrophages (I) (n = 6–8) from eWAT of HFD-fed AdRiKO and control mice. *P < 0.05, by unpaired Student’s t test. (J) Immunoblots of eWAT from i-AdRiKO and control mice. Mice were treated with tamoxifen for 5 days. After 4 weeks, mice were fasted for 5 hours and then treated with PBS or insulin. (K) ITT for i-AdRiKO and control mice 4 weeks after induction of Rictor knockout. Mice were fasted for 5 hours prior to the ITT. **P < 0.01, ***P < 0.001, and ****P < 0.0001, by 2-way ANOVA. n = 5 (control) and n = 6 (i-AdRiKO). (L and M) Numbers of M1 macrophages (CD45+F4/80+CD11b+CD11c+) (L) and M2 macrophages (CD45+F4/80+CD11b+CD301+) (M) in SVCs from eWAT of HFD-fed
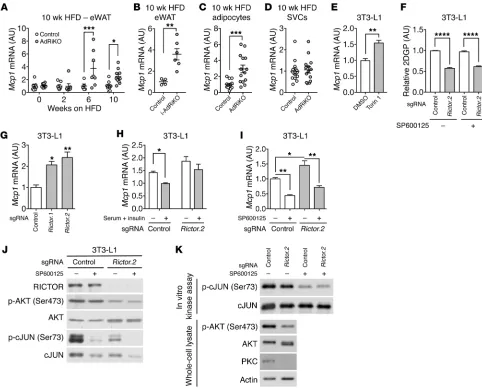
autonomous, we first treated 3T3-L1 adipocytes with the mTOR inhibitor torin 1 (47). 3T3-L1 adipocytes treated with torin 1 had increased Mcp1 expression (Figure 5E). Next, we generated 2 Rictor-knockout 3T3-L1 adipocyte cell lines (Figure 5F and Supple-mental Figure 8B) using the genome-editing CRISPR-Cas9 system (48). Rictor-knockout 3T3-L1 adipocytes were able to differentiate, albeit at a slower rate compared with control cells (Supplemental Figure 8C). Consistent with our in vivo data, Mcp1 expression was increased in the Rictor-knockout 3T3-L1 adipocytes (Figure 5G and Supplemental Figure 8B). Serum and insulin treatment sup-pressed Mcp1 expression in control but not Rictor-knockout 3T3-L1 adipocytes (Figure 5H and Supplemental Figure 8D). In WT mice, Mcp1 expression increased by 10 weeks, but not 4 weeks, of HFD feeding (Supplemental Figure 8E). These data support the notion that insulin resistance precedes and promotes Mcp1 transcription in adipocytes. We note that Rictor knockout in liver (LiRiKO) did not result in hepatic Mcp1 expression (Supplemental Figure 8F), consistent with our above finding that LiRiKO failed to stimulate inflammation in liver.
How does mTORC2 loss lead to Mcp1 transcription? It has been suggested that JNK is required for MCP1 expression and secretion in cultured 3T3-L1 adipocytes (49). Consistent with that report, treatment with the JNK inhibitor SP600125 reduced Mcp1 expression in Rictor-knockout 3T3-L1 cells (Figure 5I). Inhibition of JNK was confirmed by loss of cJUN (Ser73) phosphorylation (Fig-ure 5J). SP600125 did not restore AKT (Ser 473) phosphorylation (Figure 5J) or insulin-stimulated glucose uptake (Figure 5F) in the Rictor-knockout 3T3-L1 cells, indicating that the effect of the drug was independent of mTORC2 and insulin resistance. Furthermore, JNK activity was unaffected by Rictor knockout (Figure 5, J and K). Thus, mTORC2 and JNK control Mcp1 expression independently.
Impaired insulin/mTORC2 signaling and increased MCP1 expres-sion in omental WAT of obese patients. MCP1 mRNA levels in omen-tal WAT (oWAT) correlate with BMI in obese human subjects (9, 50). However, how MCP1 transcription is regulated in human adipose tissue is unknown. Our finding that insulin/mTORC2 sig-significantly increased expression of C-C chemokine receptor
type 2 (Ccr2), encoding an MCP1 receptor, as a result of increased numbers of Ccr2-expressing cells such as monocytes and macro-phages (Figure 4D). These findings suggest that insulin-resistant visceral WAT, via MCP1 expression, recruits monocytes, which then differentiate into M1 macrophages.
We next tested whether the increase in MCP1 is responsible for M1 macrophage accumulation in AdRiKO eWAT. Mice were fed a HFD for 8 weeks and then treated with an MCP1-neutral-izing or control antibody for 2 weeks along with ongoing HFD feeding. The antibody treatments had no impact on body weight (Supplemental Figure 7B). The MCP1-neutralizing antibody inhib-ited the accumulation of M1 macrophages in AdRiKO eWAT by 50%, with no impact on M2 macrophages (Figure 4E). The MCP1- neutralizing antibody also caused a 2-fold increase in monocytes (Ly-6ChiCD11b+) in the blood of AdRiKO mice (Figure 4F). Thus,
MCP1 appears to mediate the increase in M1 macrophages in AdRiKO eWAT. Altogether, our data suggest that mTORC2 inhibi-tion in WAT results in Mcp1 expression, followed by infiltrainhibi-tion of monocytes in an MCP1-CCR2–dependent manner.
[image:6.585.38.383.54.278.2]Insulin/mTORC2 signaling inhibits Mcp1 transcription in adipo-cytes. Expression of the Mcp1 gene was increased in the eWAT of HFD-fed AdRiKO and i-AdRiKO mice compared with expression levels in control eWAT (Figure 5, A and B), suggesting that MCP1 is upregulated in AdRiKO WAT at the transcriptional level. Fur-thermore, we note that the increase in Mcp1 expression (Figure 5A) coincided with an increase in the number of M1 macrophages in AdRiKO eWAT (Figure 2F). The number of macrophages and expression levels of Mcp1 were unchanged in AdRiKO and control eWAT in ND-fed mice (Supplemental Figure 3 and Supplemen-tal Figure 8A). To identify the cells in which Mcp1 expression was induced, we measured Mcp1 mRNA levels in adipocytes and SVCs isolated from eWAT of HFD-fed AdRiKO and control mice (Sup-plemental Figure 2B). AdRiKO adipocytes, but not SVCs, showed increased Mcp1 expression (Figure 5, C and D). To determine whether the regulation of Mcp1 transcription by mTORC2 is cell
Figure 3. HFD-induced insulin resistance precedes the accumulation of M1 mac-rophages. (A) Insulin-stimulated 2DGP accumulation in eWAT and muscle from WT mice fed a ND or HFD for 4 weeks. Mice were fasted for 5 hours, injected with insulin at 0 minutes and 2DG at 10 minutes, and sacrificed at 30 minutes. ***P < 0.001, by unpaired Student’s t test. n = 7–8. (B and
C) ITT for WT mice fed a ND or HFD for 4 weeks (B) or 10 weeks (C). Mice were fasted for 5 hours prior to the ITT. ****P < 0.0001, by 2-way ANOVA. n = 15 (4 wk ND), n = 17 (4 wk HFD), n = 3 (10 wk ND), and n = 4 (10 wk HFD). (D) Numbers of M1 macrophages (CD45+F4/80+CD11b+CD11c+) and M2
macro-phages (CD45+F4/80+CD11b+CD301+) in eWAT
of WT mice fed a HFD for 4, 8, or 10 weeks. **P < 0.01, by multiple Student’s t test. n = 5–17. Rictorfl/fl mice were used as WT
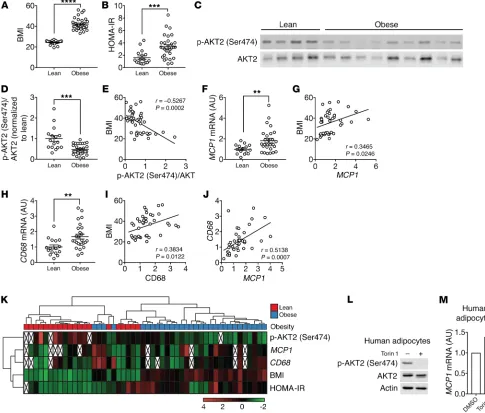
naling negatively controls Mcp1 transcription and adipose tissue inflammation in mice prompted us to examine insulin/mTORC2 signaling, MCP1 expression, and macrophage accumulation in human visceral WAT, i.e., oWAT. To this end, oWAT samples were collected from 20 lean and 30 obese human patients who were under general anesthesia (Figure 6A and Supplemental Table 2). The obese patients were insulin resistant as determined by high homeostatic model assessment of insulin resistance (HOMA-IR) (Figure 6B and Supplemental Figure 9A). We note that oWAT was collected from patients who, because of standard procedure before undergoing general anesthesia, had fasted overnight, a condition that might not be optimal for the evaluation of insu-lin/mTORC2 signaling. Nevertheless, in oWAT, AKT2 (Ser474) phosphorylation, a readout for mTORC2 signaling, was lower in obese patients than in lean patients (Figure 6, C and D). AKT2 (Ser474) phosphorylation negatively correlated with BMI (Fig-ure 6E). These data suggest that insulin/mTORC2 signaling is impaired in oWAT of obese and insulin-resistant patients and vali-date AdRiKO mice as a model for human insulin resistance. MCP1 expression was higher in obese subjects and positively correlated with BMI (Figure 6, F and G, and Supplemental Figure 9B). CD68 expression was also higher in the obese subjects and positively correlated with BMI (Figure 6, H and I, and Supplemental Figure 9C). MCP1 and CD68 expression levels also correlated (Figure 6J). AKT2 (Ser474) phosphorylation did not correlate with MCP1 and CD68 expression (Supplemental Figure 9, D and E) when com-paring the entire cohort of 50 patients, consistent with our above observation in mice that inhibition of insulin/mTORC2 signaling
alone was not sufficient to promote adipose tissue inflammation (Supplemental Figure 3). However, approximately one-third of the obese patients (9 of 30) had low AKT (Ser474) phosphoryla-tion and high HOMA-IR, MCP1, and CD68 (Figure 6K), suggest-ing that AdRiKO mice may phenocopy this subgroup of patients. Finally, torin 1 treatment led to an increase in MCP1 expression in human primary adipocytes, suggesting that insulin/mTOR signal-ing inhibits MCP1 expression also in humans (Figure 6, L and M).
Discussion
We provide 2 lines of evidence that insulin resistance promotes the accumulation of M1 macrophages and thereby fosters inflam-mation (Figure 7). First, we show that knockout of mTORC2, i.e., genetically induced insulin resistance, in mouse adipocytes dere-pressed Mcp1 expression. As a consequence, monocytes were recruited to visceral WAT, where they differentiated into M1 macrophages and caused inflammation. Second, HFD-induced insulin resistance in WT mice preceded the accumulation of proinflammatory M1 macrophages. We also show that oWAT from obese, insulin-resistant patients had low mTORC2 signaling, high MCP1 expression, and high macrophage content, suggesting that our findings in mice have human relevance (Figure 6).
[image:7.585.66.517.54.296.2]Our findings are consistent with observations made in mice genetically modified in other components of the insulin signal-ing pathway. Two studies demonstrated that deletion of PTEN or PIK3R1, negative regulators of insulin signaling, causes enhanced insulin sensitivity and a reduced number of macrophages in adi-pose tissue (51, 52). More recently, Shearin et al. (53) showed that
Figure 4. Insulin/mTORC2 signaling inhibits Mcp1 transcription and M1 macrophage accumulation in vivo. (A) Adipokine array of eWAT from HFD-fed AdRiKO and control mice. Immunoblots show the reduction of RICTOR expression and mTORC2 signaling. n = 8 (data from 8 mice were pooled). (B) MCP1 protein levels in eWAT from HFD-fed AdRiKO and control mice. *P < 0.05, by unpaired Student’s t test. n = 8. (C) MCP1 protein levels in plasma from HFD-fed AdRiKO and control mice. **P < 0.01, by unpaired Student’s t test. n = 8. (D) Ccr2 mRNA levels in SVCs isolated from eWAT of HFD-fed AdRiKO and control mice. *P < 0.05, by unpaired Student’s t test. n = 12. (E) Numbers of M1 macrophages (CD45+F4/80+CD11b+CD11c+) and M2 macrophages
(CD45+F4/80+CD11b+CD301+) in eWAT. Mice were fed a HFD for 8 weeks and treated with a control or MCP1-neutralizing antibody for 2 weeks with ongoing
adipose-specific Akt1- and Akt2-knockout mice exhibit insulin resistance and increased macrophage infiltration in adipose tissue.
The above studies altogether may disentangle the “chicken-and-egg” relationship (see Introduction) of insulin resistance and inflammation, at least in adipose tissue. Obesity induces insulin resistance, via a yet-to-be defined mechanism, which in turn pro-motes inflammation. As suggested previously (16), this inflamma-tion may contribute to adipose tissue remodeling and expansion to maintain glucose hemostasis. It has been suggested that acti-vated M1 macrophages undergo metabolic reprogramming from oxidative phosphorylation to glycolysis (54, 55). Thus, a physiolog-ical role of M1 macrophages could be to clear excess local glucose.
Our finding that insulin resistance precedes inflammation may account for the observation that inhibition of TNF-α is ineffective in the treatment of obesity-induced insulin resistance (18–21).
[image:8.585.42.524.55.445.2]HFD-fed AdRiKO mice showed reduced AKT (Ser473) phos-phorylation (Figure 1B), decreased glucose uptake (Figure 1A), and extensive inflammation (Figure 2) in eWAT. HFD-fed WT mice also displayed decreased glucose uptake (Figure 3, A–C), which was followed by mild inflammation (Figure 3D). Unexpect-edly, AKT (Ser473) phosphorylation was not reduced in WT mice fed a HFD for 4 or 10 weeks (Supplemental Figure 5, E and F) (56), although we still observed mild inflammation in eWAT by week 10 of HFD feeding. We note that the number of M1 macrophages
ity, also functions as a transcriptional repressor (58). We found that Lipin1 expression was reduced in Rictor-knockout eWAT and adipocytes (Supplemental Figure 10, A and B), suggesting that mTORC2 may negatively control Mcp1 transcription via LIPIN1. An adipose-specific transcription factor is another candidate through which mTORC2 may control Mcp1 expression. Rictor knockout increased Mcp1 expression in adipocytes, but not in liv-er or fibroblasts (Supplemental Figure 8F and Supplemental Fig-ure 10C), indicating that the regulation of Mcp1 transcription by mTORC2 is specific to adipocytes.
Why does AdRiKO eWAT accumulate a disproportionately high number of M1 macrophages only in response to obesity? The in AdRiKO eWAT was much higher than that in control eWAT
by week 10 of the HFD (Figure 2F). These findings suggest that obesity-induced insulin resistance promotes mild inflammation downstream or independently of mTORC2, whereas chronic insu-lin resistance leads to mTORC2 inhibition and therefore extensive inflammation, as observed in AdRiKO mice and obese patients.
Our experiments reveal that loss of mTORC2 leads to increased Mcp1 expression in adipocytes (Figure 5). What is the downstream effector through which mTORC2 controls Mcp1 tran-scription? One candidate is the phosphatidic acid phosphatase LIPIN1, whose knockdown results in Mcp1 expression in 3T3-L1 adipocytes (57). LIPIN1, independently of its phosphatase
[image:9.585.46.531.59.472.2]trol. For i-AdRiKO mouse experiments, control mice were also treated with tamoxifen. Mice were randomly assigned for each experiment. Only male, 6- to 16-week-old mice were used for experiments.
Cell culture. 3T3-L1 cells were cultured and differentiated as
described previously (62). In brief, 3T3-L1 preadipocyte cells were maintained in M1 medium (DMEM supplemented with 4 mM gluta-mine, 1 mM sodium pyruvate, 1× penicillin and streptomycin, and 10% FBS) at 37°C in an incubator with 5% CO2. For differentiation, cells were maintained in M1 medium for 2 days after reaching confluence. The medium was replaced with M2 medium (M1 medium supple-mented with 1.5 μg/ml insulin, 0.5 mM IBMX, 1 μM dexamethasone, and 2 μM rosiglitazone), defined as day 0 of differentiation. After 2 days, the medium was replaced with M3 medium (M1 with 1.5 μg/ml insulin). The medium was replaced with M2 on day 4 of differentia-tion. From day 6, cells were maintained in M3 with a medium change every 2 days. For all experiments, cells differentiated for 10 to 14 days were used. Torin 1 was purchased from Tocris Bioscience and dis-solved in DMSO.
Human oWAT biopsies. oWAT biopsies were obtained from lean
subjects with a BMI below 27 kg/m2 and from obese subjects with a
BMI above 35 kg/m2 (Supplemental Table 2). Patients were fasted
overnight and then underwent general anesthesia. All oWAT samples were obtained between 8:30 and 12:00, snap-frozen in liquid nitro-gen, and stored at –80°C.
Human primary adipocytes. Human primary visceral
preadipo-cytes (from a 56-year-oldwoman with a BMI of 23) were obtained from Lonza. Cells were cultured and differentiated according to the man-ufacturer’s instructions. After 14 days of differentiation, cells were treated with DMSO or 250 nM torin1 for 6 hours.
Generation of Rictor-knockout cells by CRISPR/Cas9-mediat-ed genome CRISPR/Cas9-mediat-editing. Rictor-knockout 3T3-L1 cells (Hall laboratory
stock) were generated using the CRISPR/Cas9 system. Oligonucle-otides containing single-guide RNAs (sgRNAs) (Rictor.1, forward: CACCGGAAGATACTGATCCCGCTTG, sgRNA Rictor.1, reverse: AAACCAAGCGGGATCAGTATCTTCC; sgRNA Rictor.2, forward: CACCGTGCCTCCTAGGGCTTGGTCG, sgRNA Rictor.1, reverse: AAACCGACCAAGCCCTAGGAGGCAC) were cloned into lenti-CRISPRv2 (Addgene plasmid 52961) (48), a gift of Feng Zhang (MIT, Cambridge Massachusetts, USA). Plasmids were amplified by bacte-rial transformation and isolated by Miniprep (Zymo Research). Lenti-CRISPRv2 plasmids were cotransfected with psPAX2 (Addgene plas-mid 12260; a gift of Didier Trono, EPFL, Lausanne, Switzerland) and pCMV-VSV-G (63) (Addgene plasmid 8454; a gift of Robert Weinberg, MIT, Cambridge, Massachusetts, USA) into HEK293T cells (Hall lab-oratory stock). Supernatants containing lentiviruses were collected 1 day after transfection and used to transduce undifferentiated 3T3-L1 cells. Transduced cells were selected by puromycin.
2-Deoxyglucose uptake assay. Mice were fed a ND or HFD for 4
weeks, fasted for 5 hours, and given Humalog insulin i.p. (Lilly; 0.75 U/kg body weight). After 10 minutes, 2-deoxyglucose (2DG) (Sigma- Aldrich) was given i.p. (32.8 μg/g body weight), and tissues (eWAT, muscle) were collected 20 minutes later. For in vitro 2DG uptake, differentiated adipocytes were cultured in serum-free M1 medium, washed 3 times with HKRP buffer (1.2 mM KH2PO4, 1.2 mM MgSO4, 1.3 mM CaCl2, 118 mM NaCl, 5 mM KCl, and 30 mM HEPES, pH7.5), and cultured in HKRP buffer with 1% BSA for 30 minutes. Cells were stimulated with 100 nM insulin for 20 minutes and subsequently
increase in Mcp1 transcription in mTORC2-knockout adipocytes required JNK activity (Figure 5I), which is high only in WAT from obese mice (59, 60). Thus, obesity might be a prerequisite for JNK activation, which in turn stimulates Mcp1 expression in conjunc-tion with loss of mTORC2. We note that mTORC2 did not control JNK (Figure 5, J and K).
In summary, we propose that obesity-mediated insulin resis-tance is a cause of inflammation in visceral WAT. Although our findings do not rule out the possibility that inflammation promotes insulin resistance in other tissues or conditions, they bring into question whether antiinflammation therapy in adipose tissue is an effective strategy in the prevention of type 2 diabetes.
Methods
Mice. Adipose tissue–specific Rictor-knockout (AdRiKO) and liver-
specific Rictor-knockout (LiRiKO) mice were described previously (32, 35, 61). Since AdRiKO mice are infertile, we bred Rictorfl/+ aP2-Cre mice
with Rictorfl/fl mice to generate mice for our experiments. For
experi-ments with AdRiKO mice, age-matched Cre-negative males were used as controls. To generate LiRiKO mice for experiments, Rictorfl/fl Alb-Cre
mice were crossed with Rictorfl/fl mice. To generate an i-AdRiKO mouse
line, Rictorfl/fl mice were bred with adipoq-CreERT2 mice, provided by
Stefan Offermanns (Max Planck Institute for Heart and Lung Research [MPI-HLR], Bad Nauheim, Germany) (42). Once the i-AdRiKO mouse line (Rictorfl/fl adipoq-CreERT2) was generated, these mice were bred
with Rictorfl/fl mice to produce mice for experiments. For experiments
with LiRiKO and i-AdRiKO mice, Cre-negative littermate male mice were used as controls. All mice used in this study were on a C57BL/6 background. For i-AdRiKO mice, Rictor knockout was induced by i.p. injection of 1 mg/mouse tamoxifen (Sigma-Aldrich) resuspended in corn oil daily for 5 days. Mice were housed at 22°C in a conventional facility under a 12-hour light/12-hour dark cycle with unlimited access to water and were fed a ND or a HFD (60% kcal from fat NAFAG 2127, KLIBA). The HFD-feeding experiment was conducted for 10 weeks unless otherwise specified. Cre-negative animals were used as a
[image:10.585.46.271.55.242.2]CD301–Alexa Fluor 647 (AbD Serotec; catalog MCA2392A647T); CD4-FITC (eBioscience; catalog 11-0041-81); CD8a-PE (eBioscience; catalog 12-0081-81); CD3-APC (eBioscience; catalog 17-0032-80); CD45R (B220) PerCP-Cyanine 5.5 (eBioscience; catalog 45-0452-80); CD25 APC-eFluor 780 (eBioscience; catalog 47-0251-45-0452-80); and Ki-67–Alexa Fluor 488 (BD Pharmingen; catalog 561165), along with a FOXP3 Flow Kit (BioLegend, catalog 320021) and a Live/Dead Fix-able Dead Cell Kit (Thermo Fisher; catalog L34955). Stained SVCs were analyzed using the FACSCanto II (BD Biosciences) or sorted with a FACSAria IIIu (BD Biosciences).
Immunohistochemistry. WATs were fixed overnight in 4% formalin
at room temperature, dehydrated, embedded in paraffin, and cut into 5-μm-thick sections. Adipose tissue macrophages were stained with F4/80 antibody (Abcam; catalog ab6640) and a secondary anti-body conjugated with HRP (VECTOR Laboratories), followed by incu-bation in ImmPACT DAB peroxidase substrate solution (VECTOR Laboratories) and subsequent counterstaining with hematoxylin (VECTOR Laboratories). Images were obtained using DM600B (Lei-ca) and analyzed with Fiji software (ImageJ; NIH) (65).
RNA isolation and quantitative real-time PCR. Total RNA was
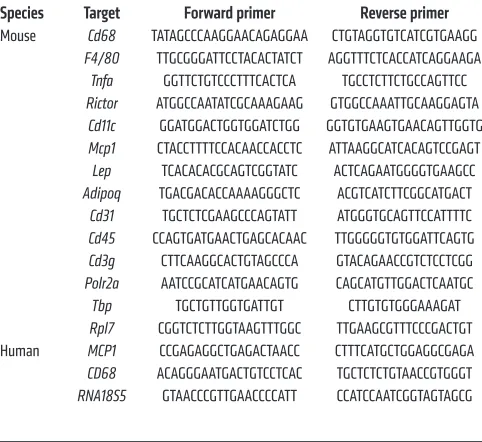
isolated with TRIzol Reagent (Sigma-Aldrich) and an RNeasy Kit (QIAGEN). For RNA isolation from sorted macrophages, an RNeasy Micro Kit (QIAGEN) was used. RNA was reverse transcribed to cDNA using an iScript cDNA Synthesis Kit (Bio-Rad). Semiquantitative real-time PCR analysis was performed using Fast SYBR Green (Applied Biosystems). Relative expression levels were determined by normal-izing each Ct value to either Polr2a, Tbp, or Rpl7 expression for mice and RNA18S5 for human samples using the ΔΔCt method. The primer sequences used in this study are shown in Table 1.
Protein isolation and immunoblots. Tissues were homogenized in
lysis buffer containing 100 mM Tris-HCl, pH7.5, 2 mM EDTA, 2 mM EGTA, 150 mM NaCl, 1% Triton X-100, cOmplete Inhibitor Cock-tail (Roche), and PhosSTOP (Roche). The protein concentration was determined by the Bradford assay, and equal amounts of protein were separated by SDS-PAGE and transferred onto nitrocellulose mem-branes (GE Healthcare). The following antibodies were used in this study and were purchased from Cell Signaling Technology: AKT (cat-alog 4685); phosphorylated AKT (p-AKT) (Ser473) (cat(cat-alog 4060), RICTOR (catalog 2140), PKC (catalog 2056), p-S6K (Thr389) (catalog 9234), S6K (catalog 2708), p-JNK (Thr183/Tyr185) (catalog 4668), JNK (catalog 9252), p-cJUN (Ser73) (catalog 3270), cJUN (catalog 9165). Actin monoclonal antibody was purchased from Sigma-Aldrich (catalog MAB1501).
JNK kinase assay. JNK activity was measured using a SAPK/JNK
Kinase Assay Kit (Nonradioactive) (Cell Signaling Technology; cat-alog 8794).
Proteome analysis. eWAT was homogenized in urea lysis buffer
containing 50 mM Tris-HCl, pH 8.2, 8 M urea, 75 mM NaCl, cOm-plete inhibitor cocktail (Roche), and PhosSTOP (Roche). The extracts were incubated for 30 minutes at 4°C and centrifuged for 15 minutes at 14,000 g. Protein concentration was measured with the Bradford assay. Proteins were reduced with 2.5 mM DTT for 40 minutes at 56°C and alkylated with 7.5 mM iodoacetamide for 40 minutes at room tem-perature in the dark with gentle shaking. The urea concentration was lowered to 4 M with 25 mM Tris-HCl, pH 8. The lysates were digested with 2 rounds of endoproteinase LysC (Wako) at an enzyme/protein ratio of 1:100 (w/w) at 37°C for 2 hours. After the LysC digestion, the cultured with 1 mM 2DG for 20 minutes. Tissues or cells were lysed
in 10 mM Tris-HCL, pH 8.0, by boiling for 15 minutes. 2-Deoxyglu-cose-6-phosphate (2DGP) was measured using a Glucose Uptake-Glo Assay Kit (Promega) following the manufacturer’s instructions.
MCP1 ELISA and adipokine array. Mice were fed a HFD for 10
weeks, and MCP1 levels in eWAT and plasma were measured using a commercial ELISA kit (R&D Systems) following the manufacturer’s instructions. Adipokine array (R&D Systems) was performed accord-ing to the manufacturer’s instructions.
MCP1-neutralizing antibody treatment. Mice were fed a HFD for 8
weeks. Mice were given i.p. 1 mg/kg body weight isotype control IgG (BD Biosciences; catalog 553968, lot 4113848) or anti–MCP1 IgG (BD Biosciences; catalog 554440, lot 5203535) every 2 days for 2 weeks.
ITT. Mice were fasted for 5 hours, Humalog insulin (Lilly) was
given i.p. (0.75U/kg body weight), and blood glucose levels were mea-sured with an Accu-Chek blood glucose meter.
In vivo insulin stimulation. Mice were fasted for 5 hours, Humalog
insulin (Lilly) was administered i.p. (0.75U/kg body weight), and tis-sues were collected.
Isolation of adipocytes and SVCs and flow cytometric analysis. SVCs
were isolated and stained with antibody as previously described (64). In brief, fat pads were excised and minced in HBSS++ supplemented
[image:11.585.42.283.82.303.2]with 0.5% BSA and digested with 1 mg/ml type II collagenase (Sigma- Aldrich) at 37°C for 40 minutes with vigorous shaking. After digestion, final 10 mM EDTA was added and incubated for 10 minutes to disso-ciate SVCs. The resulting suspension was filtered through a 100-μm cell strainer (Corning) and centrifuged at 500 g for 10 minutes. After centrifugation, floating adipocytes were collected, and SVC-contain-ing pellets were subjected to red blood cell lysis in 1× Red Blood Cell Lysis Buffer (eBioscience). SVCs were blocked with Fc-block (BD Biosciences) and stained with the following antibodies and reagents: F4/80-PE (eBioscience; catalog 12-4801-80); CD11b-APC eFluor 780 (eBioscience; catalog 47-0112-80); CD11c-PE-Cy7 (eBioscience; cat-alog 25-0114-81); CD45.2-PerCP (eBioscience; catcat-alog 45-0454-80);
Table 1. qRT-PCR primers
Species Target Forward primer Reverse primer
Mouse Cd68 TATAGCCCAAGGAACAGAGGAA CTGTAGGTGTCATCGTGAAGG
F4/80 TTGCGGGATTCCTACACTATCT AGGTTTCTCACCATCAGGAAGA
Tnfa GGTTCTGTCCCTTTCACTCA TGCCTCTTCTGCCAGTTCC
Rictor ATGGCCAATATCGCAAAGAAG GTGGCCAAATTGCAAGGAGTA
Cd11c GGATGGACTGGTGGATCTGG GGTGTGAAGTGAACAGTTGGTG
Mcp1 CTACCTTTTCCACAACCACCTC ATTAAGGCATCACAGTCCGAGT
Lep TCACACACGCAGTCGGTATC ACTCAGAATGGGGTGAAGCC
Adipoq TGACGACACCAAAAGGGCTC ACGTCATCTTCGGCATGACT
Cd31 TGCTCTCGAAGCCCAGTATT ATGGGTGCAGTTCCATTTTC
Cd45 CCAGTGATGAACTGAGCACAAC TTGGGGGTGTGGATTCAGTG
Cd3g CTTCAAGGCACTGTAGCCCA GTACAGAACCGTCTCCTCGG
Polr2a AATCCGCATCATGAACAGTG CAGCATGTTGGACTCAATGC
Tbp TGCTGTTGGTGATTGT CTTGTGTGGGAAAGAT
Rpl7 CGGTCTCTTGGTAAGTTTGGC TTGAAGCGTTTCCCGACTGT Human MCP1 CCGAGAGGCTGAGACTAACC CTTTCATGCTGGAGGCGAGA
CD68 ACAGGGAATGACTGTCCTCAC TGCTCTCTGTAACCGTGGGT
Progenesis data file. The data aligned in Progenesis were exported as .txt files to the R-based Perseus program (68). Volcano plots and ANOVA 2-sample t tests were performed with a FDR of 5%. Proteins were considered regulated when the ANOVA 2-sample t test was below 0.05 in each technical replicate and the Student’s t test P value was below 0.05 in at least 2 of 3 biological replicates. GO process anal-ysis was performed according to the framework provided by the Gene Ontology Consortium (69, 70).
Statistics. Immunoblots for p-AKT2 (Ser474) and AKT2 on human
oWAT were quantified in Fiji (65). Samples for which we failed to detect AKT2 were excluded from further analysis. Sample size was chosen according to our previous studies and published reports in which similar experimental procedures were described. The investi-gators were not blinded to the treatment groups. All data are shown as the mean ± SEM. Sample numbers are indicated in each figure legend. For mouse experiments, n represents the number of animals, and for cell culture experiments, N indicates the number of indepen-dent experiments. To determine the statistical significance between 2 groups, an unpaired 2-tailed Student’s t test was performed. For more than 3 groups, 1-way ANOVA was performed. For ITT data, 2-way ANOVA was performed. For human samples, statistical outliers were excluded in Figure 6 according to the robust regression and outlier removal test (ROUT) (Q = 1%) but are included in Supplemental Fig-ure 9. In all cases, a Mann-Whitney U test was performed to deter-mine statistical significance. All statistical analysis was performed using GraphPad Prism 7 (GraphPad Software). Cluster analysis was performed using ClustVis (71). A P value of less than 0.05 was consid-ered statistically significant.
Study approval. All animal experiments were performed in
accordance with federal guidelines for animal experimentation and approved by the Kantonales Veterinäramt of the Kanton Basel-Stadt (Basel, Switzerland). For human biopsies, the study protocol was approved by the Ethikkomission Nordwest-und Zentralschweiz (EKNZ) (Basel, Switzerland). All patients provided informed consent to provide adipose tissue samples.
Author contributions
MS and MNH designed and directed the research. MS, VA, RP, ICF, DW, ACMG, NC, SM, MC, JAM, MMS, and PJ performed experiments and analyzed data. MS, RP, BW, and CB designed the protocol for the collection of human adipose tissue biopsies. MS and MNH wrote the manuscript.
Acknowledgments
We thank Didier Trono (EPFL, Switzerland), Robert Weinberg (MIT, USA), and Feng Zhang (MIT, USA), Stefan Offermanns (MPI-HLR, Germany), the Imaging Core Facility (Biozentrum), and the FACS Core Facility (Biozentrum) for reagents, a mouse strain, equipment, or technical support. We acknowledge sup-port from the Swiss National Science Foundation (to MS and MNH), the Louis Jeantet Foundation (to MNH), and the Canton of Basel (to MNH).
Address correspondence to: Mitsugu Shimobayashi or Michael N. Hall, Klingelbergstrasse 50/70, Basel 4056, Switzerland. Phone: 41.61.207.2171; Email: mitsugu.shimobayashi@unibas.ch (MS). Phone: 41.61.207.2150; Email: m.hall@unibas.ch (MNH).
urea concentration was lowered to 1 M with 25 mM Tris-HCl, pH 8.0. The lysates were digested with 2 rounds of trypsin (Worthington) at an enzyme/protein ratio of 1:100 (w/w) for 2 hours, followed by over-night digestion at 37°C. Digestion was stopped by adding trifluoro-acetic acid (TFA) to reach a final concentration of 0.4%. The digests were centrifuged for 5 minutes at 3,000 g and desalted on a C18 Sep-Pak cartridge (Waters) that had been equilibrated with 0.1% TFA. The peptides were applied onto the cartridge, washed with 0.1% TFA, and subsequently eluted with 0.5% AcOH/80% AcCN. The peptide con-centration was estimated by measuring the UV absorbance at 280 nm (66). The desalted peptides were dried in a SpeedVac (Thermo Fisher Scientific). For strong cation separation, the dried peptides were dis-solved in 1.5 ml 7 mM KH2PO4, pH 2.65, and 30% AcCN (v/v) (SCX buffer A) and centrifuged at 10,600 × g. The peptides were applied onto a HiTrap SP cartridge (GE Healthcare) that had been equilibrated with 3 ml SCX buffer A, and the cartridge was washed with 3 ml SCX buffer A. Bound peptides were stepwise eluted with 1.5 ml each of SCX buffer A containing 50 mM, 100 mM, 150 mM, 250 mM, and 350 mM KCl, and each fraction was collected manually. The peptide concen-tration was estimated by absorbance at 280 nm. The fractions were dried in a SpeedVac and desalted on either micro or macro spin C18 columns (The Nest Group). The peptides were desalted with 0.1% TFA and subsequently eluted with 0.5% AcOH/80% AcCN. The dried pep-tides (20 μg) were dissolved in 20 μl of 0.1% formic acid and 0.005% TFA and analyzed on an Orbitrap Elite FT Hybrid Instrument (Ther-mo Fisher Scientific).
The peptides from the SCX step-off fractions were analyzed by capillary liquid chromatography tandem MS (LC-MS/MS) using a home-packed separating column (0.075 mm × 15 cm) packed with Reprosil C18 reverse-phase material (2.4 m particle size; provided by Albin Maisch, Ammerbuch-Entringen, Germany). The column was connected online to an Orbitrap Elite FT Hybrid Instrument. The solvents used for peptide separation were 0.1% formic acid in water/0.005% TFA (solvent A) and 0.1% formic acid/0.005% TFA and 80% acetonitrile in water (solvent B). Peptide digest (2 μl) was injected with a Proxeon nLC Capillary Pump (Thermo Fisher Scien-tific) set to 0.3 μl/min. A linear gradient from 0% to 40% of solvent B in solvent A in 95 minutes was delivered with the nano pump at a flow rate of 0.3 μl/min. After 95 minutes, the percentage of solvent B was increased to 75% in 10 minutes. The eluting peptides were ionized at 2.5 kV. The mass spectrometer was operated in data-dependent mode. The precursor scan was done in the Orbitrap, set to 60,000 resolu-tion, while the fragment ions were mass analyzed in the LTQ Orbitrap Instrument. A top-10 method was run so that the 10 most intense pre-cursors were selected for fragmentation. Each biological replicate was measured in 3 technical replicates.
The LC-MS/MS data were searched with Proteome Discov-erer 1.4 (Thermo Fisher Scientific), set to Mascot and Sequest HT against a mouse UniProtKB databank (67). The precursor tolerance was set to 10 ppm, while the fragment ion tolerance was set to 0.5 Da. The following variable modifications were used during the search: carbamidomethyl-cystein, oxidized methionine, and N-ter-minal protein acetylation. The peptide search matches were set at “high confidence” (1% FDR).
1. Rocha VZ, Libby P. Obesity, inflammation, and ath-erosclerosis. Nat Rev Cardiol. 2009;6(6):399–409. 2. Odegaard JI, Chawla A. Pleiotropic actions of
insulin resistance and inflammation in metabolic homeostasis. Science. 2013;339(6116):172–177. 3. Park J, Morley TS, Kim M, Clegg DJ, Scherer PE.
Obesity and cancer — mechanisms underlying tumour progression and recurrence. Nat Rev
Endocrinol. 2014;10(8):455–465.
4. Lackey DE, Olefsky JM. Regulation of metabo-lism by the innate immune system. Nat Rev
Endo-crinol. 2016;12(1):15–28.
5. McLaughlin T, Ackerman SE, Shen L, Engleman E. Role of innate and adaptive immunity in obe-sity-associated metabolic disease. J Clin Invest. 2017;127(1):5–13.
6. Rosen ED, Spiegelman BM. What we talk about when we talk about fat. Cell. 2014;156(1–2):20–44. 7. Lumeng CN, Bodzin JL, Saltiel AR. Obesity
induces a phenotypic switch in adipose tis-sue macrophage polarization. J Clin Invest. 2007;117(1):175–184.
8. Nguyen MT, et al. A subpopulation of macro-phages infiltrates hypertrophic adipose tissue and is activated by free fatty acids via Toll-like receptors 2 and 4 and JNK-dependent pathways.
J Biol Chem. 2007;282(48):35279–35292.
9. Weisberg SP, et al. Obesity is associated with macrophage accumulation in adipose tissue.
J Clin Invest. 2003;112(12):1796–1808.
10. Xu H, et al. Chronic inflammation in fat plays a crucial role in the development of obe-sity-related insulin resistance. J Clin Invest. 2003;112(12):1821–1830.
11. Hotamisligil GS, Shargill NS, Spiegelman BM. Adipose expression of tumor necrosis factor-α: direct role in obesity-linked insulin resistance.
Science. 1993;259(5091):87–91.
12. Kanda H, et al. MCP-1 contributes to macrophage infiltration into adipose tissue, insulin resistance, and hepatic steatosis in obesity. J Clin Invest. 2006;116(6):1494–1505.
13. Patsouris D, Li PP, Thapar D, Chapman J, Olefsky JM, Neels JG. Ablation of CD11c-positive cells normalizes insulin sensitivity in obese insulin resistant animals. Cell Metab. 2008;8(4):301–309. 14. Lee YS, et al. Inflammation is necessary for
long-term but not short-long-term high-fat diet-induced insu-lin resistance. Diabetes. 2011;60(10):2474–2483. 15. Tian XY, et al. Thermoneutral housing
accel-erates metabolic inflammation to potentiate atherosclerosis but not insulin resistance. Cell
Metab. 2016;23(1):165–178.
16. Wernstedt Asterholm I, et al. Adipocyte inflammation is essential for healthy adipose tissue expansion and remodeling. Cell Metab. 2014;20(1):103–118.
17. Kern PA, Saghizadeh M, Ong JM, Bosch RJ, Deem R, Simsolo RB. The expression of tumor necrosis factor in human adipose tissue. Regulation by obesity, weight loss, and relationship to lipopro-tein lipase. J Clin Invest. 1995;95(5):2111–2119. 18. Ofei F, Hurel S, Newkirk J, Sopwith M, Taylor
R. Effects of an engineered human anti-TNF-α antibody (CDP571) on insulin sensitivity and gly-cemic control in patients with NIDDM. Diabetes. 1996;45(7):881–885.
19. Paquot N, Castillo MJ, Lefebvre PJ, Scheen AJ. No
increased insulin sensitivity after a single intra-venous administration of a recombinant human tumor necrosis factor receptor: Fc fusion protein in obese insulin-resistant patients. J Clin
Endocri-nol Metab. 2000;85(3):1316–1319.
20. Stanley TL, et al. TNF-α antagonism with etaner-cept decreases glucose and increases the propor-tion of high molecular weight adiponectin in obese subjects with features of the metabolic syndrome.
J Clin Endocrinol Metab. 2011;96(1):E146–E150.
21. Wascher TC, Lindeman JH, Sourij H, Kooistra T, Pacini G, Roden M. Chronic TNF-alpha neu-tralization does not improve insulin resistance or endothelial function in “healthy” men with met-abolic syndrome. Mol Med. 2011;17(3-4):189–193. 22. Nagareddy PR, et al. Adipose tissue macrophages promote myelopoiesis and monocytosis in obesi-ty. Cell Metab. 2014;19(5):821–835.
23. Amano SU, et al. Local proliferation of mac-rophages contributes to obesity-associated adipose tissue inflammation. Cell Metab. 2014;19(1):162–171.
24. Kamei N, et al. Overexpression of monocyte che-moattractant protein-1 in adipose tissues causes macrophage recruitment and insulin resistance.
J Biol Chem. 2006;281(36):26602–26614.
25. Albert V, Hall MN. mTOR signaling in cellular and organismal energetics. Curr Opin Cell Biol. 2015;33:55–66.
26. Loewith R, et al. Two TOR complexes, only one of which is rapamycin sensitive, have distinct roles in cell growth control. Mol Cell. 2002;10(3):457–468. 27. Jacinto E, et al. Mammalian TOR complex 2
controls the actin cytoskeleton and is rapamycin insensitive. Nat Cell Biol. 2004;6(11):1122–1128. 28. Sarbassov DD, et al. Rictor, a novel binding partner
of mTOR, defines a rapamycin-insensitive and raptor-independent pathway that regulates the cytoskeleton. Curr Biol. 2004;14(14):1296–1302. 29. Frias MA, et al. mSin1 is necessary for Akt/
PKB phosphorylation, and its isoforms define three distinct mTORC2s. Curr Biol. 2006;16(18):1865–1870.
30. Jacinto E, et al. SIN1/MIP1 maintains ric-tor-mTOR complex integrity and regulates Akt phosphorylation and substrate specificity. Cell. 2006;127(1):125–137.
31. Yang Q, Inoki K, Ikenoue T, Guan KL. Identifica-tion of Sin1 as an essential TORC2 component required for complex formation and kinase activ-ity. Genes Dev. 2006;20(20):2820–2832. 32. Cybulski N, Polak P, Auwerx J, Ruegg MA, Hall
MN. mTOR complex 2 in adipose tissue negative-ly controls whole-body growth. Proc Natl Acad Sci
U S A. 2009;106(24):9902–9907.
33. Kumar A, et al. Fat cell-specific ablation of rictor in mice impairs insulin-regulated fat cell and whole-body glucose and lipid metabolism.
Dia-betes. 2010;59(6):1397–1406.
34. Tang Y, et al. Adipose tissue mTORC2 regulates ChREBP-driven de novo lipogenesis and hepatic glucose metabolism. Nat Commun. 2016;7:11365. 35. Hagiwara A, et al. Hepatic mTORC2 activates gly-colysis and lipogenesis through Akt, glucokinase, and SREBP1c. Cell Metab. 2012;15(5):725–738. 36. Lamming DW, et al. Rapamycin-induced
insulin resistance is mediated by mTORC2 loss and uncoupled from longevity. Science.
2012;335(6076):1638–1643.
37. Yuan M, Pino E, Wu L, Kacergis M, Soukas AA. Identification of Akt-independent regulation of hepatic lipogenesis by mammalian target of rapamycin (mTOR) complex 2. J Biol Chem. 2012;287(35):29579–29588.
38. Bentzinger CF, et al. Skeletal muscle-specific ablation of raptor, but not of rictor, causes met-abolic changes and results in muscle dystrophy.
Cell Metab. 2008;8(5):411–424.
39. Kumar A, et al. Muscle-specific deletion of rictor impairs insulin-stimulated glucose transport and enhances Basal glycogen synthase activity. Mol
Cell Biol. 2008;28(1):61–70.
40. Lee KY, et al. Lessons on conditional gene targeting in mouse adipose tissue. Diabetes. 2013;62(3):864–874.
41. Makowski L, et al. Lack of macrophage fatty- acid-binding protein aP2 protects mice deficient in apolipoprotein E against atherosclerosis. Nat
Med. 2001;7(6):699–705.
42. Sassmann A, Offermanns S, Wettschureck N. Tamoxifen-inducible Cre-mediated recombina-tion in adipocytes. Genesis. 2010;48(10):618–625. 43. Festuccia WT, Pouliot P, Bakan I, Sabatini DM,
Laplante M. Myeloid-specific Rictor deletion induces M1 macrophage polarization and poten-tiates in vivo pro-inflammatory response to lipo-polysaccharide. PLoS One. 2014;9(4):e95432. 44. Park SY, et al. Unraveling the temporal pattern
of diet-induced insulin resistance in individual organs and cardiac dysfunction in C57BL/6 mice.
Diabetes. 2005;54(12):3530–3540.
45. Turner N, et al. Distinct patterns of tissue- specific lipid accumulation during the induction of insulin resistance in mice by high-fat feeding.
Diabetologia. 2013;56(7):1638–1648.
46. Kawano Y, et al. Colonic Pro-inflammatory mac-rophages cause insulin resistance in an intestinal Ccl2/Ccr2-dependent manner. Cell Metab. 2016;24(2):295–310.
47. Thoreen CC, et al. An ATP-competitive mamma-lian target of rapamycin inhibitor reveals rapamy-cin-resistant functions of mTORC1. J Biol Chem. 2009;284(12):8023–8032.
48. Sanjana NE, Shalem O, Zhang F. Improved vectors and genome-wide libraries for CRISPR screening. Nat Methods. 2014;11(8):783–784. 49. Takahashi K, et al. JNK- and IκB-dependent
path-ways regulate MCP-1 but not adiponectin release from artificially hypertrophied 3T3-L1 adipocytes preloaded with palmitate in vitro. Am J Physiol
Endocrinol Metab. 2008;294(5):E898–909.
50. Christiansen T, Richelsen B, Bruun JM. Mono-cyte chemoattractant protein-1 is produced in isolated adipocytes, associated with adiposity and reduced after weight loss in morbid obese subjects. Int J Obes (Lond). 2005;29(1):146–150. 51. Morley TS, Xia JY, Scherer PE. Selective
enhance-ment of insulin sensitivity in the mature adipo-cyte is sufficient for systemic metabolic improve-ments. Nat Commun. 2015;6:7906.
52. McCurdy CE, et al. Attenuated Pik3r1 expression prevents insulin resistance and adipose tissue macrophage accumulation in diet-induced obese mice. Diabetes. 2012;61(10):2495–2505. 53. Shearin AL, Monks BR, Seale P, Birnbaum MJ.
lipodys-trophy. Mol Metab. 2016;5(7):472–479. 54. Huang SC, et al. Metabolic reprogramming
mediated by the mTORC2-IRF4 signaling axis is essential for macrophage alternative activation.
Immunity. 2016;45(4):817–830.
55. O’Neill LA, Pearce EJ. Immunometabolism gov-erns dendritic cell and macrophage function.
J Exp Med. 2016;213(1):15–23.
56. Tan SX, et al. Selective insulin resistance in adi-pocytes. J Biol Chem. 2015;290(18):11337–11348. 57. Takahashi N, et al. Suppression of lipin-1 expres-sion increases monocyte chemoattractant pro-tein-1 expression in 3T3-L1 adipocytes. Biochem
Biophys Res Commun. 2011;415(1):200–205.
58. Kim HB, et al. Lipin 1 represses NFATc4 tran-scriptional activity in adipocytes to inhibit secretion of inflammatory factors. Mol Cell Biol. 2010;30(12):3126–3139.
59. Hirosumi J, et al. A central role for JNK in obesity and insulin resistance. Nature.
2002;420(6913):333–336.
60. Sabio G, et al. A stress signaling pathway in adi-pose tissue regulates hepatic insulin resistance.
Science. 2008;322(5907):1539–1543.
61. Albert V, et al. mTORC2 sustains thermogenesis via Akt-induced glucose uptake and glycoly-sis in brown adipose tissue. EMBO Mol Med. 2016;8(3):232–246.
62. Zebisch K, Voigt V, Wabitsch M, Brandsch M. Protocol for effective differentiation of 3T3-L1 cells to adipocytes. Anal Biochem. 2012;425(1):88–90.
63. Stewart SA, et al. Lentivirus-delivered stable gene silencing by RNAi in primary cells. RNA. 2003;9(4):493–501.
64. Cho KW, Morris DL, Lumeng CN. Flow cytom-etry analyses of adipose tissue macrophages.
Methods Enzymol. 2014;537:297–314.
65. Schindelin J, et al. Fiji: an open-source platform for biological-image analysis. Nat Methods.
2012;9(7):676–682.
66. Wisniewski JR, Zougman A, Nagaraj N, Mann M. Universal sample preparation method for pro-teome analysis. Nat Methods. 2009;6(5):359–362. 67. The UniProt Consortium. UniProt: the
univer-sal protein knowledgebase. Nucleic Acids Res. 2017;45(D1):D158–D169.
68. Tyanova S, et al. The Perseus computational plat-form for comprehensive analysis of (prote)omics data. Nat Methods. 2016;13(9):731–740. 69. Ashburner M, et al. Gene ontology: tool for the
unification of biology. The Gene Ontology Con-sortium. Nat Genet. 2000;25(1):25–29. 70. Gene Ontology C. Gene Ontology Consortium:
going forward. Nucleic Acids Res. 2015; 43(database issue):D1049–D1056.
71. Metsalu T, Vilo J. ClustVis: a web tool for visualiz-ing clustervisualiz-ing of multivariate data usvisualiz-ing Principal Component Analysis and heatmap. Nucleic Acids