ISSN Online: 2160-8806 ISSN Print: 2160-8792
DOI: 10.4236/ojog.2017.711114 Oct. 20, 2017 1132 Open Journal of Obstetrics and Gynecology
How Referred Patients Influence Cesarean
Sections Rate Pattern: Analysis according to
the Robson Classification
Koffi Achille, Kouamé Arthur Didier
*, Kakou Charles, Adjoby Cassou Roland,
Diomande Fatoumata Alice, Kimou Anicet, N’Guessan Koffi Léon Pacome
Obstetrics-Gynecology Department of the University Hospital Center of Cocody, Abidjan, Cote d’Ivoire
Abstract
Objective: To improve the practice of cesarean section by analyzing the cesarean section according to Robson’s classification. Methodology: This was a cross-sectional and descriptive study carried out at the University Hospital of Cocody. It covered the Cesarean sections performed during the year 2015 and ranked according to the 10 groups of Robson. Results: The overall Cesarean section rate in 2015 was 42.8% (3100 cesarean sections for 7229 deliveries). Group 1 was the largest contributor to overall Cesarean section with a rate of 20.5% followed by Group 3 (18.6%), Group 5 (16.4%) and Group 10 (12.2%), unlike other data in the literature where groups were in descending order Groups 5, 1, 3. This difference was driven by medical evacuations and our working conditions. Conclusion: The Cesarean section rate is constantly in-creasing in our department. Referred patients played a huge role in the distri-bution of C-section along the Robson’s 10 groups classification.
Keywords
Cesarean Section, Robson Classification, Evacuation, Referred Patients
1. Introduction
Cesarean section was introduced to save the mother and her baby’s life. 1) [1] Like any surgical intervention, it is associated with short- and long-term risks that can persist for several years after delivery and affect the health of the woman and her baby and subsequent pregnancies. Since 1985, the WHO recommends that the Cesarean section rate should not exceed 10% to 15% for the entire pop-ulation of a country. This rate is currently set at 10% below which the delivery of How to cite this paper: Achille, K., Didier,
K.A., Charles, K., Roland, A.C., Alice, D.F., Anicet, K. and Pacome, N’G.K.L. (2017) How Referred Patients Influence Cesarean Sections Rate Pattern: Analysis according to the Robson Classification. Open Journal of Obstetrics and Gynecology, 7, 1132-1140. https://doi.org/10.4236/ojog.2017.711114
Received: May 17, 2017 Accepted: October 17, 2017 Published: October 20, 2017
Copyright © 2017 by authors and Scientific Research Publishing Inc. This work is licensed under the Creative Commons Attribution International License (CC BY 4.0).
DOI: 10.4236/ojog.2017.711114 1133 Open Journal of Obstetrics and Gynecology Cesarean section no longer contributes to the reduction of maternal and neonat-al mortneonat-ality. 2) [2] Yet, today there is an increase in Cesarean rates in highly medicalized countries [1].
It is true that several publications show the inverse correlation between Cesa-rean section rate and maternal and newborn mortality in a country. However, rates above 10% without net benefit for both mother and child are not accepta-ble, especially for developing countries that are beginning to implement free-of-charge policies for the Cesarean section supported by the taxpayer.
In Côte d’Ivoire, prior to the implementation of the free-form policy, the Ce-sarean rate was 6.4% in 2010 [1]. Being aware of the danger of unnecessary Ce-sarean sections, we decided to monitor the rate of CeCe-sarean section at the ma-ternity of the Cocody University hospital in order to limit the excesses. The Robson classification is an objective tool recommended by the WHO to achieve this goal. Indeed, many studies have been done around the world mainly in de-veloped countries. And authors found that Robson high risk groups are those which are mostly contributing to the rate of C-section in industrialized countries [1][3][4][5]. Is it the same pattern in UHC of Cocody in Côte d’Ivoire?
2. Methodology
2.1. Methods and Patients
We carried out a descriptive cross-sectional study at the maternity of the Uni-versity Hospital Center of Cocody (CHU of Cocody). It took place over a period of one year from 1 January 2015 to 31 December 2015.
All patients that underwent Cesarean section during the study period were in-cluded in the study. All Cesarean sections on pregnancies of less than 28 gesta-tion weeks and/or fetuses weighing less than 1000 grams were excluded from the study.
All Cesarean sections were classified according to groups as described by Robson and recommended by the WHO.
In UHC of Cocody, Cesarean section is free of charge. This hospital is situated at the third level of the health care system in Côte d’Ivoire. UHC of Cocody is surrounded by peripheral maternities which not have the ability to provide C-section when necessary. Therefore, referred patients represent the majority of pregnant women treated in this hospital.
2.2. Variables
Variables necessary for applying the Robson classification that we used were: number of fetus (single or multiple); fetal presentation (cephalic, breech, or transverse); previous obstetric record (parity, uterine scar); onset of labor and delivery (spontaneous, induced, or prelabor C-section); and gestational age at the time of delivery.
We classified patients into the 10 groups described by Robson [5].
DOI: 10.4236/ojog.2017.711114 1134 Open Journal of Obstetrics and Gynecology occupation (Housewife, informal sector, student, owning a wage); parity (0, 1, 2, 3, 4+); pass history of C-section; Admission mode (referred, not referred) and the type of Cesarean section performed (Emergency C-section or Prelabor C-section).
2.3. Operational Definitions
We considered pregnant women into labor when they reached 4 cm of cervical dilatation. Induced labor was defined as the use of any uterotonic drugs (oxyto-cin and protaglandins) in order to initiate the labor. Prelabor C-section group included all patients who underwent C-section before being into labor neither beneficiated from labor induction.
3. Results
3.1. The Cesarean Rate
During the year 2015, 7229 births were delivered at the maternity hospital of the CHU of Cocody. From these deliveries, 3441 caesarean sections were performed with a rate of 47.6%. The criteria of inclusion and non-inclusion allowed us to retain 3200 caesarean sections or a caesarean section rate of 42.8%.
3.2. The Socio-Demographic and Clinical Characteristics
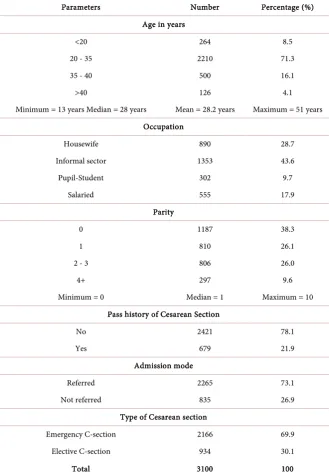
The socio demographic and clinical characteristics are summarized in Table 1. First, the majority of Caesarean patients (73.1%) were evacuated from the pe-ripheral maternity wards. The majority (71.3%) was in the 20 to 35 age group with a median age of 28 years. It was then observed that 43.6% of the Caesarea patients were in the informal sector. These included hairdressing, sewing and small shops. The median parity was 1, and nulliparous were the most represented at 38.3% of cases. These women had a previous Caesarean section in 21.9% of cases. Finally, we found that the rate of emergency caesarean section was 69.9% of the total study population.
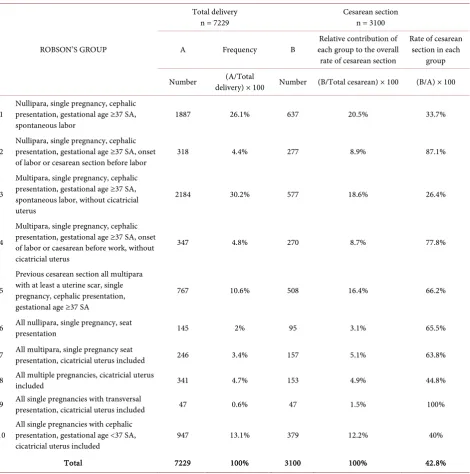
3.3. The Robson Classification Groups (Table 2 & Table 3)
Group 3 (30.2%) and Group 1 (26.1%) accounted for the majority of all delive-ries regardless of the mode of delivery (vaginal or caesarean), with a rate of 56.3%. Robson groups with more caesarean sections were Group 1 (20.5%), Group 3 (18.6%), Group 5 (16.4%) and Group 10 (12.2%) as shown in Table 2. These four groups accounted for 67.8% of caesarean women.
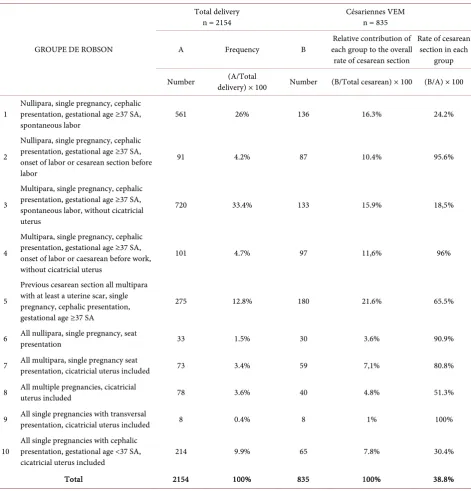
Of the 7729 deliveries performed in the department, 2154 were delivered in patients who were not referred. Among none-referred patients, 835 women un-derwent a caesarean section. In this group, Robson’s classification was as follows in Table 3. The main groups that contributed to the rate of caesarean sections were Group 5 (21.6%) followed by Group 1 (16.3%) and Group 3 (15.9%).
DOI: 10.4236/ojog.2017.711114 1135 Open Journal of Obstetrics and Gynecology
Table 1. Distribution of patients by socio-demographic and clinical characteristics.
Parameters Number Percentage (%)
Age in years
<20 264 8.5
20 - 35 2210 71.3
35 - 40 500 16.1
>40 126 4.1
Minimum = 13 years Median = 28 years Mean = 28.2 years Maximum = 51 years Occupation
Housewife 890 28.7
Informal sector 1353 43.6
Pupil-Student 302 9.7
Salaried 555 17.9
Parity
0 1187 38.3
1 810 26.1
2 - 3 806 26.0
4+ 297 9.6
Minimum = 0 Median = 1 Maximum = 10
Pass history of Cesarean Section
No 2421 78.1
Yes 679 21.9
Admission mode
Referred 2265 73.1
Not referred 835 26.9
Type of Cesarean section
Emergency C-section 2166 69.9
Elective C-section 934 30.1
Total 3100 100
4. Discussion
DOI: 10.4236/ojog.2017.711114 1136 Open Journal of Obstetrics and Gynecology
Table 2. Distribution of patients according to the contribution of Robson’s 10 groups.
ROBSON’S GROUP
Total delivery
n = 7229 Cesarean section n = 3100
A Frequency B each group to the overall Relative contribution of rate of cesarean section
Rate of cesarean section in each
group
Number delivery) × 100 (A/Total Number (B/Total cesarean) × 100 (B/A) × 100
1 Nullipara, single pregnancy, cephalic presentation, gestational age ≥37 SA,
spontaneous labor 1887 26.1% 637 20.5% 33.7%
2 Nullipara, single pregnancy, cephalic presentation, gestational age ≥37 SA, onset
of labor or cesarean section before labor 318 4.4% 277 8.9% 87.1%
3
Multipara, single pregnancy, cephalic presentation, gestational age ≥37 SA, spontaneous labor, without cicatricial uterus
2184 30.2% 577 18.6% 26.4%
4
Multipara, single pregnancy, cephalic presentation, gestational age ≥37 SA, onset of labor or caesarean before work, without cicatricial uterus
347 4.8% 270 8.7% 77.8%
5
Previous cesarean section all multipara with at least a uterine scar, single pregnancy, cephalic presentation, gestational age ≥37 SA
767 10.6% 508 16.4% 66.2%
6 All nullipara, single pregnancy, seat presentation 145 2% 95 3.1% 65.5%
7 All multipara, single pregnancy seat presentation, cicatricial uterus included 246 3.4% 157 5.1% 63.8%
8 All multiple pregnancies, cicatricial uterus included 341 4.7% 153 4.9% 44.8%
9 All single pregnancies with transversal presentation, cicatricial uterus included 47 0.6% 47 1.5% 100%
10 All single pregnancies with cephalic presentation, gestational age <37 SA,
cicatricial uterus included 947 13.1% 379 12.2% 40%
Total 7229 100% 3100 100% 42.8%
DOI: 10.4236/ojog.2017.711114 1137 Open Journal of Obstetrics and Gynecology
Table 3. Distribution according to the contribution of Robson’s 10 groups without referred patients.
GROUPE DE ROBSON
Total delivery
n = 2154 Césariennes VEM n = 835
A Frequency B each group to the overall Relative contribution of rate of cesarean section
Rate of cesarean section in each
group
Number delivery) × 100 (A/Total Number (B/Total cesarean) × 100 (B/A) × 100
1 Nullipara, single pregnancy, cephalic presentation, gestational age ≥37 SA,
spontaneous labor 561 26% 136 16.3% 24.2%
2
Nullipara, single pregnancy, cephalic presentation, gestational age ≥37 SA, onset of labor or cesarean section before labor
91 4.2% 87 10.4% 95.6%
3
Multipara, single pregnancy, cephalic presentation, gestational age ≥37 SA, spontaneous labor, without cicatricial uterus
720 33.4% 133 15.9% 18,5%
4
Multipara, single pregnancy, cephalic presentation, gestational age ≥37 SA, onset of labor or caesarean before work, without cicatricial uterus
101 4.7% 97 11,6% 96%
5
Previous cesarean section all multipara with at least a uterine scar, single pregnancy, cephalic presentation, gestational age ≥37 SA
275 12.8% 180 21.6% 65.5%
6 All nullipara, single pregnancy, seat presentation 33 1.5% 30 3.6% 90.9%
7 All multipara, single pregnancy seat presentation, cicatricial uterus included 73 3.4% 59 7,1% 80.8%
8 All multiple pregnancies, cicatricial uterus included 78 3.6% 40 4.8% 51.3%
9 All single pregnancies with transversal presentation, cicatricial uterus included 8 0.4% 8 1% 100%
10 All single pregnancies with cephalic presentation, gestational age <37 SA,
cicatricial uterus included 214 9.9% 65 7.8% 30.4%
Total 2154 100% 835 100% 38.8%
cord. However, our Caesarean section rates are between 35.2% and 52.1% re-ported by Farghali et al. [10] respectively in two Cairo hospitals (academic and military) in Egypt in 2014. In Tanzania in 2013, Litorp et al. [11] noted a dra-matic increase in the caesarean section rate in a decade from 19% to 49%. The average caesarean rate in this university hospital was 46% during the study pe-riod.
DOI: 10.4236/ojog.2017.711114 1138 Open Journal of Obstetrics and Gynecology Caesarean sections. Litorp et al. [11] in Dar es Salaam-Tanzania also found that Groups 1, 3 and 5 are the largest contributors to the overall caesarean section rate in their university hospitals.
Group 1 (Nullipara with single pregnancy in cephalic presentation, 37 weeks gestation, in spontaneous labor) was the largest contributor to the overall Cae-sarean section rate at 20.5%. The rate of caeCae-sarean section in this group (20.5%) is higher than those observed by Betrán et al. [12] and Kelly et al. [4], who found 12.6% and 13.19% respectively in Latin America and Canada. This difference could be put down to the fact that these are highly medicalized countries and the figures come from statistics at the country and continent levels.
Kazmi et al. [13] in a reference hospital like ours in Iran has found a 13% con-tribution for this group.
Group 3 was the second group with 18.6% of the overall caesarean section. Here, Kazmi et al. [13] noted only 2.6% of caesarean sections in their institution in Iran; a clear difference that could be explained by the different conditions of obstetric practice.
Group 5 (previous Cesarean section, all multiparous with at least one uterine scar, single pregnancy, cephalic presentation, gestational age ≥37 SA) was the third largest contributor to overall cesarean section, with a rate of 16.4% [4]. This accounted for 27.1% and 26.3% respectively.
This group is the first group of Caesarean patients in developed countries due to caesarean sections of convenience, so that obstetric gynecologists find them-selves with many scarred uteruses explaining the high number of cesarean sec-tions in this group. In our department, there are no cesarean secsec-tions of conven-ience. However, elective Cesarean sections for circular cord explain that we have more and more cicatricial uteruses (21.9% in 2015 versus 14.4% in 2003 [6]). This may explains why Group 5 was the third largest provider of caesarean sec-tions.
Group 10 (Unique pregnancy in cephalic presentation <37 weeks of gestation, including women with a previous Cesarean section) is composed of premature deliveries. Its contribution to the overall cesarean section rate was 12.2% [4]. In Canada who had noted 5.6%. The reason mentioned to explain this high rate of cesarean in this group is the status of center of reference of the CHU of Cocody. This situation justifies many in utero transfers of premature to our department.
Thus, in our department, the largest groups contributing to Cesarean section rates are in descending order namely Group 1, Group 3, and Group 5.
DOI: 10.4236/ojog.2017.711114 1139 Open Journal of Obstetrics and Gynecology
5. Conclusion
Unlike highly medicalized countries, low-risk groups are the ones that contri-bute the most to the increase of the overall rate of cesarean section in our de-partment. This difference is due to a high rate of cesarean section in referred pa-tients. Would medical referral be a factor of unnecessarily Cesarean section? Subsequent studies could answer this question.
Limitation of the Article
Patients who involved in this study were mostly referred from peripheral mater-nities which do not have any operating room for Cesarean section practice. So, the selection of those patients for emergency C-section might be led to bias.
References
[1] Gibbons, L., Belizán, J.M., Lauer, J.A., Betrán, A.P., Merialdi, M. and Althabe, F. (2010) The Global Numbers and Costs of Additionally Needed and Unnecessary Caesarean Sections Performed per Year: Overuse as a Barrier to Universal Cover-age. WHO Report, 1-31.
[2] WHO Department of Reproductive Health and Research. (2014) WHO Statement on Caesarean Section Rates. 8 p.
[3] Chung, W.H., Kong, C.W. and To, W.W.K. (2017) Secular Trends in Caesarean Section Rates over 20 Years in a Regional Obstetric Unit in Hong Kong. Hong Kong Medical Journal, 23, 340-347.
[4] Kelly, S., Sprague, A., Fell, D.B., Murphy, P., Aelicks, N. and Guo, Y. (2013) Ex-amining Cesarean Section Rates in Canada Using the Robson Classification System.
Journal of Obstetrics and Gynaecology Canada, 35, 206-214.
https://doi.org/10.1016/S1701-2163(15)30992-0
[5] Robson, M. (2001) Classification of Caesarean Sections. Fetal and Maternal Medi-cine Review, 12, 23-39. https://doi.org/10.1017/S0965539501000122
[6] Abauleth, Y. (1994) Abdominal Cesarean Section: Indication, Techniques and Ma-ternal Risks by the Mode of Admission to the University Hospital Center of Cocody from 1989 to 1991. Thesis, Medical Sciences, University of Cocody-Cote D’Ivoire. [7] Koffi, A., Boni, S., Abauleth, R., Baligrosse, S., Effoh, D., Bohoussou, M., et al.
(2004) Iterative Cesarean Section at Cocody CHU: Indications and Feto-Maternal Prognosis. SAGO, 5, 36-39.
[8] Kopoin, G. (2013) Cesarean and Its Complications at the Maternity of the Univer-sity Hospital of Cocody. Thesis, Université Félix Houphouet Boigny de Cocody, Abidjan.
[9] Ouédraogo, C., Zoungrana, T., Dao, B., Dujardin, B., Ouédraogo, A. and Thiéba, B. (2001) Quality Cesarean Section of in the CHNYO of Ouagadougou. Analysis of Core Determinants of 478 Cases in the Obstetrics Gynecology Department. Medi-cine of Black Africa, 48, 443-451.
[10] Farghali, M.M., Rashed, A.R., Fathi, H., Moustafa, A.M. and Rahman, W.S.A. (2014) The Impact of Non-Clinical Factors on the Rate of Caesarean Section in Egypt. The Medical journal of Cairo University, 82, 215-222.
Deli-DOI: 10.4236/ojog.2017.711114 1140 Open Journal of Obstetrics and Gynecology
veries according to Robson at a University Hospital in Tanzania. BMC Pregnancy Childbirth, 13, 107. https://doi.org/10.1186/1471-2393-13-107
http://www.pubmedcentral.nih.gov/articlerender.fcgi?artid=3655870&tool=pmcent rez&rendertype=abstract
[12] Betrán, A.P., Gulmezoglu, A.M., Robson, M., Merialdi, M., Souza, J.P., Wojdyla, D.,
et al. (2009) WHO Global Survey on Maternal and Perinatal Health in Latin Amer-ica: Classifying Caesarean Sections. Reproductive Health, 6, 18.
http://www.pubmedcentral.nih.gov/articlerender.fcgi?artid=2779175&tool=pmcent rez&rendertype=abstract