Development and Validation of an LC-MS/MS Method for
Quantitative Analysis of Mirtazapine in Human Plasma
Marlus Chorilli1, Rudy Bonfilio1*, Caroline Rossim Louvandini2, Francine Andressa Rosa Madia Gonçalves2, Hérida Regina Nunes Salgado1 1
Departamento de Fármacos e Medicamentos, Faculdade de Ciências Farmacêuticas, Universidade Estadual Paulista Júlio de Mesquita Filho, Rodovia Araraquara-Jaú, Araraquara-SP, Brazil
2
Universidade Metodista de Piracicaba, Rodovia do Açúcar, Piracicaba-SP, Brazil E-mail:*[email protected]
Received June 30, 2011; revised August 2, 2011; accepted August 15, 2011
Abstract
Mirtazapine (MTZ) is an antidepressant drug, which belongs to the chemical class of piperazinoazepines. A liquid chromatography-tandem mass spectrometry (LC-MS/MS) method was developed for the quantifica- tion of MTZ in plasma at the concentrations associated with therapy. Diazepam (DZP) was used as internal standard, added to 200 μL of plasma sample prior to a liquid-liquid extraction using hexane. Chroma- tographic separation was achieved on an Agilent® Eclipse XDB C-18 column (100 × 2.1 mm, 3.5 μm) in iso- cratic mode at 40˚C. Mobile phase was 10 mM ammonium acetate/acetonitrile/formic acid (60/40/0.1, v/v/v) at a constant flow rate of 0.5 mL·min–1. The injection volume was 10 L and the total run time was 3.2 min.
The method shows selectivity and linearity. The detection and quantitation limits were established at 0.17 and 0.50 ng·mL–1, respectively. The extraction recoveries for MTZ and DZP were found to be between 84.9
and 93.9%. The intra-day and inter-day precision and accuracy fulfill at the international acceptance criteria. The method shows to be stable for the studied parameters. Therefore, a rapid, specific, and sensitive LC-MS/MS method for quantification of MTZ in human plasma was developed and can be used in therapeu- tic drug monitoring of this drug.
Keywords: Mirtazapine, High-Performance Liquid Chromatography, Mass Spectrometry, Human Plasma
1. Introduction
Mirtazapine (MTZ) is an antidepressant drug, which be- longs to the chemical class of piperazinoazepines [1]. It seems that MTZ has a dual mode of action: it enhances noradrenergic and 5-HT1A-mediated serotonergic neuro- transmission by acting as an antagonist at the central α2-adrenergic autoreceptors and heteroreceptors as well as by postsynaptic blockade of 5-HT2 and 5-HT3 recep- tors [2]. It is rapidly and well absorbed after oral admini- stration, and is and is extensively metabolized by hepatic cytochrome P450 enzymes (CYP). Its elimination half- life ranges between 20 and 40 h and N-desmethy-lmirta- zapine is the only pharmacologically active metabolite [3-5]. MTZ is administered in a single daily dose, which range between 15 and 45 mg/day, resulting in plasma concentrations between 5 and 100 ng·mL–1 [2]. The drug is used as a racemic mixture of S (+) and R (–) enanti- omers, and the parent compound is responsible for most
of the pharmacological activity of MTZ [6]. Its molecu- lar formula is C17H19N3. The drug has a molecular weight of 265.35 g/mol [7]. The chemical structure of MTZ is shown in Figure1.
[image:1.595.381.464.637.704.2]The literature described several methods for the de- termination of MTZ in biological matrices. These include capillary gas chromatographic methods [8] and high-per- formance liquid chromatography (HPLC) methods [9]. The coupling of HPLC with mass spectrometry (LC- MS/MS) is now generally accepted as the preferred tech- nique for quantitating small molecule drugs, metabolites,
M. CHORILLI ET AL.
and other xenobiotic biomolecules in biological matrices, since this technique is highly selective and sensitive [10, 11]. Due to the increasing importance of speed and reli- ability of analysis in bioanalytical laboratories, a new method for determination of MTZ in human plasma with a short time of analysis (3.2 min) is described in this work. The LC-MS/MS technique was successfully em- ployed to provide a satisfactory sensitivity and selectivity in a desirable time of chromatographic run.
2. Materials and Methods
2.1. Chemical and Reagents
All reagents used were of analytical grade or HPLC grade. Ammonium acetate and formic acid were purchased from Merck® (Darmstadt, Germany). Hexane was used from Vetec® (Rio de Janeiro, Brazil). 0.1 M sodium hy- droxide solution was purchased from Nalgon® (Itupeva, Brasil). Acetonitrile was acquired from J. T. Baker® (Phillipsburg, USA) and Vetec® (Rio de Janeiro, Brazil). MTZ (assigned purity 99.9%) and diazepam (DZP, in- ternal standard, assigned purity 99.9%) were purchased of United States Pharmacopoeia (USP). HPLC grade water was prepared by Milli-Q reverse osmosis (Milli- pore®, Bedford, USA) and meets United States Pharma- copoeia requirements. Modified hydrophilic polytetra- fluoroethylene membranes with a pore size of 0.22 μm were used to filter the mobile phase (Millipore®, Bedford, USA) and Millex® syringe filters hydrophilicpolytetra- fluoroethylene membranes (13 mm, 0.45 μm pore size) from Millipore® (Bedford, USA) were used to filter the samples.
2.2. Equipments
The following equipments were used: vortex mixer Phoenix® model AP 56 (Araraquara, Brazil); analytical balance Mettler Toledo® model XS 205 (Greifensee, Switzerland); ultrasonic bath Branson® model 8510 (Danbury, USA); refrigerated centrifuge Cientec® model CT6000R (Piracicaba, Brazil); sample concentrator Tecnal® model TE-0194 (São Paulo, Brazil); rotary shaker Tecnal® model TE 240 (São Paulo, Brazil). Analyses were ac- quired on a Waters® Alliance HPLC system (Milford, USA) coupled to a Waters® Quattro Premier XE mass spectrometer (Manchester, UK).
2.3. Operating Conditions
Samples were separated on a reversed phase Agilent® Eclipse XDB (Palo Alto, USA) C-18 column (100 × 2.1 mm, 3.5 μm) in isocratic mode. Mobile phase was 10 mM
ammonium acetate/acetonitrile/formic acid (60/40/0.1, v/v/v) at a constant flow rate of 0.5 mL·min–1. The column temperature was kept constant at 40˚C. The injection volume was 10 L and the total run time was 3.2 min. MTZ and DZP were ionized via electrospray ionization (ESI) in positive ion mode. The electrospray source pa- rameters were fixed as follows: electrospray capillary voltage 3.5 kV, source temperature 100˚C and desolva- tion temperature 350˚C. Nitrogen was used in the elec- trospray ionization source. The cone and desolvation gas flows were 50 and 600 L·h−1, respectively. The multiplier voltage was set at 750 V. Cone voltage was set to 30 and 40 V for MTZ and DZP, respectively. The Collison en- ergy was 25 eV for MTZ and 30 eV for DZP. The detec- tion of the ions was performed in the selected reaction monitoring (SRM) mode, monitoring the transition of the precursor ion at m/z 266.2 to the product ion at m/z 195.0 for MTZ, and the transition of the precursor ion at m/z 285.1 to the product ion at m/z 193.5 for DZP.
2.4. Preparation of DZP (Internal Standard)
A stock solution of Internal Standard (IS) was prepared by dissolving 2.48 mg of DZP in acetonitrile and water (50:50, v/v) in a 10 mL volumetric flask. This solution was kept in refrigerator at 2˚C - 8˚C. Working IS solu- tions were prepared by suitably diluting the above-men- tioned stock solution afresh before use.
2.5. Preparation of MTZ Stock Standard and Working Solutions
The MTZ stock solution was prepared by dissolving 2.45 mg of MTZ in 10 mL of acetonitrile and water (50:50, v/v). This solution was kept in refrigerator at 2˚C - 8˚C. The working solutions were obtained by suitably diluting the MTZ stock solution in acetonitrile and water (50:50, v/v).
2.6. Preparation of Calibration Standards and Quality Control (QC) Samples
Eight calibration standards in plasma at concentration of 0.50, 1.51, 10.04, 50.18, 76.27, 100.35, 150.52 and 200.70 ng·mL–1 were prepared by spiking appropriate aliquots of MTZ standard solution (Section 2.5) in plasma. Three levels of QC samples in plasma at a con- centration of 1.51 ng·mL–1 (low), 76.26 ng·mL–1 (me- dium), and 150.52 ng·mL–1 (high) were also prepared and processed following the above method.
2.7. Sample Procedure
in a 15mLFalcon tube, spiked with 40 L of working IS solution at 1.5 g·mL–1 (Section 2.4), and spiked with appropriate aliquots of MTZ standard solution (Section 2.4). To this 50 µl of 0.1 M sodium hydroxide and 5 mL of hexane were added. The mixture was shaken at 180 rpm for 3 min on a shakerfollowed by centrifugation for 2 min at 3500 rpm. The aqueouslayer was frozen in an ice bath. The organic layer was then transferred to a test tube and evaporated to dryness under N2. The resulting residue was reconstituted in 0.2 mL H2O-acetonitrile, 50:50 (v/v), and shaken at 180 rpm for one min on a shaker, and the solu- tion obtained was analyzed by HPLC with MS-MS de- tection.
2.8. Method Validation
The method was validated for selectivity, linearity, ac- curacy, precision, recovery, stability, detection limit and quantitation limit according to the principles of the FDA industry guidance [12].
2.8.1. Selectivity
The selectivity of this method was performed by analyz- ing blank plasma samples obtained from 4 healthy sub- jects, a lipid sample and a hemolyzed sample. In order to test the interference at the retention time of MTZ at quantification limit and DZP (IS) at working concentra- tion, the blank plasma samples, a human plasma sample spiked with mirtazapine at 0.50 ng·mL–1 and a human plasma sample spiked with IS at 100 ng·mL–1 were ana- lyzed according to the methodology described in Section 2.7.
2.8.2. Linearity
The linearity of calibration curve for MTZ was assessed at eight concentration levels in the range of 0.50 - 200.70 ng·mL–1 in plasma samples. Peak area ratios for each solution against its corresponding concentration were measured and the calibration curve was obtained from the least-squares linear regression presented with their corre- lation coefficient.
2.8.3. Detection Limit
The detection limit was estimated from the signal-to- noise ratio. This parameter was defined as the lowest concentration level resulting in a peak area of three times the baseline noise.
2.8.4. Quantitation Limit
The quantitation limit was defined as the lowest concen- tration level that provided a peak area with a signal-to- noise ratio higher than 5, with precision (% CV) within ± 20% and accuracy (% recovery) between 80% and 120%.
2.8.5. Extraction Recovery
The extraction recovery of analyte at three QC samples was determined by measuring the peak area responses from plasma samples spiked with analyte before extrac- tion with those from drug-free plasma samples extracted and spiked with same concentration of analyte after ex- traction. The recovery of IS at concentration of 100 ng·mL−1 was determined in the same way. The recovery of MTZ and IS were determined using five replicates. The extraction recovery at low, medium and high levels of QC samples was obtained according Equation (1):
% PSbe*100%R
PSae
(1)
where: R is extraction recovery, PSbe is the mean value of the peak area responses obtained from plasma samples spiked with analyte before extraction and PSae is the mean value of the peak area responses obtained from plasma samples spiked with analyte after extraction.
2.8.6. Accuracy and Precision
The intra-day data reflects the precision and accuracy of the method under the same conditions within one day. Intra-day accuracy and precision were obtained by ana- lyzing six replicates of three QC samples (low, medium and high levels). Accuracy was determined by the re- gressed (measured) concentration represented as a per- centage of the target (nominal) concentration. The percent relative standard deviation (% RSD) of the regressed (measured) concentrations was used to report precision. The inter-day precision and accuracy were verified by repeating the above procedure at three different occasions.
2.9. Stability
Stability of MTZ in plasma was performed using five replicates of two QC samples at low and high levels. Samples were prepared by spiking drug-free plasma with appropriate volumes of MTZ standard solutions. The stability was evaluated with five studies; stability in in- jection medium, freeze-thaw, short-term and long-term stability as well as standard solution stability, according to described in subsequent sections.
2.9.1. Stability in Injection Medium
The QC samples were processed and stored under ambi- ent conditions (25˚C) in the LC vials intended to be used during routine analysis. At the following time points the samples were analyzed: Initial, 21 hours and 42 hours.
2.9.2. Freeze/Thaw Stability
M. CHORILLI ET AL.
24 hours. Subsequently, the samples were thawed under ambient conditions (25˚C) and then frozen for 12 hours. After three freeze/thaw cycles the samples were proc- essed and analyzed. The results were then compared with those obtained from samples analyzed at initial moment.
2.9.3. Short-Term Stability
The QC samples were kept at ambient temperature (25˚C) for 21 h and then processed and analyzed for short-term stability study. The results were compared with those obtained from samples analyzed at initial moment.
2.9.4. Long-Term Stability
The QC samples were stored at −20˚C for 90 days, then extracted and analyzed for long-term stability study. The results were compared with those obtained from samples analyzed at initial moment.
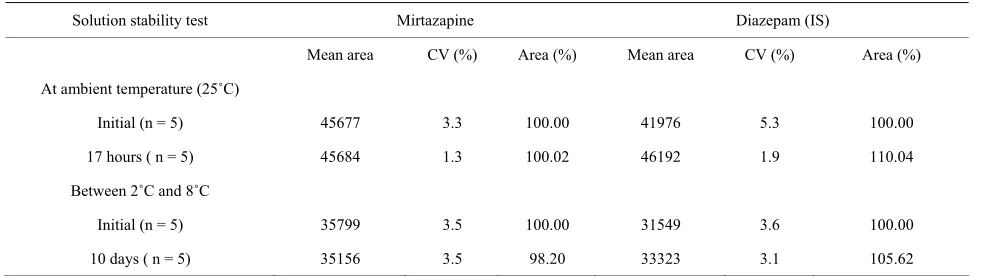
2.9.5. Standard Solution Stability
A MTZ solution at concentration of 10.0 ng·mL–1 and an IS solution at 100.0 ng·mL–1 were prepared from a fresh weighing (Sections 2.4 and 2.5). A portion of the samples was kept at ambient temperature (25˚C) for 17 hours and then analyzed by the proposed method. A second portion of the samples was stored between 2˚C and 8˚C for 10 days and then analyzed. The results were compared with those obtained from samples analyzed at initial moment.
3. Results and Discussion
3.1. Sample Preparation and LC–MS/MS Analysis
The main aim of this work was to develop a rapid, selec- tive and sensitive analytical method including an efficient and reproducible sample clean-up step for quantitative analysis of MTZ in human plasma. Based on our previous experience on optimization of analyses in plasma, sodium hydroxide was added to plasma samples in order to in- crease extraction efficiency, because weak bases as MTZ and DZP are in an undissociated form at neutral or alkaline pH values, resulting in higher extraction efficiency [13,14]. Subsequently, a simple and inexpensive extraction pro- cedure that could be implemented in monitoring labora- tories provided an assay well suited for real time analyses. In optimizing the chromatographic conditions, the ammonium acetate buffer solution was adopted in the mobile phase of the HPLC in order to suppress the tail- ing phenomena of chromatographic peaks of MTZ and DZP. Besides, the concentration of the ammonium ace- tate buffer was investigated and the concentration of 10 mM ammonium acetate made the chromatographic peaks
sharp and symmetric. Further experiment results showed that acidifying the mobile phase with formic acid also contributed to improve peak shapes of MTZ and DZP. Therefore, a concentration of 0.1% formic acid was used in mobile phase. The acceptable retention and separation of MTZ and DZP was obtained by using an elution sys- tem of 10 mM ammonium acetate/acetonitrile/formic acid (60/40/0.1, v/v/v) as the mobile phase. The LC/MS/ MS method described here satisfies the requirement of routine analyses since it has a short run time (3.2 min), which has advantages over other methods described in the literature.
The MS optimization was performed by direct inject- tion of MTZ and DZP into the mass spectrometer. The mass parameters were optimized to obtain better ioniza- tion of MTZ and DZP molecules. The full scan spectrum was dominated by protonated molecules [M+H]+ m/z 266.2 and 285.1 for MTZ and DZP, and the major frag- ment ions observed in each product spectrum were at m/z 195.0 and 193.5, respectively.
3.2. Method Validation
3.2.1. Selectivity
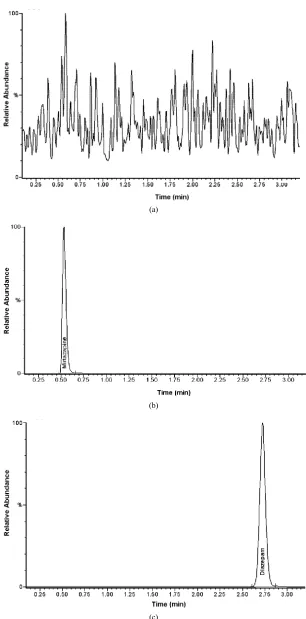
No interference peak was detected for MTZ or IS (Fig- ure2).The acceptance criteria for MTZ had a mean in- terference per batch <20% of the signal at the limit of quantification. The IS had a mean interference of <5% of the signal at the working concentration.
3.2.2. Linearity
The correlation coefficient for MTZ over the concentration range of 0.50 - 200.70 ng·mL–1 was 0.9991. The average slope and intercept of regression equations were 0.0341755 (%CV: 10.37) and 0.0018362 (%CV: 25.83), respectively. Linearity was found to be quite satisfactory and repro- ducible.
3.2.3. Detection Limit
The detection limit for the assay was established as 0.17 ng·mL–1 based on the signal-to-noise ratio (S/N) for 3.
3.2.4. Quantitation Limit
On the basis of a signal-to-noise ratio (S/N) for 5, the quantitation limit for MTZ was found to be 0.50 ng·mL–1. The precision and accuracy at quantitation limit were found to be 9.93 (% CV) and 94.1 (% recovery). These results suggest that MTZ in plasma at the concentrations associated with therapy can be estimated accurately.
3.2.5. Extraction Recovery
The percent recoveries of MTZ and IS are shown in Ta- le 1. The extraction recoveries determined were found b
(a)
(b)
[image:5.595.144.450.70.689.2](c)
Figure 2. Representative mass chromatograms of (a) blank human plasma, (b) human plasma spiked with mirtazapine at uantitation limit (0.50 ng·mL–1) and (c) human plasma spiked with IS (100 ng·mL–1).
M. CHORILLI ET AL.
Table 1. Assay recovery for MTZ and IS.
Mirtazapine Diazepam (IS)
Concentration
(ng·mL–1) Recovery (%) Concentration (ng·mL–1) Recovery (%)
1.51 93.9
76.27 92.7
150.52 84.9
100.00 85.3
to be between 84.9% and 93.9% for MTZ and IS. The precision of the recovery at each concentration level was better than ±20%. Due to this good recovery it was not necessary to improve the extraction procedure described above.
3.2.6. Accuracy and Precision
The intra-day precision and accuracy data for QCs are summarized in Table 2. The international acceptance criteria (CV for precision better than 15% and recovery values for accuracy between 85% and 115%) were met [15].
[image:6.595.310.537.273.352.2] [image:6.595.311.537.378.458.2]The inter-day precision and accuracy data shown in Table 3 also fulfill at the international acceptance crite- ria [15] (CV for precision better than 15% and recovery values for accuracy between 85% and 115%).
3.3. Stability
The processing and storage conditions of clinical samples need to maintain the integrity of a drug or at least keep the variation of pre-analysis as minimal as possible
[16]. For this reason, stability studies play an important role in a bioanalytical method development. In this study, the stability was assessed by considering five parameters; stability in injection medium, freeze-thaw, short-term and long-term stability as well as standard solution stability. The results presented in Tables 4 and 5 show that MTZ is stable under the studied conditions, since in all cases the international acceptance criteria (variation values for area smaller than 15%) were met [16,17].
4. Conclusions
An alternative HPLC/ESI/MS/MS method for quantifica- tion of MTZ in human plasma has been successfully
Table 2. Intra-day precision and accuracy data.
Measured concentration (n = 6) Nominal
con-centration
(ng·mL–1) Mean (ng·mL–1) CV (%) Recovery (%)
1.51 1.47 4.29 97.9
76.27 72.63 7.08 95.2
150.52 154.37 5.42 102.6
Table 3. Inter-day precision and accuracy data.
Measured concentration (n = 18) Nominal
concentration
(ng·mL–1) Mean (ng·mL–1) CV (%) Recovery (%)
1.51 1.48 6.15 98.2
76.27 71.52 5.42 93.8
150.52 147.01 8.67 97.7
Table 4. Stability studies data.
Nominal conc. of 1.51 ng·mL–1 Nominal conc. of 150.52 ng·mL–1 Stability test
Measured concentration (ng·mL–1) CV (%) Area (%) Measured concentration (ng·mL–1) CV (%) Area (%)
Stability in injection medium
Initial (n = 5) 1.50 7.30 100.00 134.09 5.42 100.00
21 hours (n =5) 1.37 13.50 90.97 131.11 4.69 97.78 42 hours (n = 5) 1.46 9.19 97.54 125.86 7.06 93.86
Freeze–thaw stability
Initial (n = 5) 1.50 7.30 100.00 134.09 5.42 100.00 After freeze–thaw cycles 1.64 11.31 109.11 123.39 3.54 92.02
Short-term stability
Initial (n = 5) 1.50 7.30 100.00 134.09 5.42 100.00 21 hours (n = 5) 1.56 7.30 104.08 144.97 7.00 108.11
Long-term stability
[image:6.595.64.539.488.723.2]Table 5. Standard solution stability data.
Solution stability test Mirtazapine Diazepam (IS)
Mean area CV (%) Area (%) Mean area CV (%) Area (%)
At ambient temperature (25˚C)
Initial (n = 5) 45677 3.3 100.00 41976 5.3 100.00
17 hours ( n = 5) 45684 1.3 100.02 46192 1.9 110.04
Between 2˚C and 8˚C
Initial (n = 5) 35799 3.5 100.00 31549 3.6 100.00
10 days ( n = 5) 35156 3.5 98.20 33323 3.1 105.62
developed and validated. A simple and inexpensive liq- uid-liquid extraction procedure and an isocratic chroma- tography condition using a reversed-phase column pro- vided an assay well suited for real time analyses. The method exhibited excellent performance in terms of se- lectivity, linearity, accuracy, precision, recovery, stability, detection limit and quantitation limit.
In addition, the reported method has a short analysis run time, an advantage over previously reported methods. Therefore, this method is suitable for therapeutic drug monitoring of MTZ and can be used in pharmacokinetic or bioequivalence studies of this drug.
5. Acknowledgements
The authors are grateful to FAPESP (São Paulo, Brazil), CNPq (Brasília, Brazil) and PADC/FCF/UNESP (Ara- raquara, Brazil) for research fellowships.
6. References
[1] J. Fawcett and R. L. Barkin, “Review of the Results from Clinical Studies on the Efficacy, Safety and Tolerability of Mirtazapine for the Treatment of Patients with Major Depression,” Journal of Affective Disorders, Vol. 51, No.
3, 1998, pp. 267-285.
doi:10.1016/S0165-0327(98)00224-9
[2] S. A. K. Anttila and E. V. J. Leinonen, “A Review of the Pharmacological and Clinical Profile of Mirtazapine,”
CNS Drug Reviews, Vol. 7, No. 3, 2001, pp. 249-264. doi:10.1111/j.1527-3458.2001.tb00198.x
[3] J. M. Gorman, “Mirtazapine: A Clinical Overview,”
Journal of Clinical Psychiatry, Vol. 60, No. 17, 1999, pp.
9-13.
[4] L. P. C. Delpressine, M. E. G. Moonen, F. M. Kaspersen, G. N. Wagenaars, P. L. Jacobs, C. J. Timmer, J. E. Paanakker, H. J. M. Van Hal and G. Voortman, “Phar- macokinetics and Biotransformation of Mirtazapine in Human Volunteers,” Clinical Drug Investigation,Vol. 15, No. 1, 1998, pp. 45-55.
doi:10.2165/00044011-199815010-00006
[5] C. J. Timmer, J. M. Sitsen and L. P. Delbressine, “Clini- cal Pharmacokinetics of Mirtazapine,” Clinical Pharma- cokinetics, Vol. 38, No. 6, 2000, pp. 461-474.
doi:10.2165/00003088-200038060-00001
[6] L. Delbressine, M.-L. Dahl, H. M. Van den Wildenberg, H. J. Kleijn and L. Bertilsson, “In Vivo Study in Humans on Disposition of the Enantiomers and Metabolites of Mirtazapine,” European Neuropsychopharmacology, Vol.
7, No. 2, 1997, pp. 145-145.
doi:10.1016/S0924-977X(97)88483-0
[7] S. Budavari, M. J. O’Neil, A. Smith and P. E. Heckelman, “The Merck Index, an Encyclopedia of Chemicals, Drugs, and Biologicals,” 11th Edition, Merck & Co, Whitehouse Station, 2001.
[8] J. E. Paanakker and H. J. M. Van Hal, “Capillary Gas Chromatographic Assay for the Routine Monitoring of the Antidepressant Mepirzepine in Human Plasma,”
Journal of Chromatography B, Vol. 417, No. 1, 1987, pp. 203-207.
[9] S. R. Kuchekar, M. L. Kundlik and B. H. Zaware, “Rapid Quantification of Mirtazapine and Desmethyl Mirtazapine in Human Plasma by LC-ESI-MS/MS: Application to a Bioequivalence Study,” Journal of Saudi Chemical Soci- ety, Vol. 15, No. 2, 2011, pp. 145-153.
doi:10.1016/j.jscs.2010.07.001
[10] P. J. Taylor, “Matrix Effects: The Achilles Heel of Quan- titative High-Performance Liquid Chromatography-Elec- trospray-Tandem Mass Spectrometry,” Clinical Bio- chemistry, Vol. 38, No. 4, 2005, pp. 328-334.
doi:10.1016/j.clinbiochem.2004.11.007
[11] R. N. Xu, L. Fan, M. J. Rieser and T. A. El-Shourbagy, “Recent Advances in High-Throughput Quantitative Bioanalysis by LC–MS/MS,” Journal of Pharmaceutical and Biomedical Analysis, Vol. 44, No. 2, 2007, pp.
342-355. doi:10.1016/j.jpba.2007.02.006
[12] FDA, “Guidance for Industry, Bioanalytical Method Validation,” 2001.
http://www.fda.gov/downloads/Drugs/GuidanceComplian ceRegulatoryInformation/Guidances/ucm070107.pdf [13] K. Jinno, M. Taniguchi and M. Hayashida, “Solid Phase
M. CHORILLI ET AL.
ceutical and Biomedical Analysis, Vol. 17, No. 6-7, 1998,
pp. 1081-1091.
doi:10.1016/S0731-7085(98)00074-0
[14] M. H. de Oliveira, M. E. C. Queiroz, D. Carvalho, S. M. Silva and F. M. Lanças, “Determination of Diazepam in Human Plasma by Solid-Phase Microextraction and Cap- illary Gas Chromatography-Mass Spectrometry,” Chro- matographia, Vol. 62, No. 3-4, 2005, pp. 215-219. doi:10.1365/s10337-005-0601-0
[15] V. P. Shah, K. K. Midha, S. Dighe, I. McGilvery, J. P. Skelly, A. Yakobi, T. Layloff, C. T. Viswanathan, C. E. Cook, R. D. McDowall, K. A. Pittman and S. Spector, “Analytical Methods Validation: Bioavailability, Bio-
equivalence, and Pharmacokinetic Studies,” Pharmaceu- tical Research, Vol. 9, No. 4, 1992, pp. 588-592. doi:10.1023/A:1015829422034
[16] L. Du, D. G. Musson and A. Q. Wang, “Stability Studies of Vorinostat and Its Two Metabolites in Human Plasma, Serum and Urine,” Journal of Pharmaceutical and Bio- medical Analysis, Vol. 42, No. 5, 2006, pp. 556-564. doi:10.1016/j.jpba.2006.05.005
[17] FDA, “Guideline for Submitting Samples and Analytical Data for Method Validations,” 1987.

![Table 3The inter-day precision and accuracy data shown in also fulfill at the international acceptance crite- ria [15] (CV for precision better than 15% and recovery values for accuracy between 85% and 115%)](https://thumb-us.123doks.com/thumbv2/123dok_us/9106010.407810/6.595.64.539.488.723/precision-accuracy-fulfill-international-acceptance-precision-recovery-accuracy.webp)