EVALUATION OF DEMINERALIZED FREEZE DRIED ALLOGENIC BONE GRAFT (
AND WITHOUT PLATELET RICH FIBRININ (PRF) IN POST SURGICAL JAW DEFECT:
COMPARATIVE PROSPECTIVE
Anil Kumar Yadav, Iqbal A
T.S. Misra
ARTICLE INFO ABSTRACT
Aims &
demineralized fre (PRF).
defects respectively
implant rejection, mouth opening
week, 6th week, 12 week intervals was done to evaluate the radiodensity of bone formed.
Results
post-operative infection. Different eviden
statistically insignificant while at 6 weeks and 12 weeks it was found to be statistically significant (p<0.001). Evidence of Bone Formation was slight at 3 we
group B at 12 weeks period with statistically significant. Total bridging of gap by normal bone was statistically insignificant at 3 & 6 weeks and statistically significant at 12 weeks time period. Change in total bri
Conclusio
bridging. Also handling, placement and retention qualities of DFDB graft is
Copyright © 2017, Anil Kumar Yadav et al. This is unrestricted use, distribution, and reproduction in any medium,
INTRODUCTION
Oral and maxillofacial bone defect of variable size result from trauma, neoplasm or infectious process. These defects do not fill with bone completely and/or spontaneously. The resultant healed defect tends to be filled with fibrous scar, or stay as unfilled defect. Autogenic bone is currently considered the gold standard in bone grafting because it contains the 3
elements critical to bone remodeling and repair:
Osteoconductivity, Osteoinductivity, Osteogenecity. A graft transferred to the recipient bed adapts in several ways, leading ultimately to incorporation of the graft into the skeletal system of the host .Incorporation refers to the process of envelopment and interdigitation of the graft with new bone deposited by the recipient. Graft constitutes a three dimensional structure into
which sprouting capillaries, perivascular tissue and
osteoprogenitor cells can grow. A fresh autograft provides the structure for this growth (osteoconduction) and in addition, contains osteoinductive protein that stimulate o
Osteogenesis from surviving cells of the donor is characteristic
*Corresponding author: Manish Dubey
T.S. Misra Medical College & Hospital, Lucknow (U.P)
ISSN: 0975-833X
Vol.
Article History:
Received 10th September, 2017
Received in revised form
15th October, 2017
Accepted 19th November, 2017
Published online 27th December, 2017
Citation: Anil Kumar Yadav, Iqbal Ali, Deepak Passi,
graft (dfdb) with and without platelet rich fibrinin (prf) in post surgical jaw defect:
Research, 9, (12), 62613-62621.
Key words:
Demineralized freeze dried allogenic Bone graft (DFDB),
Platelet rich fibrinin (PRF), Osteoconduction, Bone Defect, Calcification.
RESEARCH ARTICLE
EVALUATION OF DEMINERALIZED FREEZE DRIED ALLOGENIC BONE GRAFT (
AND WITHOUT PLATELET RICH FIBRININ (PRF) IN POST SURGICAL JAW DEFECT:
COMPARATIVE PROSPECTIVE STUDY
, Iqbal Ali, Deepak Passi, *Manish Dubey and
Misra Medical College & Hospital, Lucknow (U.P)
ABSTRACT
& Objectives: The aim of the study was to evaluate the healing of the facial bone defect with demineralized freeze dried allogenic bone graft (DFDB) individually
. Materials and Methods: The study comprised of a total of 20 subjec defects divided into two equal groups (A & B) of 10 each. Treated
respectively. Clinical parameters like Post-operative pain (Visual Analog Scale), swelling implant rejection, mouth opening were compared for both groups
week, 6th week, 12 week intervals was done to evaluate the radiodensity of bone formed.
Results: Genderwise, Difference in age, Difference in grades of pain (p=0.368), swelling (p=0.531), operative infection. Different evidence of calcification at 3 weeks
statistically insignificant while at 6 weeks and 12 weeks it was found to be statistically significant (p<0.001). Evidence of Bone Formation was slight at 3 weeks, moderate at 6 weeks and marked in group B at 12 weeks period with statistically significant. Total bridging of gap by normal bone was statistically insignificant at 3 & 6 weeks and statistically significant at 12 weeks time period. Change in total bridging gap by normal bone was statistically significant in both the groups.
Conclusion: DFDB when used with PRF induces early calcification, bone formation and bone bridging. Also handling, placement and retention qualities of DFDB graft is
is an open access article distributed under the Creative Commons medium, provided the original work is properly cited.
Oral and maxillofacial bone defect of variable size result from trauma, neoplasm or infectious process. These defects do not fill with bone completely and/or spontaneously. The resultant healed defect tends to be filled with fibrous scar, or stay as ed defect. Autogenic bone is currently considered the gold standard in bone grafting because it contains the 3
elements critical to bone remodeling and repair:
Osteoconductivity, Osteoinductivity, Osteogenecity. A graft pts in several ways, leading ultimately to incorporation of the graft into the skeletal system of the host .Incorporation refers to the process of envelopment and interdigitation of the graft with new bone deposited by the ree dimensional structure into
which sprouting capillaries, perivascular tissue and
osteoprogenitor cells can grow. A fresh autograft provides the structure for this growth (osteoconduction) and in addition, contains osteoinductive protein that stimulate osteogenesis. Osteogenesis from surviving cells of the donor is characteristic
(U.P)
of fresh cancellous autogeneic bone. Revascularization of the fresh autograft through microanastomoses with pre
microvessels occurs only in a small percentage of the graft area (Prolo & Rodrigo, 1985), and such revascularization is particularly important in cancellous bone
Recent advances in bone cell biolo
extracellular matrix of bone contains active growth and morphogenetic factors that modulate the function of bone cells. Strawich and Glimcher (1983)
and histochemical parameters of chick long bones and bones at various stages of development and found differences in the post-translational modification of collagens of both types of bone, thus highlighting some differences between osteoblasts of different osseous tissues. Platelet
second generation platelet concentrate and is defined as an autologous leukocyte and platelet
Platelet rich fibrin (PRF) is a fibrin matrix in which platelet cytokines, growth factors, and cells are trapped and may be released after a certain time and that can serve as a resorbable
membrane. Have Platelet rich fibrin (PRF) is an enhanced
concentrate of platelets derived from centrifuged blood. Platelet rich fibrin affects cellular activities at genetic and cellular levels. Unlike other platelet concentrates, this
International Journal of Current Research
Vol. 9, Issue, 12, pp.62613-62621, December, 2017
li, Deepak Passi, Manish Dubey and Jaya Bharti, 2017. “Evaluation of demineralized freeze dried allogenic bone ) with and without platelet rich fibrinin (prf) in post surgical jaw defect: Comparative prospective study
EVALUATION OF DEMINERALIZED FREEZE DRIED ALLOGENIC BONE GRAFT (DFDB) WITH
AND WITHOUT PLATELET RICH FIBRININ (PRF) IN POST SURGICAL JAW DEFECT:
li, Deepak Passi, *Manish Dubey and Jaya Bharti
The aim of the study was to evaluate the healing of the facial bone defect with individually and with platelet rich fibrinin The study comprised of a total of 20 subjects with maxillofacial Treated with DFDB and DFDB with PRF operative pain (Visual Analog Scale), swelling, infection, re compared for both groups and Radiographic evaluation at 1 week, 6th week, 12 week intervals was done to evaluate the radiodensity of bone formed.
Genderwise, Difference in age, Difference in grades of pain (p=0.368), swelling (p=0.531), ce of calcification at 3 weeks (p=0.136) shows result statistically insignificant while at 6 weeks and 12 weeks it was found to be statistically significant
eks, moderate at 6 weeks and marked in group B at 12 weeks period with statistically significant. Total bridging of gap by normal bone was statistically insignificant at 3 & 6 weeks and statistically significant at 12 weeks time period. Change
dging gap by normal bone was statistically significant in both the groups.
DFDB when used with PRF induces early calcification, bone formation and bone bridging. Also handling, placement and retention qualities of DFDB graft is improved with PRF.
Commons Attribution License, which permits
of fresh cancellous autogeneic bone. Revascularization of the through microanastomoses with pre-existing microvessels occurs only in a small percentage of the graft area (Prolo & Rodrigo, 1985), and such revascularization is particularly important in cancellous bone (Prolo, 1985). Recent advances in bone cell biology recognizes that the extracellular matrix of bone contains active growth and morphogenetic factors that modulate the function of bone cells. carefully compared histological and histochemical parameters of chick long bones and cranial bones at various stages of development and found differences translational modification of collagens of both types of bone, thus highlighting some differences between osteoblasts of different osseous tissues. Platelet- rich fibrin is a second generation platelet concentrate and is defined as an autologous leukocyte and platelet-rich fibrin biomaterial. Platelet rich fibrin (PRF) is a fibrin matrix in which platelet cytokines, growth factors, and cells are trapped and may be er a certain time and that can serve as a resorbable Have Platelet rich fibrin (PRF) is an enhanced concentrate of platelets derived from centrifuged blood. Platelet rich fibrin affects cellular activities at genetic and other platelet concentrates, this
INTERNATIONAL JOURNAL OF CURRENT RESEARCH
Evaluation of demineralized freeze dried allogenic bone
technique does not require any gelifying agent, but not more than centrifugation of the natural blood without additives (Gaultier, 2004). PRF attempts to accumulate platelets and released cytokines in a fibrin clot. Cytokines are immediately used and destroyed in a healing wound. The harmony between cytokines and their supporting fibrin matrix has much more unique importance than any other constant (Dohan). The clinical experience also confirms that PRF can be considered a healing biomaterial, as it features all the necessary parameters permitting optimal wound healing. It already has a list of intraoral applications, and numerous extraoral applications can also be imagined. PRF can be used for all types of superficial cutaneous and mucous healing (Harish Saluja, 2014). In this present study we have tried to evaluate the neoangiogentic potentials of the cytokiene and growth factors PRF on the non vascularised allogenous graft, as DFDB. We hope that demineralized allograft bone has many of the desirable attributes of autograft bone. The particulate demineralized bone matrix (DBM) is frequently combined with other components intended to make the DBM easier to handle in a clinical setting .the demineralization process exposes the collagen and native growth factors, including the naturally occurring spectrum of BMPs, present within human bone which have been shown to provide the osteoinductive properties of these material (Simon, 2009).
MATERIALS AND METHODS
The present study comprised of an adequate number of patients attending the O.P.D of Career Post Graduate Institute of Dental Sciences & Hospital Dental College, Ram Manohar Lohia Awadh University, Lucknow. Inclusion criteria were Healthy individuals in the age group of 19-60 years. Platelet count
more than 1,50,000/mm3 . Exclusion criteria were Subjects
with any underlying systemic disease or compromised immunity , Pregnant and lactating women . The case selection was be done irrespective of sex, caste, religion and socioeconomic status. A pre-operative assessment of the patients comprised of a detailed medical and dental history, clinical and radiographic evaluation and hematological investigations to establish the clinical condition of patients. After pre-operative evaluation and obtaining the written informed consent, all patients included in the study were be categorized randomly into two groups:
Group A (Control group): Bone Defect receiving only
Demineralised Freeze Dried Bone Graft. [Figure 1]
Group B (Experimental group): Bone Defect
receiving Demineralised Freeze Dried Bone Graft along with PRF. [Figure 2]
Pre-operatively intraoral periapical X - rays was be taken for each patient. Occlusal and O.P.G views were be taken as and when required. Oral prophylaxis of all patients to improve their oral hygiene and reduce chances of post-operative infection were carried out. Decalcified freeze dried, irradiated bone
allograft material DFDBA (500 - 1000μ m particle size) was
procured from - TATA MEMORIAL HOSPITAL TISSUE BANK, Mumbai, Under Strict Aseptic technique the pathological cavity were explored and curetted out of its lining and granulation tissue. Adequate toileting of wound were done with normal saline solution followed by packing the defect with the bone graft alone in Group A, while in Group B bone graft along with PRF was done. Closure of wound was
[image:2.595.316.553.93.319.2]achieved by interrupted sutures using 3-0 black silk with cutting needle
Figure 1. Intraoperative view of placement of Demineralised Freeze Dried Bone Graft in bony defect (Group A)
Figure 2. Intraoperative view of placement of Demineralised Freeze Dried Bone Graft along with PRF in bony defect
(Group B)
Method for Preparation of PRF: 10 ml of whole venous
[image:2.595.322.548.371.601.2]Placement of DFDBA: Required quantity of DFDBA was transferred to the dappen dish and mixed with normal saline. The cohesive mass was then transferred in increments to the defect site and condensed lightly to completely fill the bony defect.
Placement of DFDBA and PRF: DFDB was mixed with the
extracted PRF & packed into the defect in increments. A final layer PRF was adapted over the entire defect so as to cover 2–3 mm of the surrounding defect site and to ensure stability of the graft material. The mucoperiosteal flap was placed over the membrane and sutured with silk suture (3-0). Sutures were be
removed on the 7th post operative day. Patients were evaluated
[image:3.595.54.274.248.423.2]and compared preoperatively, immediately post operatively, at the end of three week, six week and 12 week interval. [Figure 3 & 4]
[image:3.595.46.279.468.719.2]Figure 3. Post operative radiographs showing bony healing at three week, six week and 12 week interval (Group A)
Figure 4. Post operative radiographs showing bony healing at three week, six week and 12 week interval (Group B)
Criteria of post-operative follow up
Clinical evaluation was done as- Post-op pain (Visual Analog
Scale), Post-op swelling , Signs of infection, Signs of implant
rejection, Measurement of inter-incisal distance to evaluate
pre-operative and post-operative mouth opening using a divider and scale.
Radiographic evaluation: In all the post-operative cases
intraoral periapical X-rays would be taken at 1week, 6th week,
12 week intervals to evaluate the radiodensity of bone. A measuring grid of 1x1 mm size squares on a transparent sheet was used for measurement of osseous defect by placing grid over the radiograph. The alveolar bone loss/gain was measured by counting the number of squares overlapping the defect at different follow ups. Squares which were half filled with bone were not counted. Percentage was calculated using following formula:
% = Sq overlapping initial defect – sq overlapping the defects at different follow ups X 100 Sq overlapping initial defect
Evidence of calcification (evident by increased
radiodensity)
+ slight evidence of calcification
+ + moderate degree of calcification
+ + + marked degree of calcification
First evidence of bone formation (evident by formation of trabecular pattern)
+ slight evidence of trabecular pattern + + moderate degree of trabecular pattern + + + marked degree of trabecular pattern
Total bridging of gap by normal bone
+ < 25 % defect bridged by bone (seen at the periphery of the
defect)
+ + 25 – 50 % of defect bridged by bone.
+ + + > 50 % of defect bridged by bone.
RESULTS
A total of 20 patients with maxillofacial defects fulfilling the inclusion criteria were enrolled in the study. Out of these, 10 cases were treated with use of DFDB and other 10 were treated with use of DFDB with PRF. Though proportion of patients with lower age (Upto 30) was higher in Group B as compared to Group A and propotion of patients with higher age was found to be higher in Group A as compared to Group B. Difference in age of both the groups was not found to be statistically significant [Table 1]. In the present study, a total of 7 females and 13 males were enrolled. Group A constituted of 4 (40.0%) females and 6 (60.0%) males while Group B constituted of 3 (30.0%) females and 7 (70.0%) males. Genderwise no statistically significant difference in both the groups was found.
Table 1. Comparison of Age Between Groups
Age Group (years)
Total Group A (n=10) Group B
(n=10)
Statistical Significance
No. % No. % 2 p
Upto 20 8 3 30.00 5 50.00 3.833 0.147
21-30 6 2 20.00 4 40.00
31-40 3 2 20.00 1 10.00
[image:3.595.308.558.714.787.2]In the present study, majority (n=18; 90.0%) of patients did not complain of post-operative pain. No pain was observed by majority of patients of both the groups (90.0%) each while 1 (10.0%) patient of Group B suffered with mild pain and 1 (10.0%) of Group A suffered with moderate pain. Difference in proportion of patients suffering different grades of pain was not found to be statistically significant (p=0.368). Though rank of pain in Group A (105.50) was found to be higher than that of Group B (104.50) but this difference was not found to be statistically significant (p=0.942). [Table 2]
Table 2. Comparison of Post-operative Pain Between Groups
Post-Operative Pain
Total Group A
(n=10)
Group B (n=10)
Statistical Significance
No. % No. % 2 p
No 18 9 90.00 9 90.00 2.000 0.368
Mild 1 0 0.00 1 10.00
Moderate 1 1 10.00 0 0.00
Group N Mean
Rank
Sum of Ranks
Statistical significance (Mann-Whitney U test)
Z p
Group A 10 10.55 105.50 0.073 0.942
Group B 10 10.45 104.50
Total 20
[image:4.595.302.561.212.329.2]In the present study, majority (n=17; 85.0%) of patients did not complain of post-operative Swelling. No swelling was observed by majority of patients of both the groups though no swelling was found in higher proportion of Group A (90.0%) as compared to Group B (80.0%), rest of the patients in both the groups suffered mild post-operative swelling. Difference in proportion of patients suffering different grades of swelling was not found to be statistically significant (p=0.531).Though rank of swelling in Group B (110.00) was found to be higher than that of Group A (100.50) but this difference was not found to be statistically significant (p=0.542).[Table 3]
Table 3. Comparison of Post-operative Swelling Between Groups
Post-Operative Swelling
Total Group A
(n=10)
Group B (n=10)
Statistical Significance
No. % No. % 2 p
No 17 9 90.00 8 80.00 0.392 0.531
Mild 3 1 10.00 2 20.00
Group N Mean
Rank
Sum of Ranks
Statistical significance (Mann-Whitney U test)
Z p
Group A 10 10.00 100.00 0.610 0.542
Group B 10 11.00 110.00
Total 20
No post-operative infection was found in any of the cases included in the study. Hence, no difference in prevalence of post-operative infection in both the groups was found. In none of the cases, implant was rejected. [Table 4]
Table 4. Comparison of Post-operative Infection Between Groups
Post-Operative
Infection
Total Group A
(n=10)
Group B (n=10)
Statistical Significance
No. % No. % 2 p
No 20 10 100.00 10 100.00 0.000 1.000
At follow up at 3 weeks, slight evidence of calcification was observed in majority (n=18; 90.0%) of patients while in rest of the patients (10.0%) moderate degree of evidence of
[image:4.595.302.563.485.624.2]calcification was observed.. Slight evidence of calcification was observed in all the patients of Group A (100.0%) while it was found in only 8 (80.0.0%) patients of Group B, in rest of the 2 (20.0%) cases of Group B moderate evidence of calcification was observed. Difference in proportion of patients in both the groups with different evidence of calcification was not found to be statistically significant (p=0.136). Though rank of evidence of calcification in Group A (115.00) was found to be higher than that of Group A (95.00) but this difference was not found to be statistically significant (p=0.146). [Table 5]
Table 5. Comparison of Evidence of Calcification at 3 weeks Between Groups
Evidence of Calcification
Total Group A
(n=10)
Group B (n=10)
Statistical Significance
No. % No. % 2 p
Slight 18 10 100.00 8 80.00 2.222 0.136
Moderate 2 0 0.00 2 20.00
Evidence of Calcification
Total Group A (n=10) Group B
(n=10)
Statistical Significance
No. % No. % 2 p
Slight 18 10 100.00 8 80.00 2.222 0.136
Moderate 2 0 0.00 2 20.00
At follow up at 6 weeks, slight evidence of calcification was observed in all the patients of Group A (100.0%) and none of the patients of Group B. In all the patients of Group B evidence of calcification was either moderate (80.0%) or marked (20.0%). Difference in proportion of patients in both the groups with different evidence of calcification was found to be statistically significant (p<0.001). Rank of evidence of calcification in Group B (155.00) was found to be significantly higher than that of Group A (55.00) [Table 6].
Table 6. Comparison of Evidence of Calcification at 6 weeks Between Groups
Evidence of Calcification
Total Group A
(n=10)
Group B (n=10)
Statistical Significance
No. % No. % 2 p
Slight 10 10 100.00 0 0.00 20.000 <0.001
Moderate 8 0 0.00 8 80.00
Marked 2 0 0.00 2 20.00
Group N Mean
Rank
Sum of Ranks
Statistical significance (Mann-Whitney U test)
Z p
Group A 10 5.50 55.00 4.194 <0.001
Group B 10 15.50 155.00
Total 20
[image:4.595.31.292.717.761.2]also similar to that change observed between 3 weeks to 12 weeks. In Group B, a statistically significant change in evidence of calcification was observed between 3 weeks to 6 weeks (p=0.002). Change in evidence of calcification between 3 weeks to 12 weeks was also found to be statistically significant and change between 6 weeks and 12 weeks was also found to be statistically significant. [Table 8]
In both the groups, slight evidence of bone formation was found in all the cases. [Table 9].
Table 9. Comparison of Evidence of Bone Formation at 3 weeks Between Groups
At 6 weeks of follow up in both the groups, moderate evidence of bone formation was found in all the cases. [Table 10]. At 12 weeks of follow up, in all the patients of Group A, moderate evidence of bone formation was found while in all the cases of Group B, marked evidence of bone formation was observed. Difference in evidence of bone formation in both the groups was found to be statistically significant. Rank of evidence of bone formation in Group B (155.00) was found to be higher than that of Group A (55.00) and this difference was found to be statistically significant (p<0.001). [Table 11]
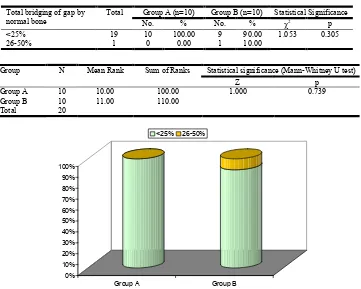
At follow up at 3 weeks, <25% total bridging of gap by normal bone was observed all the patients of Group I (100.0%) and in 9 (90.0%) of patients of Group B in rest 1 (10.0%) patient of Group B total bridging of gap by normal bone was found to be
[image:5.595.124.478.169.219.2]26-50%. Difference in proportion of patients with different levels of bridging of gaps was not found to be statistically significant (p=0.305). Though rank of Total bridging of gap by normal bone in Group B (110.00) was found to be higher than that of Group A (100.00) but this difference was not found to be statistically significant. [Table 12]
Table 10. Comparison of Evidence of Bone Formation at 6 weeks Between Groups
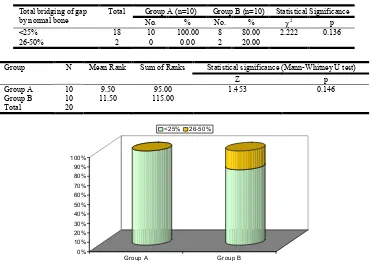
At follow up at 6 weeks, <25% total bridging of gap by normal bone was observed all the patients of Group A (100.0%) and in 8 (80.0%) of patients of Group B in rest 2 (20.0%) patient of Group B total bridging of gap by normal bone was found to be 26-50%. Difference in proportion of patients with different levels of bridging of gaps was not found to be statistically
significant (p=0.136).Though rank of Total bridging of gap by
normal bone in Group B (115.00) was found to be higher than that of Group A (95.00) but this difference was not found to be statistically significant. [Table 13]. At follow up at 12 weeks, <25% total bridging of gap by normal bone was observed all the patients of Group A (100.0%) while in all the patients of Group B total bridging of gap by normal bone was found to be 26-50%. Difference in proportion of patients with different levels of bridging of gaps was found to be statistically significant (p<0.001).
0% 10% 20% 30% 40% 50% 60% 70% 80% 90% 100%
Group A Group B
Slight Moderate Marked
0% 10% 20% 30% 40% 50% 60% 70% 80% 90% 100%
Group A Group B
Slight Moderate Marked
Table 7. Comparison of Evidence of Calcification at 12 weeks Between Groups
Group N Mean Rank Sum of Ranks Statistical significance (Mann-Whitney U test)
Z p
Group A 10 5.50 55.00 4.359 <0.001
Group B 10 15.50 155.00
[image:5.595.254.547.256.569.2]Total 20
Table 8. Intragroup Change in Evidence of Calcification (Wilcoxon Signed Ranks Test)
Group A Group B
No. Mean ranks Sum of Ranks Statistical
signi-ficance
No. Mean ranks
Sum of
Ranks
Statistical signi-ficance
3 weeks to 6 weeks -ve ranks 0 0 0 Z=0.000;
p=1.000
0 0 0 Z=-3.162;
p=0.002
+ve ranks 0 0 0 10 5.5 55
Ties 10 0
Total 10 10
3 weeks to 12 weeks -ve ranks 0 0 0 Z=-3.162;
p=0.002
0 0 0 Z=-2.972;
p=0.003
+ve ranks 10 5.5 55 10 5.5 55
Ties 0 0
Total 10 10
6 weeks to 12 weeks -ve ranks 0 0 0 Z=-3.162;
p=0.002
0 0 0 Z=-2.828;
p=0.005
+ve ranks 10 5.5 55 8 4.5 36
Ties 0 2
[image:5.595.52.284.446.596.2]Rank of total bridging of gap by normal bone in Group B (155.00) was found to be significantly higher than that of Group A (55.00) and this difference was found to be statistically significant (p<0.001). [Table 14]. In Group A, change in total in total bridging gap by normal bone between 3 weeks to 6 weeks was found to be statistically significant, no further change in total in total bridging gap by normal bone was found between 6 weeks and 12 weeks, hence change between 3 weeks to 12 weeks was also similar to that change observed between 3 weeks to 6 weeks. In Group B, a statistically significant change in total in total bridging gap by
normal bone wasobserved between 3 weeks to 6 weeks (p=0.002). Change in total in total bridging gap by normal bone between 3 weeks to 12 weeks was also found to be statistically significant and change between 6 weeks and 12 weeks was also found to be statistically significant. [Table 15]
DISCUSSION
[image:6.595.142.494.80.341.2]A Total of 20 patients with maxillofacial defects fulfilling the inclusion criteria were enrolled in the study. Out of these, 10 cases were treated with use of DFDB and other 10 were treated
Table 11. Comparison of Evidence of Bone Formation at 12 weeks Between Groups
Evidence of Bone Formation
Total Group A (n=10) Group B (n=10) Statistical Significance
No. % No. % 2 p
Moderate 10 10 100.00 0 0.00 20.000 <0.001
Marked 10 0 0.00 10 100.00
Evidence of Bone Formation
Total Group A (n=10) Group B (n=10) Statistical Significance
No. % No. % 2 p
Moderate 10 10 100.00 0 0.00 20.000 <0.001
Marked 10 0 0.00 10 100.00
Table 12. Comparison of Total bridging of gap by normal bone at 3 weeks
Total bridging of gap by normal bone
Total Group A (n=10) Group B (n=10) Statistical Significance
No. % No. % 2 p
<25% 19 10 100.00 9 90.00 1.053 0.305
26-50% 1 0 0.00 1 10.00
Group N Mean Rank Sum of Ranks Statistical significance (Mann-Whitney U test)
Z p
Group A 10 10.00 100.00 1.000 0.739
Group B 10 11.00 110.00
Total 20
0% 10% 20% 30% 40% 50% 60% 70% 80% 90% 100%
Group A Group B
Slight Moderate Marked
0% 10% 20% 30% 40% 50% 60% 70% 80% 90% 100%
Group A Group B
[image:6.595.128.489.366.655.2]Table 13. Comparison of Total bridging of gap by normal bone at 6 weeks
Total bridging of gap by normal bone
Total Group A (n=10) Group B (n=10) Statistical Significance
No. % No. % 2 p
<25% 18 10 100.00 8 80.00 2.222 0.136
26-50% 2 0 0.00 2 20.00
Group N Mean Rank Sum of Ranks Statistical significance (Mann-Whitney U test)
Z p
Group A 10 9.50 95.00 1.453 0.146
Group B 10 11.50 115.00
[image:7.595.96.509.361.606.2]Total 20
Table 14. Comparison of Total bridging of gap by normal bone at 12 weeks
Total bridging of gap by normal bone Total Group A (n=10) Group B (n=10) Statistical Significance
No. % No. % 2 p
<25% 10 10 100.00 0 0.00 20.000 <0.001
26-50% 10 0 0.00 10 100.00
Total bridging of gap by normal bone Total Group A (n=10) Group B (n=10) Statistical Significance
No. % No. % 2 p
<25% 10 10 100.00 0 0.00 20.000 <0.001
26-50% 10 0 0.00 10 100.00
Table 15. Intragroups Change in Total Bridging Gap by normal bone (Wilcoxon Signed Ranks Test)
Group A Group B
No. Mean
ranks
Sum of Ranks
Statistical signi-ficance
No. Mean
ranks
Sum of Ranks
Statistical signi-ficance
3 weeks to 6 weeks -ve ranks 0 0 0 Z=-3.162;
p=0.002
0 0 0 Z=-3.162;
p=0.002
+ve ranks 0 5.5 55 10 5.5 55
Ties 10 0
Total 10 10
3 weeks to 12 weeks -ve ranks 0 0 0 Z=-3.162;
p=0.002
0 0 0 Z=-2.972;
p=0.003
+ve ranks 10 5.5 55 10 5.5 55
Ties 0 0
Total 10 10
6 weeks to 12 weeks -ve ranks 0 0 0 Z=0.000;
p=1.000
0 0 0 Z=-2.828;
p=0.005
+ve ranks 10 0 0 8 4.5 36
Ties 0 2
Total 10 10
0% 10% 20% 30% 40% 50% 60% 70% 80% 90% 100%
Group A Group B
<25% 26-50%
0% 10% 20% 30% 40% 50% 60% 70% 80% 90% 100%
Group A Group B
[image:7.595.85.511.637.781.2]with use of DFDB with PRF. Thus 50% subjects were equally distributed in the 2 groups. Difference in age of both the groups was not found to be statistically significant. Genderwise no statistically significant difference in both the groups was found. In the present study, majority of patients did not complain of post-operative pain. No pain was observed by majority of patients of both the groups each while patient of Group B suffered with mild pain and 1 of Group A suffered with moderate pain. Difference in proportion of patients suffering different grades of pain was not found to be statistically significant. Since effective pain control was strived for both intraoperative and postoperative this finding is consistent with our percaution. In the present study, majority of patients did not complain of post-operative Swelling. No swelling was observed by majority of patients of both the groups though no swelling was found in higher proportion of Group A as compared to Group B , rest of the patients in both the groups suffered mild post-operative swelling. Difference in proportion of patients suffering different grades of swelling was not found to be statistically significant. According to Micheal Toffler (2009). First, the fibrin clot plays an important mechanical. Role, with the PRF membrane maintaining and protecting the grafted biomaterials and PRF fragments serving as biological connectors between bone particles. Second, the integration of this fibrin network into the regenerative site facilitates cellular migration, particularly for endothelial cells necessary for the neoangiogenesis, vascularization and survival of the graft.
Third, the platelet cytokines (PDGF, TGF-β, IGF-1) are gradually released as the fibrin matrix is resorbed, thus creating a perpetual process of healing. Lastly, the presence of leukocytes and cytokines in the fibrin network can play a significant role in the self-regulation of inflammatory and
infectious phenomena within the grafted material.
No post-operative infection was found. The above can be attributed to the strict aseptic technique followed intra operative and post-opertive antibiotic coverage. At follow up at 3 weeks, slight evidence of calcification was observed in majority of patients while in rest of the patients moderate degree of evidence of calcification was observed. Slight evidence of calcification was observed in all the patients of Group A while it was found in only 8 patients of Group B, in rest of the 2 cases of Group B moderate evidence of calcification was observed. Difference in proportion of patients in both the groups with different evidence of calcification was not found to be statistically significant. Since it is too early in followup. Marked calcification is not expected. At follow up at 6 weeks, slight evidence of calcification was observed in all the patients of Group A and none of the patients of Group B. In all the patients of Group B evidence of calcification was either moderate or marked. Difference in proportion of patients in both the groups with different evidence of calcification was found to be statistically significant.
Rank of evidence of calcification in Group B was found to be significantly higher than that of Group A. In Group A, no change in evidence of calcification was found between 3 weeks and 6 weeks while change in evidence of calcification between 3 weeks to 12 weeks was found to be statistically significant. At 12 weeks of follow up, in all the patients of Group A, moderate evidence of bone formation was found while in all the cases of Group B, marked evidence of bone formation was observed. Difference in evidence of bone formation in both the groups was found to be statistically
significant. This is consistent with SIMON et al. (2009) who
studied the prolonged presence of growth factors in the healing sites which may be the most significant factor that causes the much more rapid healing in the extraction sockets grafted with PRFM alone noted in this investigation. However, the prolonged presence of non-vital DFDBA particles and the accompanying inflammatory infiltrate noted during the healing through 12- weeks, was undoubtedly also a significant reason for delayed healing in the sockets where that material was used. Sites treated with PRFM alone had complete osseous fill of the extraction socket in 3 weeks, while sites treated with non-vital DFDBA still did not exhibit complete fill after 12 weeks. The fact that these DFDBA particles created an inflammatory/ foreign body reaction during healing of sockets has been reported in many studies histologically evaluated human osseous graft cores and concluded that the over-riding histological l characteristic of sites grafted with DFDBA or MFDBA was the retention of non-vital graft particles encapsulated with fibrous connective tissue. They suggested that the elimination of the nonvital bone particles from the wound was accomplished by macrophages or giant cells (foreign body reaction) or by sequestration, similar to the reactions observed in this investigation, not by resorption..and probably attributed to PRF. Also in agreement with
INCHINGOLO et al. (2010).
At follow up at 3 weeks, <25% total bridging of gap by normal bone was observed all the patients of Group I and in 9 of patients of Group B in rest 1 patient of Group II total bridging of gap by normal bone was found to be 26-50%. Difference in proportion of patients with different levels of bridging of gaps was not found to be statistically significant. Since the graft incorporation is a centripetal phenomena and osteogenic factor are already positive at the defect marginal host bone, this finding is not inconsistent. At follow up at 12 weeks, <25% total bridging of gap by normal bone was observed all the patients of Group I (100.0%) while in all the patients of Group B total bridging of gap by normal bone was found to be 26-50%. Difference in proportion of patients with different levels of bridging of gaps was found to be statistically significant. The difference could be attributed to the simenstaeneous osseoclastic activity induced by our PRF leading to Bone scar remodeling. Rank of total bridging of gap by normal bone in Group B was found to be significantly higher than that of Group A and this difference was found to be statistically
significant in agreement GILBERTO ET AL (2009) 8 who
showed that although clinical results from the comparison of
PRP alone versus PRP and resorbable membrane can be considered similar, from a histologic point of view, the association of PRP to Bio-Gide membrane showed earlier signs of bone maturation but not a higher grade of bone regeneration. In Group A, change in total in total bridging gap by normal bone between 3 weeks to 6 weeks was found to be statistically significant, no further change in total in total bridging gap by normal bone was found between 6 weeks and 12 weeks, hence change between 3 weeks to 12 weeks was also similar to that change observed between 3 weeks to 6
weeks. These finding are in unison with MAZOR et al. (2009)
factor provider. (PAL et al.2012) as well as a biomembrane
(GUPTA et al.2011) thus helping first in implant host
integration and later in bone maturation BOLUKBASI et al.
(2013) and SARAVANAKUMAR (2014).
Conclusion
Bony defect secondary to maxillofacial pathology removal, are often filled with bone substitutes. Although a plethora of options are available, the search for an ideal substitute continues. PRF is the newest autologous harvested osteoconductive material which when mixed with DFDB accelerate the healing and maturation process of the bone. Our study to evaluate the healing potential quality &stability of DFDB & DFDB with PRF yielded the results that DFDB is a predictable homologous graft material which is less expensive than synthetic material and easily available. Incorporation of PRF in DFDB results in earlier calcification and bone formation when compared with DFDB alone. Also, bone bridging is faster when PRF is incorporated in DFDB. Handling, placement and retention of graft is comparatively better when PRF is used along with DFDB.
Source of Support: Nil
Conflict of Interest: None Declare
REFERENCES
Dohan, D.M., Choukroun, J., Diss, A., Dohan, S.L., Dohan,
A.J., Mouhyi, J. et al. Platelet-rich fibrin (PRF): A
second-generation platelet concentrate.
Gaultier, F., Navarro, G., Donsimoni, J.M., Dohan, D. 2004. [Platelet concentrates. A Part 3: Clinical applications.] Implantodontie;13:
Gilberto Sammartino, et al. 2009. Platelet-Rich Plasma and
Resorbable Membrane for Prevention of Periodontal Defects After Deeply Impacted Lower Third Molar Extraction.
Harish Saluja, et al. 2014. 2014. Platelet-Rich fibrin. A second
generation platelet concentrate and a new friend of oral and maxillofacial surgeons.
Inchingolo, F. et al. 2010. Trial with Platelet-Rich Fibrin and
Bio-Oss used as grafting materials in the treatment of the severe maxillar bone atrophy: clinical and radiological evaluations.
Michael Toffler, et al. 2009. Introducing Choukroun’s Platelet
Rich Fibrin (PRF) to the Recontructive Surgery Milieu, 2009.
Nilufer Bolukbasi et al. 2013. The Use of Platelet-Rich Fibrin
in Combination With Biphasic Calcium Phosphate in the
Treatment of Bone Defects: A Histologic and
Histomorphometric Study.
Prolo, D.J. and Rodrigo J.J. 1985. Contemporary bone graft
physiology and surgery. Clinical Orthopedics and Related
Research, 200: 322-342.
Saravanakumar, B. and A. Julius et al. 2014. Therapeutic
Effects and Concepts in the use of Platelet-Rich Fibrin (PRF) on alveolar Bone Repair- A Literature Review.
Simon, B.J. et al: 2009. Clinical and Histopathological
Comaparison of Extraction Socket Healing Following the Use of Autologous Platelet-Rich Fibrin Matrix(PRFM) to Ridge Preservation Procedures Employing Demineralized Freeze Dried Bone Allograft Material and Membrane.
Ziv Mazor, et al. 2009. Sinus Floor Augmentation With
Simultaneous Implant Placement Using Choukroun’s Platelet-Rich Fibrin as the sole Grafting Material: A Radiological and Histologic Study at 6 months.