ISSN Online: 2329-3292 ISSN Print: 2329-3284
DOI: 10.4236/ojbm.2019.72028 Feb. 27, 2019 400 Open Journal of Business and Management
Research on the Development
of China’s Logistics
Junye Zhang
1*, Yali Dong
2, Wei Huang
3, De Chen
41School of Logistics, Beijing Wuzi University, Beijing, China 2Sleemon North Furniture Co., Ltd., Langfang, China
3School of Logistics, Shanghai Maritime University, Shanghai, China 4Law School, Peking University, Beijing, China
Abstract
The purpose of this paper is to explore the current state of China’s logistics development and the future development. In order to fulfill the research ob-jective, a literature-based survey and content analysis is used to investigate the development level of China’s logistics research, also, second-hand data based statistical analysis is used as the main method to study the development of Chinese logistics in this paper. While every effort has been made to ensure that the most up-to-date data is available in the analysis, this is not always possible due to the obvious reasons for data scarcity and data integrity. De-spite the improvements and progress made by the government and other agencies, the current logistics infrastructure, especially the transportation network, customs procedures and warehousing facilities are still lacking. Fu-ture developments are also highlighted to portray an accurate assessment of China’s logistics situation. This is the latest comprehensive research on the development of China’s logistics in the known scope. It provides an opportu-nity for companies that want to enter the Chinese market to understand the development of China’s logistics.
Keywords
China, Logistics, Development, Reform and Opening, Transportation, Customs, Warehousing
1. Introduction
China’s per capita GDP has remained almost unchanged over the past millen-nium. Since 1978, GDP has risen almost vertically, and China’s total economic How to cite this paper: Zhang, J.Y., Dong,
Y.L., Huang, W. and Chen, D. (2019) Re-search on the Development of China’s Logistics. Open Journal of Business and Management, 7, 400-426.
https://doi.org/10.4236/ojbm.2019.72028 Received: January 18, 2019
Accepted: February 24, 2019 Published: February 27, 2019
Copyright © 2019 by author(s) and Scientific Research Publishing Inc. This work is licensed under the Creative Commons Attribution International License (CC BY 4.0).
DOI: 10.4236/ojbm.2019.72028 401 Open Journal of Business and Management output has since entered an annual growth rate of nearly 10% [1]. In 1978, China began the reform and opening. This huge market was exposed to the world. In 2001, China’s accession to the WTO marked a new stage for China’s opening. Since 2011, China has become the second largest economy in the world and has entered the middle and upper income countries. The convening of the 18th Na-tional Congress of the Communist Party of China in 2012 marked China’s entry into a comprehensive well-off society. The logistics industry, as a composite ser-vice industry integrating the transportation, telecommunications, customs and warehousing, is an important part of the national economy. It plays an impor-tant role in promoting industrial restructuring, transforming economic devel-opment methods and enhancing national economic competitiveness.
Since the reform and opening, China’s logistics has developed rapidly. Some scholars have noticed this. Jiang and Prater noticed that China’s logistics indus-try is undergoing a revolution from a planned economy to a market economy [2]. Goh and Ling compared the changes in logistics before and after China’s accession to the WTO and that entering the WTO has promoted the develop-ment of China’s logistics industry [3]. Hong and Liu studied the development of China’s logistics from the perspective of suppliers and made suggestions for lo-gistics managers and policy makers [4]. A review of China-based literatures conducted to investigate the extent to which research opportunities on China’s logistics [5]. Some scholars also made comprehensive reviews of China’s logistics development to a certain degree this year. Ding made a summary of the devel-opment of the logistics industry since the founding of New China and revealed the process of the evolution of China’s logistics industry from traditional to modernization [6]. Wang and He summarized the stage characteristics of Chi-na’s logistics development and focused on the nation’s policies on logistics [7].
At the time of the 40th anniversary of China’s reform and opening, it is neces-sary to have a timely and comprehensive research on assessing China’s logistics current status in transportation, customs and warehousing. Understanding the infrastructural conditions, limitations and future developments will enable gov-ernment, multinational companies and LSPs to develop better appropriate strat-egies to logistical challenges. We rely primarily on archival data obtained from reliable sources, such as the National Bureau of Statistics of China and the Na-tional Statistical Yearbook, to provide most of the statistical information. Al-though every effort has been made to ensure that the most up-to-date data is available in the analysis, this is not always possible due to the obvious reasons for data scarcity and data integrity.
DOI: 10.4236/ojbm.2019.72028 402 Open Journal of Business and Management
2. Transportation
2.1. Highway Transport
2.1.1. Current Developments
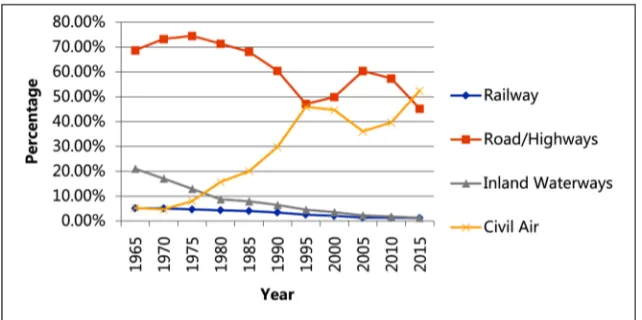
Since the mid-1970s, especially 1978, the freight volume on highways (including expressways) has increased year-on-year (Figure 1). In 2017, the volume of goods transported was 36.8 billion tons, a year-on-year increase of 10.1% [8]. In fact, highways have always been the main mode of transportation, increasing from 48% to 77% of the total freight moved between 1978 and 2017. In 2017, Guangdong, Shandong, Anhui, Henan, Hebei had the highest volumes of freight transported via highways [9].
The increase in road freight volume is not surprising, for a long time, road/ highway mileage has been ranked first in the length of different modes of trans-port, until it was surpassed in recent years, but still has a high proportion (Figure 2). From 2016 to 2017 alone, the length of highways increased by 78,200 km and the total length of the highway reached 4.8 million km. According to statistics,
[image:3.595.208.540.313.487.2]Source: National Bureau of Statistics of China (2018).
Figure 1. Freight volume (1968-2016).
Source: National Bureau of Statistics of China (2018).
[image:3.595.214.535.530.690.2]DOI: 10.4236/ojbm.2019.72028 403 Open Journal of Business and Management there are as many as 12 provinces with a mileage of over 5000 km at the end of the “12th Five-Year Plan” (2011-2015), of which Guangdong Province ranks first with 7018 km, Hebei Province with second place with 6333 km, and Henan Province ranks third [10]. In 2012, China’s expressway mileage reached 96,000 km, surpassing the United States’ 92,000 km, ranking first in the world. In 2017, China’s highway mileage increased to 131,000 kilometers, keeping ranking first in the world, nearly 30,000 km more than the US highway mileage.
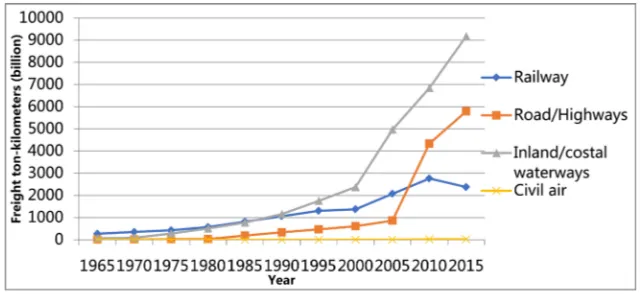
Most of the goods transported by highway are short-haul because the average distance traveled by each road is about 183 km, while the average length of rail freight is about 714 km (National Bureau of Statistics of China, 2018). Therefore, for a long time, compared with inland waterways and railways, highways regis-tered freight ton-km is relatively low (Figure 3). Thanks to the rapid growth in highway mileage and number of trucks (Table 1), road freight turnover grew ra-pidly in 2005 and later exceeded rail freight turnover.
[image:4.595.213.534.291.438.2]Source: National Bureau of Statistics of China (2018).
Figure 3. Freight ton-kms (1965-2015).
Table 1. Highway vs railway in length and number of freight vehicles.
Year Length (million km) Number of freight vehicles (million)
Highway Railway Highway Railway
2005 3.35 0.075 4.52 0.54
2006 3.46 0.077 4.94 0.56
2007 3.58 0.078 5.39 0.58
2008 3.73 0.080 5.96 0.59
2009 3.86 0.086 7.53 0.60
2010 4.01 0.091 9.31 0.62
2011 4.11 0.093 10.67 0.65
2012 4.24 0.098 11.76 0.67
2013 4.36 0.103 12.75 0.72
2014 4.46 0.112 13.53 0.72
[image:4.595.199.539.500.738.2]DOI: 10.4236/ojbm.2019.72028 404 Open Journal of Business and Management
2.1.2. Constrains and Challenges
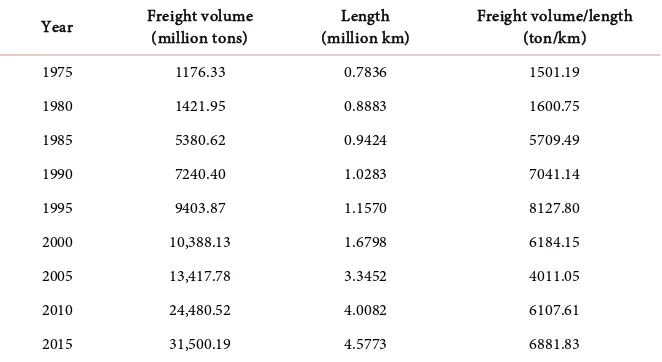
Although the length of the highway increases, the rate of increase in the length of the highway is usually much slower than the increase in the freight volume (Table 2). Therefore, it is common to illegally modify vehicles to increase their capacity. In addition, with the continuous efforts to restore and maintain these highways, road engineering will inevitably cause bottlenecks and hinder traffic flow. In terms of regulation, the Government is also increasing the number of road inspections to prevent vehicles from overloading their statutory restric-tions. However, the effectiveness of these inspections is affected by the unwil-lingness of transportation companies to cooperate. Another problem relates to vehicles for shipping, which are typically convertibles that are only covered by tarpaulins. While the use of these vehicles may result in cost savings, the cost due to loss and damage to the cargo is significant and common. There are also cases where people and goods are mixed and easily cause casualties.
2.1.3. Future Developments
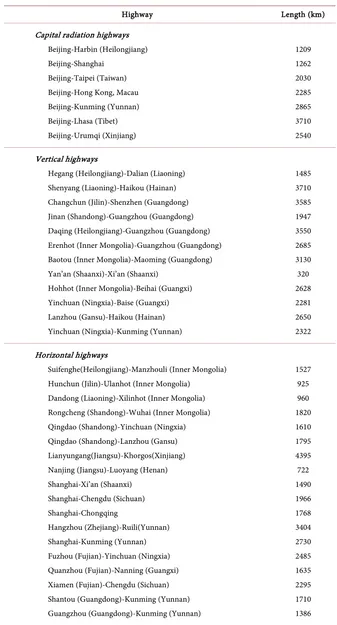
The Government will continue to invest heavily in highway development. By 2020, an additional 1 million km of highway will be completed, bringing the to-tal length of the highway to 5 million km, an increase of about 6% per year [11]. During the “13th Five-Year Plan” period (2016-2020), the National Trunk High-way System (NTHS) which is known as “7918 HighHigh-way Net” will continue to be built, which is a project supported by the World Bank. The System has been in construction since 1984 and will be completed in 2030. Upon completion, the 118,000-km NTHS will have 36 inter-provincial highways connecting hundreds of cities. The System consists of 7 capital (Beijing) radiation highways, 11 north-south vertical highways and 18 east-west horizontal highways (Table 3).
[image:5.595.208.539.527.708.2]The Chinese government is also constantly building other highways that are not part of the NTHS. These include the Tongjiang (Heilongjiang)-Sanya (Hai-nan) Highway, Heihe (Heilongjiang)-Hong Kong, Macau Highway and Shanghai-
Table 2. Highway freight volume vs length (1965-2015).
Year Freight volume (million tons) (million km) Length Freight volume/length (ton/km)
1975 1176.33 0.7836 1501.19
1980 1421.95 0.8883 1600.75
1985 5380.62 0.9424 5709.49
1990 7240.40 1.0283 7041.14
1995 9403.87 1.1570 8127.80
2000 10,388.13 1.6798 6184.15
2005 13,417.78 3.3452 4011.05
2010 24,480.52 4.0082 6107.61
2015 31,500.19 4.5773 6881.83
DOI: 10.4236/ojbm.2019.72028 405 Open Journal of Business and Management
Table 3. Inter-provincial highways of the NTHS.
Highway Length (km)
Capital radiation highways Beijing-Harbin (Heilongjiang) Beijing-Shanghai
Beijing-Taipei (Taiwan) Beijing-Hong Kong, Macau Beijing-Kunming (Yunnan) Beijing-Lhasa (Tibet) Beijing-Urumqi (Xinjiang) 1209 1262 2030 2285 2865 3710 2540 Vertical highways
Hegang (Heilongjiang)-Dalian (Liaoning) Shenyang (Liaoning)-Haikou (Hainan) Changchun (Jilin)-Shenzhen (Guangdong) Jinan (Shandong)-Guangzhou (Guangdong) Daqing (Heilongjiang)-Guangzhou (Guangdong) Erenhot (Inner Mongolia)-Guangzhou (Guangdong) Baotou (Inner Mongolia)-Maoming (Guangdong) Yan’an (Shaanxi)-Xi’an (Shaanxi)
Hohhot (Inner Mongolia)-Beihai (Guangxi) Yinchuan (Ningxia)-Baise (Guangxi) Lanzhou (Gansu)-Haikou (Hainan) Yinchuan (Ningxia)-Kunming (Yunnan)
1485 3710 3585 1947 3550 2685 3130 320 2628 2281 2650 2322 Horizontal highways
Suifenghe(Heilongjiang)-Manzhouli (Inner Mongolia) Hunchun (Jilin)-Ulanhot (Inner Mongolia)
Dandong (Liaoning)-Xilinhot (Inner Mongolia) Rongcheng (Shandong)-Wuhai (Inner Mongolia) Qingdao (Shandong)-Yinchuan (Ningxia) Qingdao (Shandong)-Lanzhou (Gansu) Lianyungang(Jiangsu)-Khorgos(Xinjiang) Nanjing (Jiangsu)-Luoyang (Henan) Shanghai-Xi’an (Shaanxi)
Shanghai-Chengdu (Sichuan) Shanghai-Chongqing
Hangzhou (Zhejiang)-Ruili(Yunnan) Shanghai-Kunming (Yunnan) Fuzhou (Fujian)-Yinchuan (Ningxia) Quanzhou (Fujian)-Nanning (Guangxi) Xiamen (Fujian)-Chengdu (Sichuan) Shantou (Guangdong)-Kunming (Yunnan) Guangzhou (Guangdong)-Kunming (Yunnan)
1527 925 960 1820 1610 1795 4395 722 1490 1966 1768 3404 2730 2485 1635 2295 1710 1386
DOI: 10.4236/ojbm.2019.72028 406 Open Journal of Business and Management Zhangmu (Tibet) Highway. In 2020, China will build a “Ten Vertical and Ten Horizontal” comprehensive transportation channel that traverses east and west, runs through the north and south, and is open to the outside world. The edge channel around China’s land will also be established [11]. Highway standards will also be upgraded. As for Western China, the Government will use Xinjiang as the core area to build land bridges and transportation corridors, laying the foundation for building the “Belt and Road”. In the whole of China, the highway will develop from a linear operation to a “one highway network”.
2.2. Rail Transport
China’s railways are divided into national, local and joint ventures (JV, between national and local) railways. Unless otherwise stated, this section will collectively refer to these three types of railways.
2.2.1. Current Developments
Railways are broadly divided into East-West and North-South lines. At present, China’s railways have formed a “three horizontal (east-west) lines and five vertical (north-south) lines” pattern. Three horizontal lines are Beijing-Baotou-Lanzhou line, Lianyungang-Lanzhou-Alashankou (Xinjiang) line and Shanghai-Kunming line. The vertical lines connect Beijing with Shanghai, Beijing with Kowloon, Beijing with Guangzhou as well as Taiyuan with Liuzhou (Guangxi) and Baoji (Shaanxi) with Kunming.
Rail transport has been growing steadily since the 1960s and has been the second most popular mode of transport for more than 40 years (Figure 1). In 2016, the volume of goods transported by rail reached 3332 million tons, while the freight turnover reached 2,379,226 million ton-kilometers (National Bureau of Statistics of China, 2018). In terms of freight turnover, the railway was more popular than the highway from the 1960s to the first decade of the 21st century, because the railway was used for further delivery, though not more than the highway. The increase in freight volume is mainly from heavy and bulky goods such as coal, steel and iron. Shanxi, Heilongjiang, Liaoning, Hebei, Shandong, Henan and other regions are rich in such resources, so the freight volume of railway has been very large. For instance, in 2016, they registered 1378 million tons of freight moved by railway (National Bureau of Statistics of China, 2018). Correspondingly, the use of containers on trains also showed good growth in 2016, handling 7.61 million TEUs [12]. According to the Ministry of Transport, this usage is expected to increase.
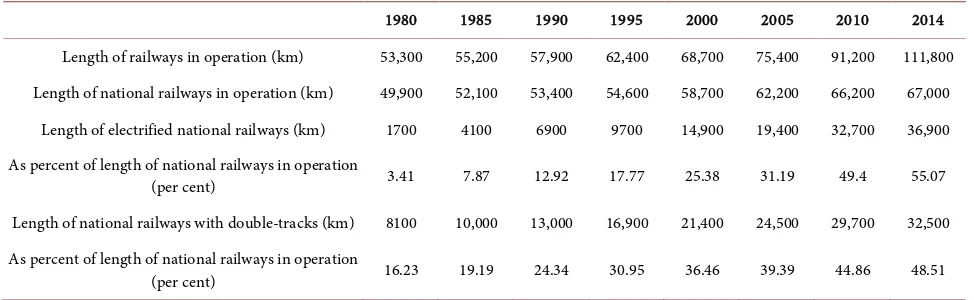
Although the freight volume increased by 26 times from 1975 to 2015, the to-tal length of the railway only increased by 5 times (Table 2). During the same period, the length of the electrified national railway track and the dual-track na-tional railway increased by 21 times and 3 times respectively, which was impres-sive (Table 4). At present, the transportation mileage of China’s railways and electrified railways has reached the second place in the world [13].
DOI: 10.4236/ojbm.2019.72028 407 Open Journal of Business and Management ferry), it has become an important part of the “Belt and Road” strategy. China Railway Express (CR Express) is the China-Europe block train ferry, which is organized by the China Railway Corporation, operated in the international rail-way container intermodal transportation mode in China-Europe along the “Belt and Road”.
The CR Express corridors are divided into West, Middle, East and South cor-ridors (Table 5).
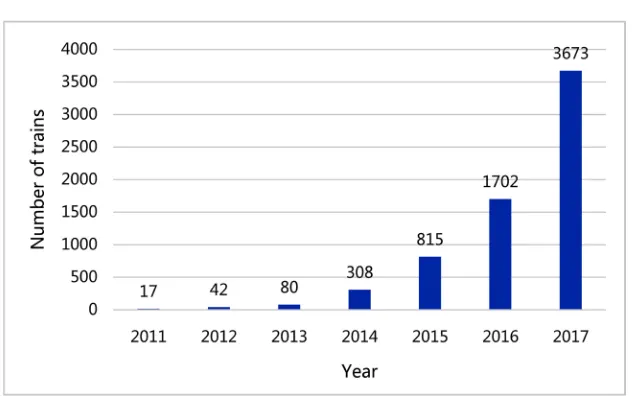
[image:8.595.55.542.265.415.2]From 2011 to 2017, average annual growth rate attained to 44%, the cumula-tive CR Express trains were 6637. The total number of trains in 2017 exceeded the total of 2011 to 2016 (Figure 4). By the end of June 2018, the cumulative number of CR Express trains had exceeded 9000, with nearly 800,000 TEUs of
Table 4. Railway infrastructure developments.
1980 1985 1990 1995 2000 2005 2010 2014 Length of railways in operation (km) 53,300 55,200 57,900 62,400 68,700 75,400 91,200 111,800 Length of national railways in operation (km) 49,900 52,100 53,400 54,600 58,700 62,200 66,200 67,000
Length of electrified national railways (km) 1700 4100 6900 9700 14,900 19,400 32,700 36,900 As percent of length of national railways in operation
(per cent) 3.41 7.87 12.92 17.77 25.38 31.19 49.4 55.07
Length of national railways with double-tracks (km) 8100 10,000 13,000 16,900 21,400 24,500 29,700 32,500 As percent of length of national railways in operation
(per cent) 16.23 19.19 24.34 30.95 36.46 39.39 44.86 48.51
Source: National Bureau of Statistics of China (2018); Note: Some of the data was last updated to 2014, so the 2014 data was selected as the latest data.
Table 5. CRE corridors.
CR Express corridors Brief description
West corridor I: Leave the border at Alataw (Khorgos) port, through Kazakhstan then connected to Siberia railway of Russia, the route through Belarus, Poland, Germany, and then access to other European countries.
II: Leave the border at Khorgos (Alataw) port, through Kazakhstan, Turkmenistan, Iran, Turkey and other countries, access to European countries; or through Kazakhstan across the Caspian Sea, entering Azerbaijan, Georgia, Bulgaria and other countries, access to European countries.
III: Leave the border at Turgart (lrkeshtam), connecting China-Kyrgyzstan-Uzbekistan Railway (in planning), through Kyrgyzstan, Uzbekistan, Iran, Turkmenistan, Turkey and other countries, access to European countries.
Middle corridor Leave the border at Erenhot port, through Mongolia, connected with Siberia railway of Russia, access to European countries.
East corridor Leave the border at Manchuria port in Inner Mongolia, connected with Siberia railway of Russia, access to European countries.
South corridor I: Leave the border at the Khunjerab port, through lslamabad to Gwadar Port (the China-Pakistan Corridor), total mileage is about 6280 km.
II: Leave the border at Ruili port, through the port of Kyaukpyu-Chittagong(-Yangon)-Calcutta, after a total of 4 countries (BCIM corridor), total mileage is about 3510 km.
[image:8.595.58.540.440.736.2]DOI: 10.4236/ojbm.2019.72028 408 Open Journal of Business and Management Source: China Railway Container Transport Co., Ltd.
Figure 4. Development of number of trains of CRE.
goods, 48 domestically operated cities, and 42 cities in 14 countries in Europe. The transportation network covers the major areas of Asia and Europe [14]. On August 26, 2018, the number of CRE trains reached 10,000 [15].
2.2.2. Constrain and Challenges
From 2009 to 2014, national railways, operating at almost full capacity (over 97%) (National Bureau of Statistics of China, 2018), were unable to meet addi-tional demand. According to the Ministry of Transport, more than 50% of freight must seek other means of transportation [16] such as highways. The ca-pacity shortage in the northeastern region where the heavy industry base is lo-cated is particularly serious. Given the priority of railways to transfer industrial resources such as coal and steel, commodities face greater difficulties in obtain-ing rail space. Due to this shortage of capacity, the departobtain-ing train is usually fully loaded. This results in uncertain starting and arrival times, so it is very time consuming to distribute by rail. Trains that crawl at an average speed of 35.6 km/h (National Bureau of Statistics of China, 2018) further exacerbate this situa-tion.
2.2.3. Future Developments
In the 13th Five-Year Plan, the Government plans to allocate RMB 3.5 trillion to build new railways, improve existing networks and increase delivery speed. During this period, an additional 30,000 km of new railways will be built to bring the total length of the railway to 150,000 km, with double-tracks railways rate and electrified railways rate reaching 60% and 70% respectively. A major project undertaken is to continue to expand the scale of the road network in the central and western regions, reaching 90,000 km by the end of the 13th Five-Year Plan [17].
DOI: 10.4236/ojbm.2019.72028 409 Open Journal of Business and Management will open to traffic in 2020. A similar construction is being carried out for the Eurasian Continental Bridge, linking China to Serbia.
As containers become more popular, another goal of Ministry of Transport is to improve container handling facilities and introduce containerized tracking systems. Refrigerated containers for perishable goods and special containers for gas and liquids will also be purchased. This should lead to more service choices and smoother multimodal transport.
The World Bank approved a USD 300 million loan for the construction of the 343-km double-track electrified passenger and freight dual-purpose railway in Harbin to Jiamusi, Heilongjiang Province, as well as the construction of 12 new stations and the upgrading of Jiamusi Station. The project is expected to be completed in 2019. By then, this new line will shorten the passenger and cargo distance from Harbin to Jiamusi by 164 kilometers, from the current 507 km to 343 km [18]. In addition, China also invites foreign investment in railway infra-structure development. In 2018, the Chinese railway industry canceled restric-tions on foreign investment, including the abolition of the construction of the railway trunk line network and the restrictions on the operation of the Chinese side, and the removal of the railway passenger transport company from the Chi-nese holdings. In addition to the previously restricted foreign investment access restrictions for rail transit equipment manufacturing, the railway industry has been largely open. This will promote the capital of all parties to enter the railway infrastructure.
2.3. Water Transport
Goods transported by water are usually classified into ocean and inland water-ways. In this section, the top ten seaports and inland water ports are identified and the facilities available at these ports are described as they are more likely to become potential logistics hubs.
2.3.1. Current Developments
1) Ocean transport
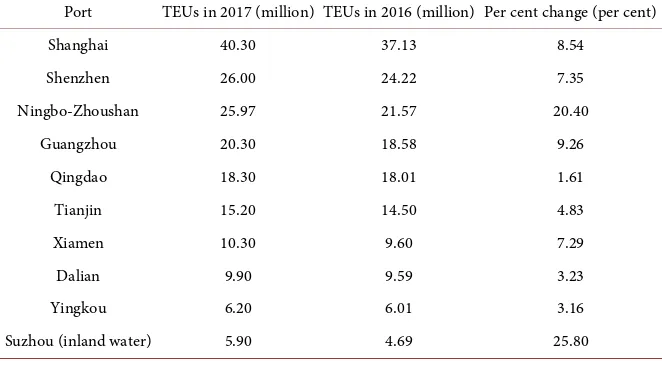
In 2016, the total throughput of all seaports was 8,109.33 million tons (Na-tional Bureau of Statistics of China, 2018). From 2016 to 2017, container throughput in some major ports increased by 1.61% to 25.8% (Table 6). In 2017, in the top 20 container throughput of global ports, there are eight major con-tainer ports in mainland China, namely Shanghai Port (1st), Shenzhen Port (3rd), Ningbo-Zhoushan Port (4th), and Guangzhou Port (7th), Qingdao Port (8th), Tianjin Port (10th), Xiamen Port (14th) and Dalian Port (16th) [19].
DOI: 10.4236/ojbm.2019.72028 410 Open Journal of Business and Management
Table 6. Container throughput at major ports.
Port TEUs in 2017 (million) TEUs in 2016 (million) Per cent change (per cent)
Shanghai 40.30 37.13 8.54
Shenzhen 26.00 24.22 7.35
Ningbo-Zhoushan 25.97 21.57 20.40
Guangzhou 20.30 18.58 9.26
Qingdao 18.30 18.01 1.61
Tianjin 15.20 14.50 4.83
Xiamen 10.30 9.60 7.29
Dalian 9.90 9.59 3.23
Yingkou 6.20 6.01 3.16
Suzhou (inland water) 5.90 4.69 25.80
[image:11.595.205.538.316.549.2]Source: Wikipedia (2018).
Table 7. Top 10 seaports (2017).
Seaports Administrative region Freight volume (million tons) Per cent of total freight volume (per cent)
Ningbo-Zhoushan Zhejiang province 1,007 11.68
Shanghai Shanghai municipality 706 8.19
Guangzhou Guangdong province 566 6.56
Tangshan Hebei province 565 6.55
Qingdao Shandong province 508 5.89
Tianjin Tianjin municipality 503 5.83
Dalian Liaoning province 451 5.23
Yingkou Liaoning province 362 4.20
Rizhao Shandong province 360 4.17
Yantai Shandong province 286 3.32
Top 10 seaports 5314 61.61
All seaports 8,625 100
Source: Ministry of Transport of China (2018).
the rise of ports such as Ningbo-Zhoushan Port. An interesting phenomenon is that the number of containers handled by Shenzhen Port is in the forefront of the country and the world, but from the perspective of freight volume, the amount of Shenzhen Port is very small. This is because the goods handled by Shenzhen Port is mostly composed of low-density light industrial products such as toys, accessories and clothing.
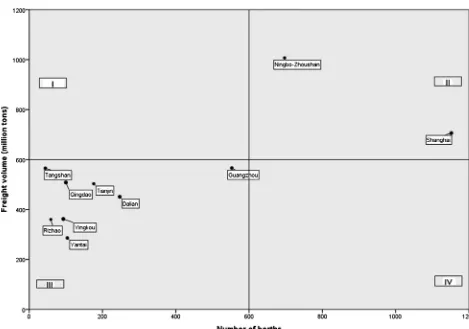
Figure 5 shows the relationship between the number of berths and freight volume in the top ten seaports.
DOI: 10.4236/ojbm.2019.72028 411 Open Journal of Business and Management Source: Ministry of Transport of China (2018), National Bureau of Statistics of China (2018).
Figure 5. Productivity of top 10 seaports.
with Yantai and Yingkou Ports, the number of berths in Qingdao Port is almost the same, and its transportation volume is relatively high. Using the freight vo-lume of each berth as a measure of port productivity, Qingdao Port’s productiv-ity is relatively high. Accordingly, Tangshan Port is more productive than Guangzhou Port. No port falls in Quadrants I and IV, indicating that the opera-tion of the Chinese seaport is stable. Other aspects of port infrastructure are shown in Table 8.
2) Inland waterway
DOI: 10.4236/ojbm.2019.72028 412 Open Journal of Business and Management today’s appearance.
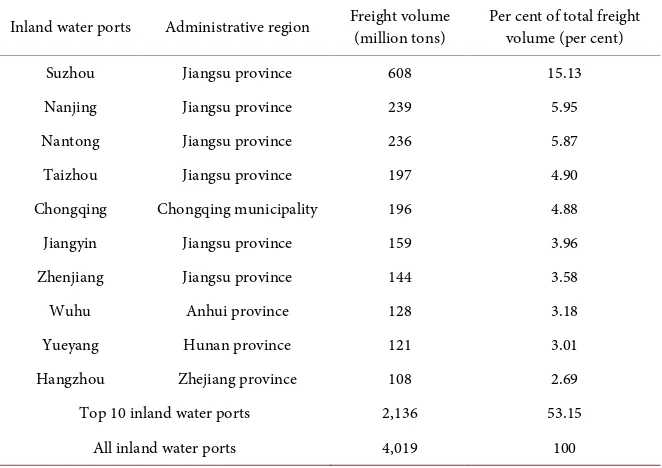
In 2017, the total freight volume of all inland water ports was 4.02 billion tons [22]. According to the freight volume in 2017, China’s top ten inland water ports have been identified (Table 9).
[image:13.595.208.539.192.432.2]Among the top 10 inland water ports, only Hangzhou Port is the port of Qiantang River, but part of it belongs to the Yangtze River Basin. The other nine
Table 8. Port infrastructure of top 10 seaports.
Ports Number berths Number of berths for 10,000-ton ships Length of quays (m)
Shanghai 1152 182 109,222
Ningbo-Zhoushan 697 163 91,029
Guangzhou 553 76 54,508
Dalian 247 103 44,642
Tianjin 176 121 39,389
Yantai 104 65 20,624
Qingdao 100 78 26,762
Yingkou 93 61 19,709
Rizhao 59 52 15,440
Tangshan 44 39 10,606
Top 10 seaports 3225 940 431,931
All seaports 6069 1814 827,193
Source: National Bureau of Statistics of China (2018).
Table 9. Top 10 inland water ports (2017).
Inland water ports Administrative region Freight volume (million tons) Per cent of total freight volume (per cent)
Suzhou Jiangsu province 608 15.13
Nanjing Jiangsu province 239 5.95
Nantong Jiangsu province 236 5.87
Taizhou Jiangsu province 197 4.90
Chongqing Chongqing municipality 196 4.88
Jiangyin Jiangsu province 159 3.96
Zhenjiang Jiangsu province 144 3.58
Wuhu Anhui province 128 3.18
Yueyang Hunan province 121 3.01
Hangzhou Zhejiang province 108 2.69
Top 10 inland water ports 2,136 53.15
All inland water ports 4,019 100
[image:13.595.208.539.475.709.2]DOI: 10.4236/ojbm.2019.72028 413 Open Journal of Business and Management are all located in the Yangtze River Basin, which shows that the “Golden Water-way” of the Yangtze River is well-deserved. Jiangsu Province’s seaport transpor-tation is relatively backward, but relying on the Yangtze River golden waterway, it has made a splash in the inland water transportation, occupying 6 seats in the top 10 list, and even the monopoly of the top four, can be described as a huge advantage. Among them, Suzhou Port has been handling more than 600 million tons. This number is only behind Ningbo-Zhoushan Port and Shanghai Port. The development of inland water ports in the central region seems to be back-ward. Wuhu Port and Yueyang Port are ranked lower, while Wuhan Port and Ji-ujiang Port are not among the top 10.
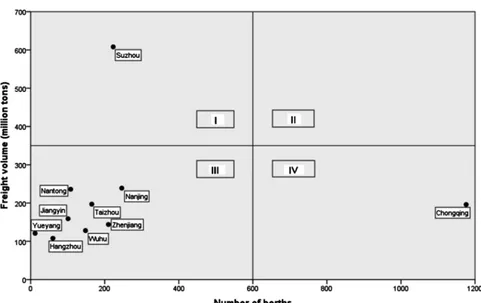
Figure 6 shows the relationship between the number of berths and the freight volume in the top 10 inland water ports.
[image:14.595.58.539.382.685.2]Obviously, although the freight volume of Chongqing is relatively large, its productivity, calculated by the freight volume per berth, is relatively low. In sharp contrast, Suzhou Port, which handles the most freight volume with fewer berths, is the most productive. Other ports are in Quadrant Ⅲ, indicating that their productivity is normal. Other aspects of port infrastructure are shown in Table 10.
2.3.2. Constrains and Challenges
In China, transporting goods by water presents some challenges. The current law
Source: Ministry of Transport of China (2018), National Bureau of Statistics of China (2018).
DOI: 10.4236/ojbm.2019.72028 414 Open Journal of Business and Management
Table 10. Port infrastructure at top 10 inland water ports.
Ports Number berths Number of berths for 10,000-ton ships Length of quays (m)
Suzhou 223 107 NA
Nanjing 246 61 30,359
Nantong 108 53 18,774
Taizhou 165 56 20,849
Chongqing 1176 NA 92,013
Jiangyin 101 31 14,756
Zhenjiang 210 45 22,497
Wuhu 148 13 14,808
Yueyang 12 NA NA
Hangzhou 60 NA NA
Top 10 inland water ports 2449 NA NA
All inland water ports 13,616 423 902,835
Note: NA=not available. Source: National Bureau of Statistics of China (2018)
is generally not comprehensive and the market mechanism is underdeveloped. Many ships and the technology used are very old. Even in large ports like Tianjin Port, Qingdao Port, Shanghai Port and Shenzhen Port, which are at the leading level in China, there is still a big gap between world’s advanced ports such as Rotterdam Port, Antwerp Port and Singapore Port. China’s ports in relatively high level is only equivalent to the developed countries’ in the 1980s. Despite the significant increase in the number of TEUs processed, these ports are still unable to handle large volumes easily because the port infrastructure is below interna-tional standards. For example, pavement loading typically allows for the stacking of up to three containers, which is half the average number in more developed ports like Hong Kong Port.
When comparing the data of the Ministry of Transport of China with the data of the US Department of Transportation, we can see that the number of deep water berths in China only accounts for 16.4% of which in the US, some other indicators are no more than one-third [23]. Despite the global trend of using large container ships, many Chinese ports cannot accommodate such vessels. Therefore, it is important to develop and implement plans to alleviate conges-tion associated with such high volumes and to cater to large vessels. It can be seen that the large-scale and specialized deep-water berths are insufficient, the mileage of deep-water navigation channels is not enough, the shortage of auto-mation equipment and the low standardization of logistics facilities and equip-ment have become the bottleneck restricting the developequip-ment of China’s water transport. Traditional Chinese management styles and lack of expertise have created additional barriers.
DOI: 10.4236/ojbm.2019.72028 415 Open Journal of Business and Management ingredients. In the past five years, the total amount of dangerous goods trans-ported by waterways in China has increased by nearly 10% every year [24]. So far, China does not have enough infrastructure and expertise to handle these materials. Security measures are still inadequate, workers are inexperienced, and even shippers may not be able to fully understand the materials they de-liver.
At present, the collection and distribution of ports is still dominated by high-way. Railway-inland waterway and railway-sea combined transport development is slow. The proportion of railway collection and distribution in ports is only 2% [23], which is far below the collection and distribution ratio of 10% - 30% of in-ternational ports.
2.3.3. Future Developments
The Government attaches great importance to the inland waterway in the plan-ning of future water transport. For example, in the “13th Five-Year Plan”, the Government plans to build another 320 berths for 10,000-ton ships and increase and improve 4500 kilometers of inland waterways. This will increase the direct freight volume of the Yangtze River trunk line by 300 million tons, and the in-ternational transshipment of coastal port containers will increase by 4.5 million TEU [25].
At the end of 2018, the 6-meter water depth channel improvement project from Wuhan to Anqing (Anhui) will start soon and will be done in 2020. At the end of 2019, the second phase of the 12.5-meter deep-water channel of the Yangtze River in Nanjing and its downstream will be completed. In this way, the 10,000-ton ship can reach Wuhan to transport goods all the year round, while the downstream area of Nanjing Port will be able to take 100,000-ton ships [26]. The advantage is that there is no need for ships to unload and turn to sea-going ships but directly reach the sea from inland water. Once the direct access to the rivers and seas is achieved, the Yangtze River’s strong navigation capacity will be greatly enhanced, becoming a true golden waterway. Before the end of 2020, regular liners will shuttle between major ports such as Chongqing, Yichang, Wuhan and Nanjing and Shanghai Port. At the end of 2019, the scale and routes of the Yangtze River trunk line linking Shanghai Port and Ningbo-Zhoushan Port will expanded. Similarly, the main upgrade of the Beijing-Hangzhou Grand Canal will be completed in 2019.
DOI: 10.4236/ojbm.2019.72028 416 Open Journal of Business and Management Bohai Bay, Hebei Province will allocate 40 billion yuan for the construction and upgrading of the port during the “13th Five-Year Plan” period [28]. With the im-plementation of the “Belt and Road” strategy, these seaports will become mod-ern intmod-ernational-level port-oriented industrial clusters that open up to intmod-erna- interna-tional ports for interactive cooperation and smooth access to maritime trade.
2.4. Air Transport
Civil aviation belongs to the jurisdiction of the Civil Aviation Administration of China (CAAC). The CAAC directly controlled China Southern Airlines, China Eastern Airlines and Air China, while other airlines were controlled by local governments or state-owned enterprises before [3]. Now, each airline is a joint-stock company funded by different companies and government. The statis-tics provided in this section include data on the registration of domestic enter-prises engaged in civil aviation, excluding data from foreign companies.
2.4.1. Current Developments
By 2016, China had 216 airports, 5046 aircrafts and 2950 transport aircrafts, fly-ing 3794 aviation routes, of which 739 are international routes, 3055 domestic routes and 109 regional routes (routes from China to Hong Kong and Macau). Total length of routes reached 6.35 million kms (see Table 11). Since 1997, the route to Hong Kong has been reclassified as a domestic route and the length of the route has been adjusted accordingly. Since 1999, all regional routes, includ-ing those to and from Hong Kong, form part of the domestic route.
[image:17.595.211.539.486.691.2]Although air cargo is negligible relative to other modes of transport (Figure 1 and Figure 3), air freight volume has been steadily increasing (Table 12). In 2016, the annual growth rate of air freight volume reached 8%, creating 6.68 million tons.
Table 11. Civil aviation developments.
Year 1980 1992 2004 2016
Total number of civil aviation routes 181 563 1279 3794 Number of international routes 18 58 244 739
Number of domestic routes 159 492 1035 3055
Number of regional routes 4 13 45 109
Total length of routes (million km) 0.20 0.84 2.05 6.35 Length of international routes (million km) 0.08 0.30 0.89 2.83 Length of domestic routes (million km) 0.11 0.52 1.16 3.52 Length of regional routes (million km) 0.00 0.02 0.06 0.17
Number of civil airports NA 98 133 216
Number of civil aircrafts NA 602 1245 5046 Number of transport aircrafts NA 315 754 2950
DOI: 10.4236/ojbm.2019.72028 417 Open Journal of Business and Management During the same period (1996-2016), the total freight turnover of the airport in-creased by 7.9 times to 22.2 billion.
Since there is no single airport freight turnover, the top ten airports will be determined based on the freight volume (Table 13). Among them, Shanghai Pudong Airport, Beijing Capital Airport and Guangzhou Baiyun Airport ranked 3rd, 15th and 18th respectively among the world’s top 20 cargo airports in 2017 [29]. These airports have received attention as they are more likely to become logistics hubs.
2.4.2. Constrains and Challenges
[image:18.595.209.540.274.430.2]The direct management of route allocation, airfare and aircraft purchases un-dermines the primary role of the CAAC as an industry regulator. However, the
Table 12. Civil aviation freight volume and freight ton-kms.
Year 1996 2000 2004 2008 2012 2016
Total freight volume (million tons) 1.15 1.97 2.77 4.08 5.45 6.68 Domestic routes (million tons) 0.25 0.49 0.70 1.19 1.57 1.93 Reginal routes (million tons) 0.82 1.47 2.06 2.88 3.89 4.75 International routes (million tons) 0.08 0.13 0.17 0.16 0.21 0.22 Total freight ton-kms (million) 2493 5027 7180 11,960 16,389 22,245
Domestic routes (million) 1242 2916 4188 7737 10,645 15,034 Reginal routes (million) 1142 2111 2992 4223 5744 7211 International routes (million) 109 195 260 241 271 275
Source: National Bureau of Statistics of China (2018).
Table 13. Top 10 airports (2017).
Airport Administrative region Freight volume (million tons) Per cent of total freight volume (per cent)
Shanghai Pudong Shanghai municipality 3.82 23.70 Beijing Capital Beijing municipality 2.03 12.59 Guangzhou Baiyun Guangdong province 1.78 11.04 Shenzhen Baoan Guangdong province 1.16 7.20 Chengdu Shuangliu Sichuan province 0.64 3.97 Hangzhou Xiaoshan Zhejiang province 0.59 3.66 Zhengzhou Xinzheng Henan province 0.50 3.10 Kunming Changshui Yunnan province 0.42 2.61 Shanghai Hongqiao Shanghai municipality 0.41 2.54
Nanjing Lukou Jiangsu province 0.37 2.30
Top 10 airports 11.72 72.70
All airports 16.12 100
[image:18.595.207.539.473.713.2]DOI: 10.4236/ojbm.2019.72028 418 Open Journal of Business and Management Civil Aviation Authority is expected to abandon control of these airlines and become a regulatory body responsible for future aviation safety and air route approvals. In addition, Chinese policymakers openly acknowledge that China lags behind developed countries in terms of the number, size, service and man-agement standards of airports [30]. Due to the limited number of airports, the network coverage is sparse and air transportation services are weak. The United States has 5.98 airports per 10,000 square kilometers, compared with 0.23 in China [13]. The number of aircraft available for freight is limited, and several aircraft are also old, deteriorating due to wear and tear. As of the end of 2015, 102 cargo planes in the domestic civil aviation market were scattered among 7 cargo airlines and 1 passenger and cargo airline, and the largest number was on-ly 32 [31]. The runway quality at many airports is also poor. Due to the lack of a national aviation logistics information platform, air transportation processes and procedures are neither advanced nor adequate.
The lack of regulations brings additional problems. China’s aviation logistics industry still has no perfect industrial guidance policies and overall development plans at the national level, resulting in chaotic management of the aviation logis-tics market. Many air cargo agencies lacking legal authorization disrupt market or-der, reduce industry integrity and infringe on the interests of legitimate agencies.
2.4.3. Future Developments
The Chinese Government plans to invest RMB 650 billion during the “13th Five-Year Plan” to improve aviation services and expand the airport network [32]. Therefore, the construction of the new transport airport will bring the total to 260 by 2020, an increasing of 53 compared to 2015 [33]. Despite the difficul-ties, China will endeavor to build a hub and spoke network, with national hubs located in Beijing, Guangzhou and Shanghai. The annual throughput growth rates of Guangdong Baiyun Airport and Shanghai Pudong Airport are over 7% and 11% respectively. Beijing Daxing Airport is China’s most advanced interna-tional airport. It will be completed in 2019 and can handle 2 million tons of car-go per year [34].
DOI: 10.4236/ojbm.2019.72028 419 Open Journal of Business and Management 2021. The airport will serve as an international logistics hub and is expected to support 2.5 million tons of cargo by 2025 and 1.5 million passengers and 3.3 million tons of cargo by 2030 [36].
Due to the full awareness of growth opportunities in the freight sector, many Chinese airports are embarking on the construction of independent freight facil-ities to improve cargo handling capacity. One of the airports is Ezhou Airport, which is an important regional cargo hub built with Memphis as the benchmark. To attract more business, Ezhou Airport will provide low taxes, fast customs clearance, low cost freight housing and low landing fees.
On the other hand, the airport cooperates closely with each other through enhanced cooperation and mergers. For example, Beijing Capital International Airport merged with Daxing International Airport in 2019, creating greater syn-ergy. At the same time, Shanghai Pudong Airport and Hongqiao Airport are under the responsibility of Shanghai Airport Group, thus rationalizing their routes. Similarly, Guangzhou Baiyun Airport and Shenzhen Airport are keen to cooperate with each other.
3. Customs
3.1. Current Developments
Customs formalities are regulated and standardized by the General Administra-tion of Customs (GAC). In 2016, the naAdministra-tional tariffs reached 260.3 billion yuan and have increased substantially after China joint to WTO in 2001 (Figure 7).
Specific matters concerning entry and exit are handled by customs at each lo-cal or regional level. The process begins with the receiver or shipper’s statement and submits the import and export license and related documents to the customs for examination. These documents include the bills of lading, invoices, shipping lists, import or export licensing documents, inspection certificates issued by the GAC for Quality Supervision, Inspection and Quarantine or its local bureau,
[image:20.595.216.532.508.689.2]Source: National Bureau of Statistics of China (2018).
DOI: 10.4236/ojbm.2019.72028 420 Open Journal of Business and Management insurance policies, and customs declaration forms. Other types of items may re-quire additional documentation. The customs can also conduct a physical ex-amination of imported goods. After the customs evaluates the statement, it will determine the amount of the tariff to be imposed.
Tariffs are classified according to the trade name and coding system. Accord-ing to the 8549 tariff headAccord-ings, the import tariff rate averaged 7.5% [37]. The av-erage import tariff rate is much lower than the previous 16.4% in 2000 [3], proving that China has earnestly fulfilled its commitment to reduce tariffs when joined WTO. Take the recent tariff reduction as an example, since July 1, 2018, China has reduced the MFN tariff rate for auto vehicles from 25% and 20% to 15%, and reduced the MFN tariff rate for auto parts from a maximum of 25% to 6%, and reduced the import tariffs of some consumer goods to a larger extent, involving 1449 tariff items, the MFN average tariff rate dropped from 15.7% to 6.9%, with an average drop of 55.9% [38].
Although importers/exporters must pay the corresponding tariffs for most products, some goods are eligible for tax reduction or tax exemption, but other commodities face restrictions and bans (Table 14).
3.2. Constrains and Challenges
Many companies face difficulties in customs clearance because the labyrinth of
Table 14. Products granted tax reduction/exemption, restricted or prohibited.
Products Imports
Granted tariff reduction or exemption One-ticket cargo with a customs duty of less than RMB 50; non-commercial advertising products and samples; foreign government, international organizations donated materials for free; goods lost or damaged before customs clearance; fuel, materials and food supplies necessary for the loading of inbound and outbound vehicles
Restricted Radio transceiver, communication security machine; cigarette, wine; endangered and precious animals, plants (both including specimens) and their seeds and propagation materials; national currency
Prohibited Various weapons, simulated weapons, ammunition and explosives; forged currency and forged securities; prints, films, photographs, records, films, audio tapes, video tapes, laser discs, computer storage media and other items that are harmful to China’s politics, economy, culture and morals; various potent poisons; opium, morphine, heroin, marijuana and other narcotics and psychotropic substances that are addictive; animals, plants and their products with dangerous germs, pests and other harmful organisms; food, medicines or other items that are harmful to human and animal health, from infected areas and other diseases that can spread diseases
Exports
Granted tariff reduction or exemption Same as imports
Restricted Precious metals such as gold and silver and their products; national currency; foreign currency and its securities; radio transceiver, communication security machine; precious Chinese herbal medicine; general artifacts
Prohibited All items included in the prohibited entry range; manuscripts, prints, films, photographs, records, films, audiotapes, videotapes, laser discs, computer storage media and other items that involve nation secrets; precious cultural relics and other text carriers that are prohibited from leaving the country; endangered and precious animals, plants (both including specimens) and their seeds and propagation materials
DOI: 10.4236/ojbm.2019.72028 421 Open Journal of Business and Management rules and regulations is often unclear. If we use 1 to 7 points to represent cus-toms efficiency from low to high, China Cuscus-toms scored 4.6 points in 2017. Al-though this figure is higher than 4.2 points in 2007, it is far lower than Singa-pore’s 6.3 points, Hong Kong’s 6.0 points and the United States’ 5.6 points [39]. Customs officials can make arbitrary decisions due to the lack of a set of fixed guidelines and procedures during the dispute. An official can easily claim that he cannot verify the statement, and conduct investigation, which may eventually result in the confiscation of the goods, fines or even legal proceedings. Although the GAC strives to standardize customs regulations throughout China, some of-ficials continue to make arbitrary decisions on various matters, such as the cate-gory of certain commodities [40].
Damage to the goods during customs clearance is also very serious. Many fra-gile items are often damaged by violent out-of-the-box inspections. Similarly, goods with high freshness requirements, such as fruits, meat, aquatic products and medicines, often deteriorate or lose their effectiveness due to lengthy and complicated customs clearance procedures. Customs clearance time can range from two days to two months which is much higher than the world average level of 7 days [41]. If the customs decide to check each shipment, customs clearance will take longer. If the customs find that the import and export goods are unfa-miliar, the customs clearance time will be greatly extended. Then, the customs may take weeks or even months to determine the appropriate product classifica-tion category. Such unstable customs clearance time makes it difficult to provide a satisfactory estimate of the arrival and departure dates of the goods.
3.3. Future Developments
“Reducing tariffs and promoting openness” has always been the subject of fre-quent research in the State Council executive meeting. In September 2018, the Government decided to reduce the rate of 1585 import tariff headings of indus-trial products from 1 Nov, 2018. Among them, the Government reduced the av-erage import tariff rate (AITR) of mechanical machinery, instrumentation and other mechanical and electrical equipment with a large demand in the domestic market from 12.2% to 8.8%, and the AITR for textiles, building materials and other commodities decreased from 11.5% to 8.4%, and the AITR of some re-source products and primary processed products such as paper products fell from 6.6% to 5.4%, and the AITR for similar goods was reduced [37].
DOI: 10.4236/ojbm.2019.72028 422 Open Journal of Business and Management by half to 30 hours in 2017; the overall customs clearance time for exports was reduced by half to 6.15 hours. In addition, the General Administration of Cus-toms will further improve the intelligence and informatization level of port lo-gistics. By the end of 2018, the main business application rate of “single window” will be increased to 80%, and 100% by the end of 2020 [42].
4. Warehousing
4.1. Current Developments
In recent years, the development of China’s warehousing industry has achieved remarkable results. By the end of 2016, there were about 29,000 warehouse en-terprises in China, and about 129,000 people employed in the industry (National Bureau of Statistics of China, 2018). The fixed assets investment in the ware-housing industry was RMB 698 billion, the newly added fixed assets were RMB 415 billion, and the total assets of the industry was RMB 2.07 trillion. Due to the investment in the industry turning to the function of improving the end node construction, informatization, and intelligence (cloud warehousing, big data, Internet of Things) and the investment in the warehousing industry has in-creased substantially for ten consecutive years which makes the storage facilities have become increasingly saturated, the total assets of the warehousing industry declined for the first time, down 9.4% year-on-year [43].
Since the beginning of the 21st century, the warehouse area has expanded ra-pidly. As of the end of 2016, China’s commercial general warehouse area was about 998 million square meters, up 4.5% year-on-year; the total cold storage volume was about 120,000 cubic meters, up 12.5% year-on-year (National Bu-reau of Statistics of China, 2018).
4.2. Constrains and Challenges
China’s high-quality warehouse market has traditionally been dominated by sin-gle-storey warehouses, which are cheaper to construct than multi-storey ware-houses and tend to be more tenant. But rising land prices have made sin-gle-storey projects less feasible. In addition, the land is owned by the nation, and there is no department in China to uniformly manage the distribution of ware-house land, which leads to difficulties in the development of the quantity and quality of the warehouse. Most warehouses can only be used for general storage purposes.
DOI: 10.4236/ojbm.2019.72028 423 Open Journal of Business and Management trainers to effectively use new technologies.
4.3. Future Developments
In order to attract more investment and promote the logistics industry, more complex warehouses are being built. For example, Beijing will build many logis-tics centers (LCs) during the “13th Five-Year Plan” period (Table 15). Domestic and foreign investors are now building more warehouses across the country, ei-ther collectively or individually. With the liberalization of the logistics industry, more and more foreign companies are building specialized warehouses.
5. Conclusions
This paper emphasizes the reality of logistics developments in China. Transpor-tation, customs and warehousing continue to pose challenges. Improvements in China’s crowded transportation network are already underway. A smooth and efficient distribution network has begun to emerge. The lack of a physical high-tech warehouse structure and a computerized customs system is indeed a logistics barrier that plagues any emerging economy, as does China. However, the bigger challenge is to develop a skilled and knowledgeable workforce that knows how to take advantage of emerging technologies, and that policymakers have the quick political will to develop appropriate laws and regulations to pro-mote truly seamless information flow across provinces and municipalities.
[image:24.595.208.538.539.706.2]Current distribution system deficiencies undermine the ability of multina-tional companies to take full advantage of the Chinese market potential. With the right push and predictable improvements to transportation systems, multi-national companies and LSPs may be more likely to take advantage of this huge market faster than expected. Given China’s current attitude toward the WTO, the potential for logistics growth is enormous. Provincial governments also need to reform their logistics infrastructure more urgently to match other countries. International aid agencies such as the World Bank, the Asian Development Bank
Table 15. LC projects in the 13th FYP.
Project Area (square kms) Main function
Beijing Airport LC 1.55 Import and export logistics and warehousing of Beijing Capital International Airport Fengtai International
Commodity LC 0.275 International commodity trading, storage, distribution
Tongzhou Smart LC 4 Cold chain logistics, e-commerce logistics, food circulation
Pinggu Port LC 7 e-commerce, aviation spare parts bonded Car parallel import, cross-border warehouse
Shijingshan Freight Yard 1.69 Storing living materials
DOI: 10.4236/ojbm.2019.72028 424 Open Journal of Business and Management and the Asian Infrastructure Investment Bank can do more to help develop and fund critical infrastructure projects. The approval process for these projects should also be expedited.
This paper provides any firms wishing to enter the Chinese market, either multinational companies or LSPs with an excellent opportunity to be better pre-pared for the logistical challenges in moving goods either physically or electron-ically through the compendium of information. Understanding the state of the world’s largest market for logistics can help company managers or decision makers accurately redefine their supply chain strategies in specific regions of China and determine strengths and weaknesses each region’s logistics.
Conflicts of Interest
The authors declare no conflicts of interest regarding the publication of this pa-per.
References
[1] Maddison, A. (2003) The World Economy: Historical Statistics. Organisation for Economic Co-Operation and Development, Paris.
https://doi.org/10.1787/9789264104143-en
[2] Jiang, B. and Prater, E. (2002) Distribution and Logistics Development in China: The Revolution Has Begun. International Journal of Physical Distribution & Logis-tics Management, 32, 783-798. https://doi.org/10.1108/09600030210452459
[3] Goh, M. and Ling, C. (2003) Logistics Development in China. International Journal of Physical Distribution & Logistics Management, 33, 886-917.
https://doi.org/10.1108/09600030310508708
[4] Hong, J. and Liu, B. (2007) Logistics Development in China: A Provider Perspective. Transportation Journal,46, 55-65.
[5] Liu, X. (2014) China-Based Logistics Research: A Review of the Literature and Im-plications. International Journal of Physical Distribution & Logistics Management, 44, 392-411. https://doi.org/10.1108/IJPDLM-08-2012-0225
[6] Ding, J. (2018) The Development of China’s Logistics Industry during the Past 40 Years of Reform and Opening-Up and the Outlook of That. China Business and Market, 4, 3-17.
[7] Wang, W. and He, M. (2017) The Development Track, Stage Characteristics and Future Prospect of China’s Logistics Industry Since the Reform and Opening-Up. Reform, 11, 23-34.
[8] China, N.B. (2018) China’s 2017 National Economic and Social Development Statis-tics Bulletin.
[9] China, M.T. (2018) 2017Road Cargo Transportation Volume Data Report. [10] Lan, L. (2016) National Highway “Twelfth Five-Year” Review and “Thirteenth
Five-Year Plan” Outlook. Transport Construction & Management, Z1, 68-77. [11] Council, S. (2017) “13th Five-Year Plan” Modern Comprehensive Transportation
System Development Plan. Beijing.
[12] National Development and Reform Commission, M. o. T., China Railway Corpora-tion (2017) “13th Five-Year” Railway Container Multimodal Transport Development
DOI: 10.4236/ojbm.2019.72028 425 Open Journal of Business and Management [13] Zhang, J. (2018) Discussion on the Development of Car-Free Carriers in the
Logis-tics Industry. Market Modernization, 11, 15-17.
[14] Daily, B. (2018) Train for the Benefit of the People of the New Era. http://news.cnr.cn/native/gd/20180715/t20180715_524301002.shtml [15] Transport, C.R.C. (2018) The Number of CEIBS Trains Exceeded 10,000.
http://www.crct.com/
[16] He, Y. (2017) Railway Capacity Is a Bottleneck. China Coal News, 7. [17] Council, S. (2016) White Paper on China’s Transportation Development.
http://www.xinhuanet.com/politics/2016-12/29/c_1120210887.htm
[18] Bank, W. (2014) World Bank Loan of 600 Million US Dollars to Boost China’s Railway, Public Transport Construction and Gas Utilization.
http://www.shihang.org/zh/news/press-release/2014/03/28/world-bank-600-million -railway-transport-gas-utilization-china
[19] Wikipedia (2018) List of Busiest Container Ports.
https://en.wikipedia.org/wiki/List_of_busiest_container_ports
[20] Hu, F. (2009) The Adaptability between Waterway Navigation Capabilities and Lo-gistics Demands of Yangtze River. Wuhan University of Technology, Wuhan. [21] Zhu, W. (2003) The Research about the Development of the Pearl River’s Waterway
Transportation. Wuhan University of Technology, Wuhan.
[22] China M. o. T. o. (2017) 2016 Statistical Bulletin of the Development of the Trans-portation Industry. Finance & Accounting for Communications, 5, 92-97.
[23] Network, C.W.T. (2016) Analysis on the Problems Existing in China’s Port Logis-tics. http://www.zgsyb.com/html/content/2016-05/30/content_499797.shtml [24] Han, Y. (2017) Safety Evaluation and Safety Management Countermeasures of
Dangerous Goods Maritime Transportation in China—Based on the Perspective of Vulnerability-Capacity. China Water Transport, 17, 46-49.
[25] China M. o. T. o. (2016) Water Transport “13th Five-Year” Development Plan. Bei-jing.
[26] Ding, J. and Nian, K. (2018) Inland Waterway and Port Planning Will Be Adjusted. 21st Century Business Herald.
http://www.21jingji.com/2018/9-12/wNMDEzNzlfMTQ0ODgwNA.html
[27] Government Z. P. P. s. (2016) The 13th Five-Year Plan for the Development of Ma-rine Ports in Zhejiang Province.
http://www.zj.gov.cn/art/2016/5/3/art_1582439_26045312.html
[28] Goverment H. P. P. s. (2016) The 13th Five-Year Plan for the Development of Comprehensive Transportation System in Hebei Province.
https://www.sohu.com/a/153367540_772491 [29] Harris, D. (2018) Top 20 Cargo Airports in 2017.
https://cargofacts.com/top-20-cargo-airports-in-2017/
[30] Wang, Z. and Fang, R. (2017) On the Supply-Side Reform to Promote the Interna-tional Development of China’s Civil Aviation Industry. CAAC News, 7.
[31] Wei, R. and Zhang, L. (2017) The Development Situation and Trend of Aviation Logistics of China. Prices Monthly, No. 4, 82-86.
[32] Ding, J. and Wang, P. (2017) “13th Five-Year” Transportation Investment 15 Tril-lion. 21st Century Business Herald, 1.
DOI: 10.4236/ojbm.2019.72028 426 Open Journal of Business and Management [34] Wu, D. (2018) The Name of Beijing New Airport Is Determined as “Beijing Daxing
International Airport”. CAAC News, 1.
[35] Bai, W. (2018) The First Batch of Civil Aviation Field Encourages the Publication of Private Investment Projects.
http://www.gov.cn/xinwen/2018-08/23/content_5315940.htm [36] Aviation C. f. (2018) Ezhou Airport.
https://centreforaviation.com/data/profiles/newairports/ezhou-airporthubei-interna tional-logistics-hub
[37] Liu, H. (2018) China’s Total Tariff Level Will Drop to 7.5%. Xinmin Evening News. http://xmwb.xinmin.cn/lab/html/2018-09/27/content_10_1.htm
[38] Qiu, H. (2018) China’s Commitment to WTO Accession Is Unambiguous. People’s Daily.
[39] Bank, W. (2018) Customs Burden.
https://data.worldbank.org.cn/indicator/IQ.WEF.CUST.XQ?year_high_desc=true [40] E, L. and Liu, Z. (2014) Cross-Border e-Commerce Customs Clearance Research.
Intertrade, No. 9, 32-34.
[41] Bank, W. (2018) The Average Time for Customs to Handle Import and Export Procedures. https://data.worldbank.org.cn/indicator/IC.CUS.DURS.EX
[42] Liu, H. and Ma, R. (2018) The General Administration of Customs Pushes a Num-ber of Initiatives to Promote Cross-Border Trade Facilitation.
http://www.xinhuanet.com//2018-09/27/c_1123491955.htm
[43] Jiang, P. (2018) Analysis on the Status Quo and Investment Prospect of China’s Warehousing Industry in 2018.