ISSN Online: 2162-1993 ISSN Print: 2162-1985
DOI: 10.4236/oje.2018.812037 Dec. 17, 2018 623 Open Journal of Ecology
Ecosystem Services in Differently Used
Agroecosystems along a Climatic Gradient in
Slovakia
Jarmila Makovníková
1, Boris Pálka
1, Miloš
Širáň
1, Beáta Houšková
1, Radoslava Kanianska
2,
Miriam Kizeková
31National Agricultural and Food Centre, Soil Science and Conservation Research Institute, Bratislava,Slovenská
2Department of Environment, Faculty of Natural Sciences, Matej Bel University, Banská Bystrica, Slovenská
3National Agricultural and Food Centre, Grassland and Mountain Agriculture Research Institute, Banská Bystrica, Slovenská
Abstract
For analysis and evaluation of potential of agroecosystem (arable land and grassland) services (provisioning, regulating and cultural) in Slovakia we have created a mapping unit combining these input layers: slope topography, soil texture and landuse in four climatic regions. Evaluated potential of agroecosystem services was categorised into five categories (very low, low, medium, high and very high). Our results show that climate has the most significant impact on agroecosystem services. Warm, dry lowland region has a higher potential of provisioning services, regulation of water regime, filtration of pollutants and control of soil erosion in comparison to moderately warm and cold regions. In moderate cold region, more than 90% of the total area of arable land has low potential of water regime regulation and cleaning potential (immobilization of risk elements). In the moderate warm climatic region, there is a high share of categories of low and moderate potential of provisioning services and low and moderate potential of water regime regulation. Majority of the total area of warm climatic region belongs to the categories of moderate to high potential of provisioning services and high potential of regulation of water regime. In this climatic zone low potential categories of risk elements immobilization are present in more than 65% of the arable land total area. On the other hand, in very warm climatic zone, more than 89% of the total area of arable land belongs to the category with a very high cleaning (buffering) potential. Potential of natural conditions for recreation is higher only in moderate cold and moderate warm climatic zones with a higher proportion of area of grassland agroecosystems and protected areas NATURA 2000. Moreover, the methodology developed in this paper is How to cite this paper: Makovníková, J.,
Pálka, B., Širáň, M., Houšková, B., Ka-nianska, R. and Kizeková, M. (2018) Eco-system Services in Differently Used Agroe-cosystems along a Climatic Gradient in Slovakia. Open Journal of Ecology, 8, 623-645.
https://doi.org/10.4236/oje.2018.812037
Received: March 20, 2018 Accepted: December 14, 2018 Published: December 17, 2018
Copyright © 2018 by authors and Scientific Research Publishing Inc. This work is licensed under the Creative Commons Attribution International License (CC BY 4.0).
DOI: 10.4236/oje.2018.812037 624 Open Journal of Ecology replicable and could be applied by planners in the case that they are proficient in geographical information systems.
Keywords
Agroecosystem Services, Climatic Zone, Mapping, Trade-Offs, Synergies
1. Introduction
Ecosystem services are inherently defined mutual interaction between ecological and social systems because only those ecosystem processes that contribute to the fulfillment of human needs, are defined as ecosystem services [1] [2] [3] [4]. The ecosystem services approach offers the ability to explore the influence of land use and practices on natural capital stocks, on the processes that build and degrade these stocks, and on the flow of ecosystems services from the use of these stocks [5]. Service-providing ecosystems are denoted as natural capital [6] [7]. Ecosystem services linked to natural capital can be divided into three main categories (provisioning, regulating and cultural) [2] [5]. Agroecosystem services are the multiple goods and services provided to humanity by nature in combination with additional anthropogenic inputs in agricultural systems [2]. Concept of agroecosystem service combines environmental and socio-economic approach to the analysis and evaluation of natural capital. For practical use as well as legislative use of the concept of agroecosystem services in planning and prospective studies, qualitative and quantitative analysis and evaluation of agroecosystem linked to spatial visualization at the required level are essential [7]. The concept of agroecosystem services receives increasing attention in recent years with an emphasis on national assessment. Following this trend, an integrated evaluation and mapping of agroecosystem services was carried out in the Slovak Republic [8].
Agricultural systems are intensely managed by humans and are more controlled and regulated than majority of the other ecosystems [5]. Traditionally, agroecosystems have been considered primarily as sources of provisioning services, but more recently their contributions to the other types of ecosystem services have been recognized [2] [9], such as regulating and cultural services [5] [10] [11]. Recent conceptual works used the ecosystem services approach to highlight the importance of pedosphere to the human well being and prosperity
[12] [13]. We consider the agroecosystem not only as means of production but
DOI: 10.4236/oje.2018.812037 625 Open Journal of Ecology provision of ecosystem services. Nevertheless, agroecosystem services at the national level, were not assessed on the context of the Slovak Republic. In Slovakia, Juráni [19], Bujnovský et al. [20], Makovníková, Barančíková and Pálka [21] and Barančíková et al.[22] have been also dealing with assessment of soil functions that are the basis for the evaluation of agroecosystem services. These authors define a minimum collection of soil indicators for sufficient assessment of soil functions. These indicators form our basis for agroecosystem services evaluation.
DOI: 10.4236/oje.2018.812037 626 Open Journal of Ecology of the conditions for using these models to monitor changes in land use management, spatial planning, and implementation of the assessment of the potential of natural capital services in socio-economic planning within the region and landscape [17]. Burghard and Maes [27] highlights the importance of the process of mapping ecosystem services that can be used to visualise impacts which are often considered invisible externalities of agriculture, both positive and negative.
The aim of this study was to assess and map agroecosystem services on national level and to evaluate agroecosystem services along the climatic gradient in Slovak Republic. The paper aims to describe the use of GIS techniques in creating a uniform spatial unit for agroecosystem services inventory and compare the spatial configuration, synergies and trade-offs of agroecosystem services along the climatic regions.
2. Material and Methods
2.1. Study Area
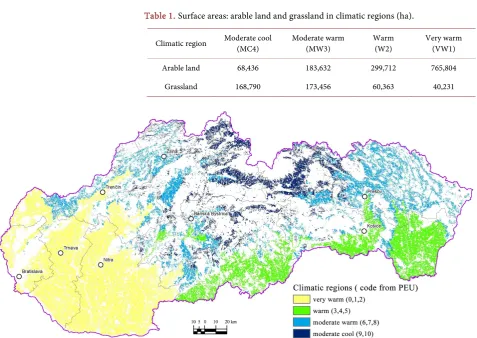
Slovakia is a land-locked country in Central Europe between latitudes 47˚ - 49˚N and longitudes 15˚ - 21˚E. The average rainfall in lowlands is about 600 millimeters per year, in midlands about 700 millimeters per year and the biggest average rainfall rate belongs to mountain areas—approximately 1500 millimeters per year. The daily average temperatures in winter are around freezing (0˚C or 32˚F), while in summer they are around 13/15˚C (55/59˚F) at night, and 25/27˚C (77/81˚F) during the day. Its terrain is mostly hilly, upland and mountainous in the central, north and north-eastern parts of the country where the permanent grasslands mainly occur [38]. For this study, we used a classification of agro-climatic regions provided by the Information Service of the National Agricultural and Food Centre—Soil Science and Conservation Research Institute [39]. In this classification, 11 agro-climatic regions were identified according to long-term average temperatures in January, average growing-season temperatures, daily average temperatures sums (T > 10˚C), the length of period with daily temperatures td > 5˚C and the climatic moisture indicator according Budyko calculated by Tomlain [40]. For our purpose, the original vector layer with 11 categories were merged into 4 categories (climatic regions: very warm (VW), warm (W), moderate warm (MW) and moderate cool climatic region (MC)) and transfered to a raster with a resolution of 100 m (Figure 1).
Agroecosystems, which occupy 49.3% of the Slovak republic, were assessed. To estimate the surplus area of agroecosystems (arable land and permanent grasslands) in each of the climatic regions (Table 1) we used data provided by Land Parcel Identification System (LPIS).
DOI: 10.4236/oje.2018.812037 627 Open Journal of Ecology erosion, cleaning potencial of ecosystem, regulation of climate and cultural ser-vices-potencial of outdoor recreation). Ecosystem types are further classified into two ecosystem categories based on the management, arable land and permanent grassland.
2.2. Data
[image:5.595.62.540.366.704.2]To the primary geo-referenced data belongs the Digital database of soil profiles of Geochemical atlas of Slovakia (GchA-2965 localities on agricultural soil). Geochemical atlas database contains data of agrochemical soil properties and risk elements concentration determined from the samples collected during the national project “Geochemical atlas of soils of Slovakia” [41]. Further, there are geo-referenced data, as a source of additional information (data of relevant soil properties) on the primary geo-referenced data. As secondary geo-referenced data was used Digital database of Soil monitoring of Slovakia (CMSP) repre-sented by digital data archive of the “Partial monitoring system-Soil” as a part of the Complex Environment Monitoring of Slovakia [42]. Soil indicators are included in the soil monitoring system in Slovakia according to the recommendation of the European Commission for united soil monitoring system in Europe [43]. All monitored indicators are quantifiable.
Table 1. Surface areas: arable land and grassland in climatic regions (ha).
Climatic region Moderate cool (MC4) Moderate warm (MW3) Warm (W2) Very warm (VW1)
Arable land 68,436 183,632 299,712 765,804
Grassland 168,790 173,456 60,363 40,231
DOI: 10.4236/oje.2018.812037 628 Open Journal of Ecology
2.3. Methods of Assesssment and Mapping the Potential of
Agroecosystem Service
Ecosystem services potential (capacity) has been characterized by Burghard et al. [2] as the hypothetical maximum yield of selected ecosystem services. Integrated approach towards the assessment of ecosystem services with the application of expert methods enables to link data on soil parameters, morphological and bio-physical parameters of soil with the data on soil exploitation into one concept,
i.e. the concept of agroecosystem services. Biophysical spatial quantified data is
used by many authors to evaluate ecosystem services in their work [1] [44] [45]. For analysis and evaluation of potential of agroecosystem services we have created a mapping unit combining these input layers: slope topography, soil texture and usage of land in four climatic regions. The resulting layer is elaborated at the na-tional level for the whole territory of the Slovak Republic using the methods and tools offered by geographic information systems (GIS). We used ESRI’s software package ArcGIS for Desktop Advanced version 10.3. Mapping units are also com-patible with the spatial units in international database (Corine Land Cover) which carries information on the use of land. Within each unit, we calculated a weighted average of the potential of each agroecosystem service for the territory of the Slo-vak Republic, which is characteristic for the spatial aggregate of functional unit. Forouzangohar et al. [12] concluded that the best sampling and mapping strategy would be a regular grid scheme.
Moreover, the assessment and mapping methodology developed in this paper is replicable and could be applied by planners in case they are proficient in geo-graphical information systems at different levels, from regional (district) to na-tional level.
2.4. The Provisioning Services
The basis for analysing the potential for the provisioning agroecosystem services was a point value within a range of 0 - 100 that indicate a productive potential based on typological and production classification of agricultural soils of Slova-kia [15] [46]. Point value is the sum of points assigned to the average yield of crop production according to the soil type (0 - 60 points), slope and its aspect (0 - 15 points), stone content and soil depth (0 - 15 points) and soil texture (0 - 10 points). Values were categorised into five groups (range of 20 points) and the categories of provisioning service potencial are as follows: 1) very low potential (lower than 20 points), 2) low potential (20 - 40 points), 3) medium potential (41 - 60 points), 4) high potential (61 - 80 points), 5) very high potential (more than 80 points).
2.5. The Regulating Services
DOI: 10.4236/oje.2018.812037 629 Open Journal of Ecology to soil water storage in context with the soil depth. Values were categorised into five groups and the categories are as follows: 1) very low potential (<135 mm), 2) low potential (135 - 175 mm), 3) medium potential (175 - 215 mm), 4) high po-tential (216 - 275 mm), 5) very high popo-tential (>275 mm).
2.6. Potential of Regulation of Soil Erosion, Regulation of Water
Erosion
Regulation of water erosion was derived from maps and databases based on em-pirical model of the universal soil loss equation—USLE [48] (Wischmeier and Smith, 1978), Styk and Pálka, 2005). The relative ratio of the calculated values of soil loss and acceptable erosion expresses the degree of soil erosion endangerment (SEOP value, [49]). Values were categorised into five categories: 1) very low po-tential (more than 2.60), 2) low popo-tential (2.21 - 2.60), 3) medium popo-tential (1.81 - 2.20), 4) high potential (1.40 - 1.80), 5) very high potential (less then 1.40).
2.7. Cleaning Potential of Agricultural Land Ecosystem
Cleaning potential of ecosystem of agricultural land depends on the actual soil contamination and potential of soil sorbents and was calculated as accumulative function:
Cleaning potential = Sorption potential of soil + Potential of total content of inorganic contaminants evaluated according to The Slovak Law 220/2004 Coll. (the method is mentioned detaily in our previous article [21]. Point evaluation of Sorption potential of soil was calculated as a sum of quality factors (pH (0 - 4 points), 4
6
Q (0 - 1 points) and quantity factors (Cox (0 - 1 points), H-depth of humus horizon (0 - 2 points)) according to the function: PS = F(pH) + F(Q46) + F(Cox) × F(H). The overall rating is determined as a sum of the soil contamina-tion and Sorpcontamina-tion potential of soil. The high soil contaminacontamina-tion was evaluated by the high point value and present high risk (0 - 5 points). On the other hand, high soil Sorption potential results in low point value and decreases possible transport risk of harmful elements in soil. Sum of values were categorised into five groups and respective categories are as follows: 1) very low potential (more than 6.50 points), 2) low potential (5.51 - 6.50), 3) medium potential (4.51 - 5.50 points), 4) high potential (3.50 - 4.50 points), 5) very high potential (lower than 3.50 points).
2.8. Climate Regulation
In agroecosystems of agricultural land, soil organic matter represents the largest share of total organic carbon found in the soil. Agroecosystems contribute to climate regulation by sequestration of organic carbon in the soil. Soil organic carbon stock (SOCS) was calculated as a function:
DOI: 10.4236/oje.2018.812037 630 Open Journal of Ecology content in % [50]. The categories are as follows: 1) very low potential (lower than 58.00 t C ha−1), 2) low potential (58.00) 62.00 t C ha−1, 3) medium potential (62.01 - 67.00 t C ha−1), 4) high potential (67.01 - 72.00 t SOC ha−1) 5) very high potential (more than 72.00 t SOC ha−1).
2.9. Cultural Ecosystem Services
All agro-ecosystems are considered to be potential providers of such services. Agroecosystems also have the potential for providing cultural ecosystem ser-vices, particularly recreational activities linked to natural resources, such as hik-ing, bikhik-ing, cross-country skiing. Recreation potential was evaluated through agroecosystem landscape components that have a specific link with summer, winter and year-round recreation. The capacity of ecosystems to provide recrea-tional services depends on particular uniqueness of the site, its accessibility and the surrounding infrastructure. Point value is the sum of points assigned to the altitude (1 - 3 points), inclination (1 - 3 points), drainage and precipitation and temperature (1 - 4 points) and distance to the roads (1 - 4 points). The recrea-tional potential for all these activities was calculated as the sum of potentials for individual recreational activities without added points (Natura 2000). These were added only to the final sum in order to prevent multiple evaluations of ad-ditional factors. This method is described in detail in our previous article [29], where we compared the use of this model and SolVES model (according to Sherrouse et al., [51]) in the case study. The categories of agroecosystem to provide outdoor recreational activity are as follows: 1) very low potential (lower than 6.00 points), 2) low potential (6.01 - 9.00 points), 3) medium po-tential (9.01 - 12.00 points), 4) high popo-tential (12.01 - 15.00 points), 5) very high potential (more than 15.00 points) and:low relevant capacity (from 2.01 to 3.09 points), medium relevant capacity (from 3.10 to 5.09 points), high relevant capacity (from 5.10 to 7.09 points), very high relevant capacity (higher than 7.10 points).
3. Results and Discussion
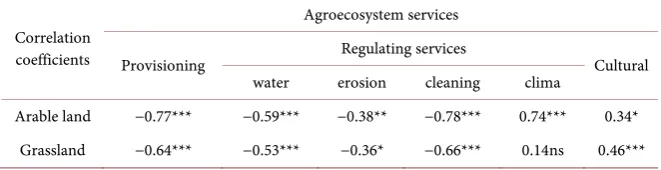
DOI: 10.4236/oje.2018.812037 631 Open Journal of Ecology Table 2. Correlation between clima categories and agroecosystem services for arable land and grassland.
Correlation coefficients
Agroecosystem services
Provisioning Regulating services Cultural
water erosion cleaning clima
Arable land −0.77*** −0.59*** −0.38** −0.78*** 0.74*** 0.34*
Grassland −0.64*** −0.53*** −0.36* −0.66*** 0.14ns 0.46***
Significance labels: ***p < 0.001, **p < 0.01, *p < 0.05, ns: non significant.
Positive correlation coefficient indicates the positive effect of cold climate zone, while negative coefficient indicates the positive influence of warm climate zone. The warm and dry lowland region has higher production potential, water regime regulation, pollutant filtration, and soil drainage in comparison to slightly warm to cool regions. These results are consistent with the place of occurence of soil, its properties, processes and functions in the concept of agroecosystem services [8] [20] [53].
The potential of the provisioning service of agricultural land is determined by its location in the landscape with the climatic conditions (temperature and precipitation) and it is a combination of abiotic, biotic, morphological and socio-economic factors (Figure 2). In Slovakia 29.14% of ecosystems of agricultural land has very high potential for provisioning services. They are mainly ecosystems of arable land, located in warm climate in the Danube basin. The high level of provisioning services (crop poroduction) indicates Spake et al. [58] in his work for widest lowland valleys in North Alps, where agricultural areas are overrepresented. The main limiting features of low potential of provisioning services are relatively cool climate and considerable sloppiness, limited depth or relatively high stoniness of soils in such ecosystem. In this category the predominant ecosystems are permanent grasslands. Our results show that the proportion of the category with higher potential of the provision-ing service increases from the cool climate to very warm (Figure 2) (for arable land from cool climate with prevailing low potential to very warm with very high potential, for grassland from cool climate with lowpotential to very warm with high potential of provisioning services).
In Slovakia 27.47% of the area of agricultural ecosystems has very high potential for regulation of water regime (accumulation of water in the soil) (Figure 3).
DOI: 10.4236/oje.2018.812037 632 Open Journal of Ecology Figure 2. The potential of the provisioning service of agricultural land (arable land—AL—Figure to the left, grassland—G—Figure to the right), percentage of the area of each category of potencial in four climatic regions. Explanations: the categoriesof potential: 1) very low potential, 2) low potential, 3) medium potential, 4) high potential, 5) very high potential.
Figure 3. The potential of regulation of water regime of agricultural land (arable land—AL—Figure to the left, grassland—G—Figure to the right), percentage of the area of each category of potencial in four climatic regions. Explanations: the categoriesof potential: 1) very low potential, 2) low potential, 3) medium potential, 4) high potential, 5) very high potential.
[image:10.595.59.534.355.588.2]DOI: 10.4236/oje.2018.812037 633 Open Journal of Ecology sediments of former seas and lakes, as well as rivers (alluvial cones, aggradational levee) occur and are situated in the foothill parts of lowlands and in the basins [59].
Agroecosystems of arable soils have a high to very high potential for regulation of soil erosion, regulation of water erosion (92% out of the total area of arable land). Arable land is located mainly in flat areas where low risk of water erosion occurs (Figure 4). These values of soil erosion significantly correlate with the attribute of slope (r = −0.72, p = 0.0008). Another prerequisite for higher potential for regulation of water erosion on arable land is presence of deep soils, and consequently higher limit for acceptable soil loss. When considering the overall coverage of land by permanent grassland (land registered in LPIS as permanent grasslands), the potential for soil erosion control achieves very high levels (total area of permanent grasslands—100%, is classified to the category with the very high potential) [8]. The potential to regulate soiltransport is increasing with warmer climate in case of arable land as well as permanent grassland. This is related to the occurrence of deep soils in lowland areas, where warm and very warm climatic regions predominate, and the limit for acceptable loss of soil is higher. In case of arable soils, there is a potential for regulation of soil erosion at approximately the same level in moderate cool (MC) and moderate warm (MW) climatic zone (Figure 4). In general, grassland potential to regulate soiltransport rises from the MC climatic zone to the VW climatic zone. The grassland potential is over 80% in the VW climatic zone (Figure 4).
DOI: 10.4236/oje.2018.812037 634 Open Journal of Ecology Figure 4. The potential of soil erosion in agricultural land regulation (arable land—AL—Figure to the left, grassland—G—Figure to the right), percentage of of each category area for potencial in four climatic regions. Explanations: the categoriesof potential: 1) very low potential, 2) low potential, 3) medium potential, 4) high potential, 5) very high potential.
Figure 5. The cleaning potential of agricultural land (arable land—AL—Figure to the left, grassland—G—Figure to the right), percentage of the area of each category of potencial in four climatic regions. Explanations: the categoriesof potential: 1) very low potential, 2) low potential, 3) medium potential, 4) high potential, 5) very high potential.
[image:12.595.63.530.376.609.2]DOI: 10.4236/oje.2018.812037 635 Open Journal of Ecology contribute to climate regulation by organic carbon sequestration in soil. Soil organic carbon content can be used to represent the carbon sequestration and can be used as an indicator in climate regulation potential service [12]. The results of percentage distribution of various categories of potential of climate regulations are significantly influenced by the ecosystems of arable land due to high share of area of these ecosystems in the total area of agricultural land. Out of the total area of agroecosystems for agricultural land up to 94.83% belong to the category of low potential of climate regulations (Figure 6). Agroecosystems of arable land located in lowlands are characterized by low potential for climate regulation and low average stocks of soil organic carbon. In higher altitudes, the average organic carbon stocks, and thus the potential of climate regulation is slightly rising.
The low potential of climate control for agroecosystems of arable soils is mentioned in Burghard et al. [63] work. The average stock of soil organic matter in arable land of Slovakia (at a depth 0 - 30 cm) ranges from 59 t C ha−1 (soils in altitudes from 0 to 300 m a.s.l.) to 67 t C ha−1 [64]. Carbon sequestration in arable soils is lower compared to the grassland [50] within the same soil type, therefore, in case of agroecosystems of arable soils there are no categories of high and very high potential of climate control. Cambel and Souster [65] and Schnitzer [66] report that intensive soil management reduces the amount of organic matter in the soil [66]. The average stock of soil organic matter in ecosystems of slovakian grasslands (0 - 30 cm deep) is ranging from 73 t C ha−1 (soil at altitudes from 0 to 300 m nm) to 86 t C ha−1 (land at an altitude above 600 m a. s. l.) [64]. The high and very high category of climate regulation is up to 58.04% of the agricultural grasslands area. In case of grassland ecosystems, cambisols, which are the most widespread soil’s type in Slovakia [67], are dominant soil type at higher altitudes (>300 m nm). Higher representation of the high category of climate control was also established in warm climatic zone (Figure 6). At elevated average temperatures, soil organic matter stock in arable soils decreased, as organic carbon inputs of plant residues and manure are not able to eliminate carbon losses due to faster mineralization [50] [68]. Agroecosystems of arable soils in colder regions have a higher potential for climate control.
DOI: 10.4236/oje.2018.812037 636 Open Journal of Ecology (Figure 7). The perception of the landscape in intensively and extensively farmed areas is also different, which, according to Martens [69], may negatively affect the attractiveness of intensive agricultural regions for recreation. The overall assessment of the potential of natural preconditions for recreation in % of agricultural land is strongly influenced by the ecosystem of arable soils (Figure 7), which has higher share in total area of evaluated agroecosystems. According to Burkhard et al. [63], agricultural use of grassland has predominantly medium potential to provide recreational services (outdoor activities).
Trade offs and Synergies between Agroecosystem Services
Ecosystem services are non-lineary linked and changes in one service can impact the others in positive or negative way [58] [70] [71]. Spake et al. [71] define synergies when multiple services are enhanced simultaneously and trade-offs when the provision of one service is reduced due to increased use of another service. For identifying and mapping agroecosystem services associations with regards to known land use (arable land or grassland), climatic zone PCA analysis and Spearmans pairwise correlation analysis were used to evaluate the relationships between ecosystem services [58] [72].
The first axis (Figure 8) of principal component analysis biplot for agroeco-system services of arable land represents a spatial trade-offs between climatic zones and provisioning services, regulation of water regime, pollutants filtration and regulation of soil erosion. The second axis PC2 describese a synergy between climatic zones and clima regulation and their trade-offs with potential of natural conditions for recreation. The first two components accounted for 70% of the total variation in agroecosystem services. The trade-offs between climatic zones and provisioning services and regulation of water regime are more pronounced in the case of grassland.
DOI: 10.4236/oje.2018.812037 637 Open Journal of Ecology soil cleaning (immobilization of inorganic pollutants). In the moderate warm climate zone and warm climate zone, the potencial of provisioning services and the potencial of water regulation are also mutually beneficial.
Figure 6. The climate regulation potential of agricultural land (arable land—AL—Figure to the left, grassland—G—Figure to the right), percentage of area for each category of potencial in four climatic regions. Explanations: the categoriesof potential: 1) very low potential, 2) low potential, 3) medium potential, 4) high potential, 5) very high potential.
[image:15.595.63.533.427.675.2]DOI: 10.4236/oje.2018.812037 638 Open Journal of Ecology Figure 8. PCA analyse Biplot for arable land PCA analyse Biplot for grassland. Labels: PAESS—provisioning agroecosystem, RWR—Regulating water regime, RSC—regulating soil cleaning, RSE—regulating soil erosion, RC—regulating clima, CAESS—cultural agroecosystem services.
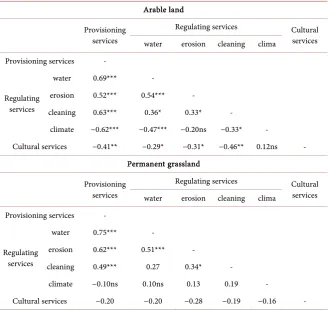
Table 3. Spearman correlations coefficients between agroecosystem services.
Arable land
Provisioning services
Regulating services Cultural
services
water erosion cleaning clima
Provisioning services -
Regulating services
water 0.69*** -
erosion 0.52*** 0.54*** -
cleaning 0.63*** 0.36* 0.33* -
climate −0.62*** −0.47*** −0.20ns −0.33* -
Cultural services −0.41** −0.29* −0.31* −0.46** 0.12ns -
Permanent grassland
Provisioning services
Regulating services Cultural
services
water erosion cleaning clima
Provisioning services -
Regulating services
water 0.75*** -
erosion 0.62*** 0.51*** -
cleaning 0.49*** 0.27 0.34* -
climate −0.10ns 0.10ns 0.13 0.19 -
Cultural services −0.20 −0.20 −0.28 −0.19 −0.16 -
Significance labels: ***p < 0.001, **p < 0.01, *p < 0.05, ns: non significant.
4. Conclusions
[image:16.595.210.540.262.572.2]DOI: 10.4236/oje.2018.812037 639 Open Journal of Ecology scheme, which is replicable and could be applied by planners in case that they are proficient in geographical information systems. This proposed mapping sys-tem can also be used to assess agro ecosyssys-tem services in the regions and districts in the Slovak Republic that provide guidelines and limits for policy development on land management and land use changes at local and regional levels. Applying the agroecosystem service concept can help to show the effects of land use, climatic conditions as well as human interventions by qualitatively and quantitatively analyzing trade-offs between different services and by supporting the development of site-specific, more sustainable land use strategies. According to Burghard et al. 2013 and Krkoška, Lorencova et al. (2016), the mainstreaming of agroecosystem services into national policy and decision making needs to be futher supported by assessments based on local or national data and more accurate model-ling approaches.
This study suggests that climate has the most significant impact on agroecosystem services. Warm, dry lowland region has a higher potential of provisioning services, regulation of water regime, filtration of pollutants and control of soil erosion in comparison to moderately warm and cold regions. In moderate cold region, more than 90% of the total arable land area has low potential for regula-tion water regime and cleaning potential (immobilizaregula-tion of risk elements). In moderate warm climatic region, there is a high share of categories of low and moderate potential of provisioning services and low and moderate potential of regulation of water regime. Majority of the total area of warm climatic region belongs to the categories of moderate to high potential of provisioning services and high potential of regulation of water regime. In this climatic zone categories of low potential of risk elements immobilization is present in more than 65% of the total arable land area. On the other hand, in very warm climatic zone, more than 89% of the total arable land area belongs to the category with very high cleaning potential (immobilization of risk elements). Potential of natural condi-tions for recreation is higher only in moderate cold and moderate warm climatic zones with higher proportion of grassland area agroecosystems and protected areas NATURA 2000.
Ecosystem services are non-lineary linked and changes in one service can impact the other in positive or negative way. High potential of provisioning service is linked to the high potential of regulation of water regime, pollutants filtration and soil erosion. The opposite trend has the potential provisioning services to potential of natural conditions for recreation. However, increasing of primary and secondary production of agroecosystems must be managed with regard to the sustainability of soil multifunctionality and also the sustainability of potential of agroecosystem to provide ecosystem services in their integrity. Agroecosystems management should always be oriented to the optimization of providing of the current needs within the sustainable use of agroecosystems.
Acknowledgements
DOI: 10.4236/oje.2018.812037 640 Open Journal of Ecology financial support via Project No. APVV-0098-12 “Analysis, modelling and evaluation of agroecosystem services” amd Project No. APVV-15-0160 “Elimi-nation of degradation processes in soil by biodiversity restoring”.
Conflicts of Interest
The authors declare no conflicts of interest regarding the publication of this pa-per.
References
[1] Nieto-Romero, M., Oteros-Rozas, E., Gonzáles, J.A. and Martin-López, B. (2013) Exploring the Knowledge Landscape of Ecosystem Services Assessments in Mediterranean Agroecosystems: Insights for Future Research. Environmental Science & Policy, 37, 21-133.
[2] Burkhard, B., Kandziorai, M.S. and Müller, F. (2014) Ecosystem Service Potentials, Flows and Demands—Concepts for Spatial Localisation, Indication and Quantification. Official Journal of the International Association for Landscape Ecology (IALE-D), 34, 1-32.
http://www.landscapeonline.de/103097lo201434
https://doi.org/10.3097/LO.201434
[3] Frélichová, J., Vačkář, D., Pártl, A., Loučková, B., Harmáčková, Z. and Lorencová, E. (2014) Integrated Assessment of Ecosystem Services in the Czech Republic.
Ecosystem Services, 8, 110-117. https://doi.org/10.1016/j.ecoser.2014.03.001
[4] Birghofer, K., Diehl, E., Andersson, J., Ekroos, J., Früh-Müller, A., Machnikowski, F., Mader, V.L., Nilsson, L., Sasaki, K., Rundlöf, M., Wolters, V. and Smith, H.G. (2015) Ecosystem Services—Current Challenges and Opportunities for Ecological Research.Frontiers in Ecology and Evolution, 2.
[5] Dominati, E., Patterson, M. and Mackay, A. (2010) A Framework for Classifying and Quantifying the Natural Capital and Ecosystem Services of Soils. Ecological Economics, 69, 1858-1868. https://doi.org/10.1016/j.ecolecon.2010.05.002
[6] Costanza, R. and Daly, H.E. (1992) Natural Capital and Sustainable Development.
Conservation Biology, 6, 37-463. https://doi.org/10.1046/j.1523-1739.1992.610037.x
[7] Dominati, E.J. (2013) Natural Capital and Ecosystem Services of Soils. In: Dymond, J.R., Ed., Ecosystem Services in New Zealand—Conditions and Trends, Manaaki Whenua Press, Lincoln.
[8] Makovníková, J., Pálka, B., Širáň, M., Kanianska, R., Kizeková, M. and Jaďuďová, J. (2017) Modeling and Evaluation Agroecosystem Services. (Modelovanie a Hodnotenie Agroekosystémových Služieb). Belianum Vydavateľstvo Univerzity Mateja Bela, Banskej Bystrici.
[9] (2005) Ecosystems and Human Well-Being: Our Human Planet: Summary for Decision Makers. The Millennium Ecosystem Assessment Series, MEA (Millennium Ecosystem Assessment), Vol. 5, Island Press, Washington DC.
[10] Burkhard, B., Kroll, F., Nedkov, S. and Müller, F. (2012) Mapping Supply, Demand and Budgets of Ecosystem Services. Ecological Indicators, 21, 17-29.
https://doi.org/10.1016/j.ecolind.2011.06.019
DOI: 10.4236/oje.2018.812037 641 Open Journal of Ecology
[12] Forouzangohar, M., Crossman, N.D., Richard, J., MacEwan, R.J., DugalWallace, O. and Bennett, L.T. (2014) Ecosystem Services in Agricultural Landscapes: A Spatially Explicit Approach to Support Sustainable Soil Management. Scientific World Journal, 2014, Article ID: 483298.
[13] Dominati, E.J., Mackay, A., Lynch, B., Heath, N. and Millner, I. (2014) An Ecosystem Services Approach to the Quantification of Shallow Mass Movement Erosion and the Value of Soil Conservation Practices. Ecosystem Services, 9, 204-215. https://doi.org/10.1016/j.ecoser.2014.06.006
[14] Yaalon, D.H. and Arnold, R.W. (2000). Attitudes toward Soils and Their Societal rElevance: Then and Now. Soil Science, 65, 5-12.
https://doi.org/10.1097/00010694-200001000-00003
[15] Vilček, J. and Koco, Š. (2018) Integrated Index of Agricultural Soil Quality in Slovakia. Journal of Maps,14, 68-76.
https://doi.org/10.1080/17445647.2018.1428233
[16] Coyle, C., Creamer, R.E., Schulte, R.P.O., O’Sullivan, L. and Jordan, P. (2016) A Functional Land Management Conceptual Framework under Soil Drainage and Land Use Scenarios. Environmental Science & Policy, 56, 39-48.
[17] Haines-Young, R., Potschin, M. and Kienast, F. (2012) Indicators of Ecosystem Service Potential at European Scales: Mapping Marginal Changes and Trade-Offs.
Ecological Indicartos, 21, 39-53.https://doi.org/10.1016/j.ecolind.2011.09.004
[18] Greiner, L., Keller, A., Gret-Regamey, A. and Papritz, A. (2017) Soil Function Assessment: Review of Methods for Quantifying the Contributions of Soils to Ecosystem Services. Land Use Policy, 69, 224-237.
https://doi.org/10.1016/j.landusepol.2017.06.025
[19] Juráni, B. (2005) Protection, Land Use and Human Impact (Ochrana, využívanie pôdy a vplyv človeka). In: Sobocká, J., Ed., Proseedings of Soil Science Conference, Societas Pedologica Slovaca and Soil Science and Conservation Research Institute, Bratislava, 178-180. (In Slovak)
[20] Bujnovský, R., Vilček, J., Blaas, G., Skalský, R., Barančíková, G., Makovníková, J., Balkovič, J. and Pálka, B. (2011) Assessment of Capacities of Soil and Effects from Its Use (Hodnotenie kapacít pôdy a efektov z jej využívania). Soil Science and Conservation Research Institute, Bratislava, 70 p. (In Slovak)
[21] Makovníková, J., Barančíková, G. and Pálka, B. (2007) Approach to the Assessment of Transport Risk of Inorganic Pollutants Based on the Immobilisation Capability of Soil. Plant, Soil and Environment, 53, 365-373. https://doi.org/10.17221/2215-PSE
[22] Barančíková, G., Koco,Š, Makovníková, J. and Torma, S. (2010) Filter and Transport Functions of Soil. Soil Science and Conservation Research Institute, Bratislava, 33 p. (In Slovak)
[23] MEA (Millennium Ecosystem Assessment) (2007) A Toolkit for Understanding and Action. Protecting Natures Services. Protecting Ourselves. Island Press, Washington DC, 28 s.
[24] TEEB (2010) The Ecnomics of Ecosystems and Biodiversity: Ecological and Economic Foundationd. Earthscan, London and Washington DC.
[25] Burkhard, B., Crossman, N., Nedkov, S., Petz, K. and Alkemade, R. (2013) Mapping and Modelling Ecosystem Services for Science, Policy and Practice. Ecosystem Services, 4, 1-3.https://doi.org/10.1016/j.ecoser.2013.04.005
DOI: 10.4236/oje.2018.812037 642 Open Journal of Ecology
https://doi.org/10.1016/j.ecoser.2017.09.008
[27] Burkhard, B. and Maes, J. (2017) Mapping Ecosystem Services. Advanced Books. [28] Scolozzi, R., Morri, E. and Santolini, R. (2012) Delphi-Based Change Assessment in
Ecosystem Service Values to Support Strategic Spatial Planning in Italian Landscapes. Ecological Indicators, 21, 134-144.
https://doi.org/10.1016/j.ecolind.2011.07.019
[29] Makovníková, J., Kobza, J., Pálka, B., Mališ, J., Kanianska, R. and Kizeková, M. (2016) An Approach to Mapping the Potential of Cultural Agroecosystem Services.
Soil and Water Research, 11, 44-52.https://doi.org/10.17221/109/2015-SWR
[30] Crossman, N.D., Burkhard, B., Nedkov, S., Willemen, L., Petz, K., Palomo, I., Drakou, E.G., Martín-Lopez, B., McPhearson, T., Boyanova, K., Alkemade, R., Egoh, B., Dunbar, M. and Maes, J. (2013) A Blueprint for Mapping and Modelling Ecosystem Services. Ecosystem Services, 4, 4-14.
https://doi.org/10.1016/j.ecoser.2013.02.001
[31] Naidoo, R., Balmford, A., Costanza, R., Fisher, B., Green, R.E., Lehner, B., Malcolm, T.H. and Ricketts, T.H. (2008) Global Mapping of Ecosystem Services and Conservation Priorities. Proceedings of the National Academy of Sciences of the USA, 105, 9495-9500.https://doi.org/10.1073/pnas.0707823105
[32] Schulp, C.J.E., Lautenbach, S. and Verburg, P.H. (2014) Quantifying and Mapping Ecosystem Services: Demand and Supply of Pollination in the European Union.
Ecological Indicators, 36, 131-141.https://doi.org/10.1016/j.ecolind.2013.07.014
[33] Bateman, I.J., Mace, G.M., Fezzi, C., Atkinson, G. and Turner, K. (2011) Economic Analysis for Ecosystem Service Assessments. Environmental and Resource Economics, 48, 177-218.https://doi.org/10.1007/s10640-010-9418-x
[34] Hönigová, I., Vackár, D., Lorencová, E., Melichar, J., Götzl, M., Sonderegger, G., Oušková, V., Hošek, M. and Chobot, K. (2012) Survey on Grassland Ecosystem Services, Report to the European Topic Centre on Biological Diversity. Nature Conservation Agency of the Czech Republic, Prague, 78.
[35] Frélichová, J. and Fanta, J. (2015) Ecosystem Service Availability in View of Long-Term Land-Use Changes: A Regional Case Study in the Czech Republic.
Ecosystem Health and Sustainabilty, 1, 1-15. https://doi.org/10.1890/EHS15-0024.1
[36] Olosutean, H. (2017) Methods for Modeling Ecosystem Services: A Review.
Management of Sustainable Development, 7, 5-12.
[37] Maes, J., Braat, L., Jax, K., Hutchins, M., et al. (2011) A Spatial Assessment of Ecosystem Services in Europe: Methods, Case Studies and Policy Analysis—Phase 1. PEER Report No. 3, Partnership for European Environmental Research, Ispra. [38] Hamnett, R.G. (2006) Country Pasture/Forage Resources Profile-Slovakia.
http://www.fao.org/ag/agp/agpc/doc/Counprof/slovak/slovakia.htm
[39] NAFC-SSCRI (2015) Distribution of Agricultural Land in Agro-Climatic Regions of Slovakia. http://www.podnemapy.sk/portal/reg_pod_infoservis/klima/klima.aspx [40] Džatko, M., Mašát, K. and Cambel, B. (1989) Agroclimatic Regions
SR-VCPÚ-ÚPVR, Bratislava.
[41] Čurlík, J. (2011) Potential Toxic Trace Elements and Their Distribution in the Soils of Slovakia. Faculty of Natural Sciences, Comenius University, Bratislava. (In Slovak)
DOI: 10.4236/oje.2018.812037 643 Open Journal of Ecology
Science and Conservation Research Institute, Bratislava, 252. (In Slovak)
[43] Van Camp, B., Bujarrabal, A.R., Gentile, R.J.A., Jones, L., Montanarella, L., Olazabal, O. and Selvaradjou, S.K. (2004) Reports of the Technical Working Groups Established under the Thematic Strategy for Soil Protection. EUR 21319 EN/5, 872. Office for Official Publications of the European Communities, Luxembourg. [44] Alam, M., Dupra, J. and Messier, C.H. (2016) A Framework towards a Composite
Indicator for Urban Ecosystem Services. Ecological Indicators, 60, 38-44.
https://doi.org/10.1016/j.ecolind.2015.05.035
[45] Seják, J., Dejmal, I., Petříček, V., Cudlín, P., Míchal, I., Černý, K., Kučera, T., et al. (2003) Assessment and Valuation of Biotopes of the Czech Republic. Praha, 428. (In Czech)
[46] Džatko, M. (2002) Evaluation of Production Potential of Agricultural Land and Soil-Ecological Regions of Slovakia. Soil Science and Conservation Research Institute, Bratislava, 87. (In Slovak)
[47] Bujnovský, R., Balkovič, J., Barančíková, G., Makovníková, J. and Vilček, J. (2009) Assessment and Valuation of Ecological Functions of Agricultural Land in Slovakia. Soil Science and Conservation Research Institute, Bratislava, 72. (In Slovak)
[48] Wischmeier, W.H. and Smith, D.D. (1978) Predicting Rainfall Erosion Losses: Guide to Conservation Planning. Agricultural Handbook No. 537, USDA, 58 p. [49] Majtaníková, J. (2011) Vyhodnotenie eróznej ohrozenosti vybraného pôdneho celku
na území povodia Hostovského potoka. In: Krajinné inžinierstvo-súčasný stav a výhľad do budúcnosti, Slovenská poľnohospodárska univerzita, Nitra.
http://www.slpk.sk/eldo/2011/zborniky/07-11/majtanikova.pdf
[50] Barančíková, G., Gutteková, M., Halas, J., Koco, Š., Makovníková, J., Nováková, M., Skalský, R., Tarasovičová, Z. and Vilček, J. (2011) Soil Organic Carbon in the Agricultural Landscape-Modeling of Changes in Space and Time. Soil Science and Conservation Research Institute, Bratislava, 85 p. (In Slovak)
[51] Sherrouse, B.C., Clement, J.M. and Semmens, D.J. (2011) A GIS Application for Assessing, Mapping, and Quantifying the Social Values of Ecosystem Services.
Applied Geography, 31, 748-760.https://doi.org/10.1016/j.apgeog.2010.08.002
[52] Krkoška Lorencová, E., Harmáčková, Z.V., Landová, L., Pártl, A. and Vačkář, D. (2016) Assessing Impact of Land Use and Climate Change on Regulating Ecosystem Services in the Czech Republic. Ecosystem Health and Sustainability, 2, e01210.
https://doi.org/10.1002/ehs2.1210
[53] Kanianska, R., Jaďuďová, J., Makovníková, J. and Kizeková, M. (2016) Assessment of Relationships between Earthworms and Soil Abiotic and Biotic Factors as a Tool in Sustainable Agricultural. Sustainability, 8, 906.
[54] EEA (2013) Technical Report No. 11/2013. The European Grassland Butterfly Indicator: 1990-2011. Publications Office of the European Union, Luxembourg, 36 p.
[55] Montoya, J.M. and Raffaelli, D. (2010) Climate Change, Biotic Interactions and Ecosystem Services. Philosophical Transactions of the Royal Society B, 365, 2013-2018.https://doi.org/10.1098/rstb.2010.0114
[56] Birkhofer, K. and Wolters, V. (2012) The Global Relationship between Climate, Net Primary Production and the Diet of Spiders. Global Ecology and Biogeography, 21, 100-108.https://doi.org/10.1111/j.1466-8238.2011.00654.x
DOI: 10.4236/oje.2018.812037 644 Open Journal of Ecology
Enemies: A Meta-Analysis. Journal of Applied Ecology, 50, 262-270.
https://doi.org/10.1111/1365-2664.12032
[58] Spake, R., et al. (2017) Unpacking Ecosystem Service Bundles: Towards Predictive Mapping of Synergies and Trade-Offs between Ecosystem Services. Global Environmental Change, 47, 37-50.https://doi.org/10.1016/j.gloenvcha.2017.08.004
[59] Kvitkovič, J. (1964) Concerning the Basic Geomorphological Problems of the East-Slovakian Lowland. Geografický Časopis, 20, 143-159. (In Slovak)
[60] Yong, R.N., Mohamed, A.M.O. and Warkentin, B.P. (1992) Principles of Contaminant Transport in Soils. Elsevier, London.
[61] Barančíková, G. and Makovníková, J. (2003) The Influence of Soil Humic Acid Quality on Sorption and Mobility of Heavy Metals. Plant, Soil and Environment, 49, 565-571.https://doi.org/10.17221/4195-PSE
[62] Makovníková, J. and Barancíková, G. (2009) Assessment of Transport Risk of Cadmium and Lead on the Basis of Immobilisation Capability of Soil. Soil and Water Research, 1, 10-16.
[63] Burkhard, B., Kroll, F., Müller, F. and Windhorst, W. (2009) Landscapes’ Capacities to Provide Ecosystem Services—A Concept for Land-Cover Based Assessments.
Landscape Online, 15, 1-22.
[64] Širáň, M., Makovníková, J. and Barančíková, G. (2013) Monitoring of Soil Bulk Demsity-Basis for Determination of Organic Matter Stock in Soil. Proseedings of Soil Science and Conservation Research Institute, Bratislava, 166-173. (In Slovak) [65] Campbell, C.A. and Souster, W. (1982) Loss of Organic Matter and Potentially
Mineralizable Nitrogen from Saskatchewan Soils Due to Cropping. Canadian Journal of Soil Science, 62, 651-656.https://doi.org/10.4141/cjss82-071
[66] Schnitzer, M., Mcarthur, D.F.E., Schulten, H.R., Kozak, L.M. and Huang, P.M. (2006) Long-Term Cultivation Effects on the Quality and Quantity of Organic Mater in Selected Canadian Prairie Soils. Geoderma, 130, 141-156.
https://doi.org/10.1016/j.geoderma.2005.01.021
[67] Bielek, P., Šurina, B., Ilavská, B. and Vilček, J. (1998) Our Soils (Agricultural) (Naše pôdy (poľnohospodárske)). Soil Science and Conservation Research Institute, Bratislava, 80. (In Slovak)
[68] Conant, R.T., Ryan, M.G., Ågren, G.I., Birge, H.E., Davidson, E.A., Eliasson, P.E., Evans, S.E., Frey, S.D., Giardina, C.P., Hopkins, F.M., Hyvönen, R., Kirschbaum, M.U.F., Lavallee, J.M., Leifeld, J., Parton, W.J., Steinweg, J.M., Wallenstein, M.D., Wetterstedt, J.A.M. and Bradford, M.A. (2011) Temperature and Soil Organic Matter Decomposition Rates-Synthesis of Current Knowledge and a Way Forward.
Global Change Biology, 17, 3392-3404.
https://doi.org/10.1111/j.1365-2486.2011.02496.x
[69] Martens, S.N., Breshears, D.D. and Meyer, C.W. (2000) Spatial Distributions of Understory Light along the Grassland/Forest Continuum: Effects of Cover, Height, and Spatial Pattern of Tree Canopies. Ecological Modeling, 126, 79-93.
https://doi.org/10.1016/S0304-3800(99)00188-X
[70] Felipe-Lucia, M.R., Comin, F.A. and Bennett, E.M. (2014) Interactions among Ecosystem Services across Land Uses in a Floodplain Agroecosystem. Ecology and Society, 19, Art. 20. https://doi.org/10.5751/ES-06249-190120
DOI: 10.4236/oje.2018.812037 645 Open Journal of Ecology
[72] Mouchet, M.A., Paracchini, M.L., Schulp, C.J.E., Stürck, J., Verkerk, P.J., Verburg, P.H. and Lavorel, S. (2017) Bundles of Ecosystem (Dis-)Services and Multifunc- tionality across European Landscapes. Ecological Indicators, 7, 23-28.
https://doi.org/10.1016/j.ecolind.2016.09.026
[73] Lescourret, F., Magda, D., Richard, G., Blondon, A.F.A., Bardy, M., Baudry, J., Doussan, I., Dumont, B., Lefèvre, F., Litrico, I., Clouaire, R.M., Montuelle, B., Pellerin, S., Plantegenest, M., Tancoigne, E., Thomas, A., Guyomard, H. and Soussana, L.F. (2015) A Social-Ecological Approach to Managing Multiple Agro-Ecosystem Services. Environmental Sustainability, 14, 68-75.
[74] Tomscha, S.A. and Gergel, S.E. (2016) Ecosystem Service Trade-Offs and Synergies Misunderstood 838 without Landscape History. Ecology and Society, 21, 43.